Big US Stocks’ Q1’21 Fundamentals


The red-hot US stock markets continue to power inexorably higher, fueling extraordinary complacency and euphoria. With stocks riding an extreme deluge of Fed money printing, selloffs are minor and far between. But are these seemingly-perpetual gains to endless lofty record highs justified fundamentally? The big US stocks’ winding-down Q1’21 earnings season illuminates how these elite companies are faring.
The performance of the flagship US S&P 500 stock index (SPX) has been amazing. In the first quarter of 2021, this dominant stock-market benchmark surged 5.8%. During those 61 trading days, the SPX hit new all-time-record closes on fully 15. The SPX stretched as high as 17.0% above its baseline 200-day moving average, extremely-overbought territory. Yet traders think the Fed has rendered material selloffs extinct.
Still in panic mode, that profligate central bank is conjuring up $120b per month out of thin air to monetize bonds! The Fed’s balance sheet, which is a proxy for the total number of US dollars in circulation, surged by 4.4% or $326b in Q1’21 alone. That annualizes to an almost-18% monetary-inflation rate. Some of that relentless flood of new fiat dollars from quantitative easing inevitably finds its way into stock markets.
The tidal wave of monetary liquidity sweeping stock prices higher is far larger than that. In March 2020 as stocks plummeted in a lockdown-induced panic, Fed officials were terrified the negative wealth effect would spawn another depression. So they spun up and overclocked their printing presses to truly-dizzying speeds. From the ends of Q1’20 to Q1’21, the Fed’s balance sheet skyrocketed 46.3% or $2,435b!
Those extreme monetary inflows are why the S&P 500 soared 53.7% higher in that same span. In the year leading into that stock panic, the Fed’s balance sheet grew a normal 4.6% or $184b. In the year after, it mushroomed a monstrously-grotesque 82.5% or $3,431b! It should be no surprise that such a radically-unprecedented diluvian torrent of liquidity directly catapulted the US stock markets far higher.
Virtually all traders agree the Fed’s largesse fueled this extraordinary US-stock-market rally. But while bulls think the resulting super-high stock prices are righteous given the US economic recovery, bears are convinced they are an exceedingly-dangerous Fed-blown bubble. Four times a year after the quarterly earnings seasons, the rubber meets the road for comparing underlying corporate performances to stock prices.
American companies have 40 days after quarter-ends to report their latest operating and financial results. With 35 of those days passed as of the middle of this week, most of the big US stocks have reported their Q1’21 performances. Every quarter I wade through the latest official 10-Q quarterly reports required by the Securities and Exchange Commission for the 25 largest SPX stocks. They dominate nearly all portfolios.
At the end of March, these giant companies accounted for 40.8% of the weighting of the entire S&P 500! The colossal S&P 500 exchange-traded funds are the biggest in the world. The SPY SPDR S&P 500 ETF, IVV iShares Core S&P 500 ETF, and VOO Vanguard S&P 500 ETF commanded a staggering $363b, $278b, and $221b of investors’ capital this week. Retirement funds are heavily weighted in the SPX top 25.
And since stock-market performance affects so many other markets, the SPX top 25’s quarterly results are very important for all speculators and investors. Capital flows into and out of bonds, the US dollar, and leading alternative assets like gold and cryptocurrencies are heavily influenced by stock-market fortunes. So closely watching the big US stocks’ price trends and fundamentals is universally important for all traders.
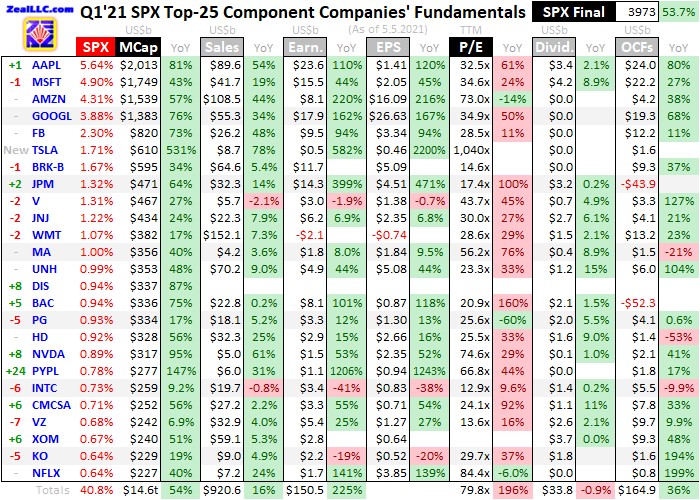
This table outlines key fundamentals of the 25 largest companies in the US stock markets. Their stock symbols are preceded by how their rankings within the SPX shifted in the year since the end of Q1’20. After their symbols these companies’ actual percentage weightings within the S&P 500 at the end of Q1’21 are shown, along with their market capitalizations in billions back when that reporting quarter was ending.
Their market caps, as well as their other fundamental data, are followed by year-over-year changes from the ends of Q1’20 to Q1’21. Looking at market-cap changes offers a purer read on companies’ values than stock-price changes, normalizing out some manipulative effects of corporate stock buybacks. Those are done to artificially boost share prices and earnings per share, maximizing executives’ compensation.
Quarterly revenues, GAAP corporate profits, earnings per share, trailing-twelve-month price-to-earnings ratios as of quarter-end, dividends paid, and operating cash flows generated are shown. These key data are also followed by YoY changes. Blank fields usually mean a company hadn’t reported that particular data as of mid-week. Disney for example is dragging its feet, keeping shareholders waiting until May 13th.
Percentage changes are also excluded if they are misleading or not meaningful, primarily when data shifted from positive to negative or vice versa. Unfortunately some companies run goofy fiscal quarters offset from calendar ones, making them harder to compare with their peers. Walmart, Home Depot, and NVIDIA report on quarters ending one month later than normal. So their latest-reported quarters are included.
The elite big US stocks dominating the S&P 500 reported spectacular performances last quarter! But they sure as heck should have with the Fed nearly doubling the US-dollar supply, and most Americans showered with helicopter-money direct payments from the US Treasury. Those stimmies were quickly spent, unleashing huge demand for the goods and services many of these massive companies produce.
The beloved Big Five mega-cap tech stocks in particular continue to reign over the SPX and entire US stock markets. Apple, Microsoft, Amazon, Alphabet, and Facebook were strong-performing universal market darlings before the pandemic lockdowns hit. Then the resulting epic shift towards spending far more time at home proved incredibly beneficial for them. They alone now account for 21.0% of the S&P 500!
That is more than the next 20 largest US companies in this table, which collectively weighed in at 19.8%. And the Big Five’s performances in Q1 were utterly astonishing. There continues to be a vast bifurcation between the gravity-defying numbers they are putting up and the rest of the US stock markets. So how the big US stocks are doing fundamentally has to be considered as mega-cap techs versus everything else.
The total market capitalizations of the SPX top 25 skyrocketed 53.7% year-over-year to a record $14.6t. The top four mega-cap techs each sported dumbfounding trillion-dollar-plus market caps! Like massive oil supertankers with so much inertia that they are very slow to start, stop, and turn, the colossal sizes of these behemoths limit their stock-price upside potential. The capital inflows required to propel them are vast.
So what did that $2,435b of Fed money printing in the year ending March 31st buy? Incredible growth in the big US companies’ businesses. Together all 25 reported total revenues of $921b, which surged a record 15.6% YoY! Yet that total remained well short of Q4’19 when the SPX top 25’s sales hit $949b. That is mostly a component-mix issue, with smaller high-flying tech stocks muscling their way into the top 25.
As an example, cellular-telephony giant AT&T was the 16th largest American stock in Q1’20. It reported nearly $43b in revenues in that comparable quarter. Yet by the end of Q1’21, it had been forced down to 27th. Replacing it newly into the rarefied ranks of the SPX top 25 was the computer-graphics-chip leader NVIDIA, which only had $5b in sales last quarter. Disney’s latest quarterly results missing in action contributed.
But those Big Five mega-cap techs utterly dominated that massive revenues growth. Their sales soared a truly-astounding 41.1% YoY to $321b! That shouldn’t even be possible given their colossal scales, but the stay-at-home trend coupled with raining stimmies unleashed wildly-unprecedented demand. The rest of the SPX top 25 excluding those market-darling techs only saw their revenues climb 5.4% YoY to $599b.
Apple, Microsoft, Amazon, Alphabet, and Facebook have reported strong sales growth for years on end, although nothing like this extreme outlying Q1’21. At some point that has to slow dramatically as demand stabilizes. Given their leviathan-scale sizes and heavy weightings in virtually all stock portfolios, when the Big Five sneeze the entire stock markets will catch a cold. The concentration risk is stellar in these lofty markets!
With Americans flush with new iPhones and iPads, will they feel the need to upgrade again in the next few years? Can Microsoft keep squeezing more subscription revenues out of software that we used buy outright? Will Amazon’s sales keep soaring as people’s stimmies dwindle and they have to start budgeting again? Will businesses keep buying ads from Alphabet and Facebook as stimulus money wanes?
Make no mistake, this crazy past year was an exceedingly-extreme anomaly. The Fed has never printed trillions of new dollars before in a single year, nor has the Treasury injected trillions of dollars into people’s bank accounts. That deluge of new money baked into the system is already spawning runaway inflation. This central bank and federal government can’t risk unleashing nation-slaying hyperinflation by keeping this up.
Reckonings always follow debt-financed spending binges. After anything is done to excess, the delayed price must still be paid. The colossal outsized demand fueled by extreme money printing over this past year pulled much buying forward. Americans and companies indulging in fulfilling wants and needs won’t have to buy those same things again for years in cases of durable goods. That is ominous for US stocks.
On the hard-earnings front under Generally Accepted Accounting Principles required by the SEC, Q1’21 also proved a blowout quarter. The SPX top 25 collectively earned nearly $151b last quarter, rocketing up a staggering 225% YoY! Yet that was still shy of Q4’20’s $169b. And that phenomenal growth was greatly skewed by a single company, which is Warren Buffett’s giant Berkshire Hathaway conglomerate.
Berkshire is the biggest American company after the Big Five mega-cap techs and millennial favorite electric-car maker Tesla. As essentially an investment holding company, Berkshire is required to flush unrealized gains and losses in its vast investments through income statements every quarter. This makes Buffett’s blood boil, he rails against it every chance he gets. Thus Berkshire’s bottom line swings wildly.
Thanks to that lockdown-induced stock panic in Q1’20, the S&P 500 plummeted 20.0% that quarter! So Berkshire’s unrealized losses on stock positions were so colossal that it reported a $50b loss. In Q1’21, that swung to net income near $12b. There is no other company with such crazy-volatile profits. So if we back out Berkshire from both quarters, the rest of the SPX top 25 had $139b of earnings which surged 44.6% YoY.
Again the incredibly-lucky right-place-right-time mega-cap techs dominated these soaring profits. Their hard bottom-line accounting earnings skyrocketed an unbelievable 105.7% YoY to nearly $75b! Yet the rest of the SPX top 20 ex-Berkshire only earned $64b which just grew a trifling 7.4% YoY. This is really important for framing the entire S&P 500’s valuation, which overwhelmingly depends on the Big Five techs.
Wall Street strategists often discuss the earnings multiple of the entire SPX. They’ll lump together all the profits for all 500 companies, and compare them to this index’s current levels. That earnings number is seeing big growth, lowering apparent market valuations. But the better earnings certainly aren’t universal, they are heavily concentrated in the mega-cap tech behemoths! Their profits growth is masking broader weakness.
So if demand for the products and services of Apple, Microsoft, Amazon, Alphabet, and Facebook falters, their resulting earnings hits will leave the entire stock markets way more overvalued. While these elites commanding 21% of the entire S&P 500’s market cap is already huge, their profits are a much-greater fraction of all SPX companies’. So the Big Five’s concentration risks are way larger than most traders realize.
In addition to total profits, I also like to look at earnings-per-share data to see how stock buybacks goosed reported profits. They leave fewer shares to spread earnings across, resulting in higher per-share numbers. Apple of course is the buyback king, pouring tens of billions of dollars into actively manipulating both its stock price and EPS higher. So while its total profits skyrocketed 110% YoY, EPS bested that up 120%!
Despite blockbuster overall revenues and earnings mostly-driven by the Big Five techs, valuations for these Fed-levitated stock markets remain deep into dangerous bubble territory. At the end of Q1’21, the SPX top 25 averaged trailing-twelve-month price-to-earnings ratios way up at 79.8x. That nearly tripled from the end of Q1’20 after that stock panic! Thankfully that is skewed way high by the new inclusion of Tesla.
Despite barely making any money, this electric-car manufacturer was inducted into the S&P 500 late last year. It was a favorite stock for millennial traders to pour their stimmies into, so its market cap rocketed 531% higher between the ends of Q1’20 to Q1’21! That radically dwarfed everything else in the SPX top 25. Tesla enthusiasts apparently see a future where all this company’s profits aren’t from regulatory credits.
Last quarter 118% of Tesla’s GAAP earnings resulted from selling regulatory credits! It continues to lose money actually making cars, as has been the case for its entire history. Even with these big government handouts subsidizing Tesla, it still exited Q1’21 trading at an absurd 1,040 times its latest-four-quarters’ reported earnings! At this rate, it would take Tesla over 1,000 years to earn back its current stock price!
Excluding Tesla’s ludicrous valuation, the rest of the SPX top 25 averaged TTM P/Es of 36.2x. That sounds way better, only up 34% YoY. But it is still deep into bubble territory. Over the last century and a half or so, stock-market valuations have averaged 14x earnings which is fair value. Twice that at 28x is where the bubble threshold begins. The Fed has absolutely inflated a monster stock-market bubble.
All bubbles end badly, in brutal secular bears forcing stock prices to fall low enough for long enough to let earnings catch up. Assuming the SPX top 25’s profits stayed at these extreme Fed-money-printing-fueled levels, the SPX would have to plunge 63% to 1,535 to hit fair value at 14x! And if earnings retreat when the monetary backdrop stabilizes, that could be even lower. Stock prices being cut in half isn’t even unusual.
The S&P 500’s last two secular bears after extreme overvaluations ended in October 2002 and March 2009. The SPX plummeted 49.1% over 2.6 years and 56.8% over 1.4 years during those necessary rebalancing events, to drag stock prices back down to reasonably reflect underlying corporate earnings! Most traders seem to assume central-bank money printing can render bears extinct, or at least delay them.
The Fed has two choices. It can keep running the money pumps overtime, blowing liquidity into the radically-overvalued US stock markets. But that deluge of capital will eventually result in hyper-inflation, destroying the US dollar’s value through extreme dilution. Eventually terrible inflation hammers even the stock markets. Or the Fed can slow, stop, or reverse the monetary excess, bursting the stock bubble it spawned.
Letting a long-overdue bear market restore normal valuations to stock markets would be far less harmful to Americans than extreme inflation. But for years Fed officials have lacked the courage to take their heavy feet off the monetary accelerator. Either way, stock markets can’t stay deep into bubble territory forever. And interestingly the all-important mega-cap techs are even more overvalued than the rest of the SPX top 25.
At the end of Q1’21, Apple, Microsoft, Amazon, Alphabet, and Facebook averaged TTM P/Es of 40.7x. The next 20 largest US companies ex-Tesla traded at 34.8x earnings. So even without falling profits as spending normalizes post-stimmies, the Big Five are more vulnerable to serious valuation-driven selloffs then the rest of the stock markets. That’s why higher 10-year Treasury yields have disproportionately hit techs.
While last quarter’s results were spectacular for the big US stocks, their extreme overvaluations are a serious downside risk. With Q1’21’s huge profits coming into the rolling-four-quarter average used in price-to-earnings-ratio calculations, these valuations have moderated some. But that is dependent on these epic profits being sustainable, which just can’t happen as the money printing and stimulus checks wane.
Again over the year ending Q1’21, the S&P 500 rocketed 53.7% higher. But the majority of that was due to what Wall Street euphemistically calls “multiple expansion”, which is stocks becoming more expensive relative to underlying corporate earnings. With SPX-top-25 average P/Es ex-Tesla up 34% YoY, that implies nearly 2/3rds of this past year’s massive stock-price gains weren’t fundamentally justified at all.
While stock buybacks have soared as executives try to manipulate their compensation higher, actually returning real cash to shareholders via dividends slumped. These big US stocks’ total dividends slipped 0.9% YoY to $34b despite their colossal earnings. The Big Five techs’ grew 5.8% near $8b, while the next 20 largest US companies’ dividends fell 2.6% to $26b. Corporate owners aren’t sharing in this pandemic windfall.
The SPX top 25 generated $165b in cashflows from operations last quarter, which really lagged profits growth only surging 35.8% YoY. That number excludes the mega-banks JPMorgan Chase and Bank of America, as their operating cashflows are wildly volatile and not comparable to non-bank companies. Operating cash flows growing slower than earnings suggest cost cutting was a considerable driver of the latter.
But the costs corporations have to pay for goods, services, and employees are surging dramatically. The Fed’s extreme money printing is to blame, with vastly more dollars chasing and competing for far-more-slowly-growing pools of things to spend them on. That is bidding up the prices paid on everything, which means cost cutting is finished. Now companies are raising prices to pass along higher costs to customers.
Of course higher costs cascading through global supply chains strengthen the inflationary impulse fueling higher prices. That in turn boosts inflation expectations among speculators and investors, leading them to allocate capital differently. As inflation erodes profit margins and total earnings since customers can’t spend as much, stock markets look less attractive. So investment portfolios are shifted into alternative assets.
That’s one reason bitcoin and leading cryptos have skyrocketed this year, though they are in speculative manias now. Hard assets including commodities are the traditional go-to destination during times of big monetary inflation. Naturally supply-growth-constrained gold leads that trade, surging on soaring money supplies. The gold-mining stocks tend to leverage their metal’s advances by 2x to 3x, blasting way higher.
That’s why we’ve been deploying our capital in high-potential fundamentally-superior gold stocks and silver stocks in our newsletters this year. As the Fed’s dire predicament and the precarious state of these bubble-valued stock markets becomes more apparent, speculators and investors alike will increasingly pour into gold and its miners’ stocks. Their gains in the coming years on this tidal wave of inflation will be massive.
At Zeal we walk the contrarian walk, buying low when few others are willing before later selling high when few others can. We overcome popular greed and fear by diligently studying market cycles. We trade on time-tested indicators derived from technical, sentimental, and fundamental research. That’s why all 1178 stock trades recommended in our newsletters since 2001 averaged hefty +24.0% annualized realized gains!
To multiply your wealth trading high-potential gold stocks, you need to stay informed about what’s going on in this sector. Staying subscribed to our popular and affordable weekly and monthly newsletters is a great way. They draw on my vast experience, knowledge, wisdom, and ongoing research to explain what’s going on in the markets, why, and how to trade them with specific stocks. Subscribe today while this gold-stock upleg remains young! Our newly-reformatted newsletters have expanded individual-stock analysis.
The bottom line is despite reporting blowout Q1’21 results, the big US stocks’ valuations remain deep in dangerous bubble territory. While sales and profits soared, that growth was overwhelmingly concentrated in the handful of mega-cap techs. And they benefitted greatly from the colossal helicopter-money stimulus payments to Americans. As stimmies dry up and spending returns to normal, demand will greatly slow.
With inflation already running away, neither the federal government nor Fed can afford to keep injecting trillions of dollars into the US economy for long. As that extreme pace of money printing slows, the stock markets directly buoyed by it will have to deflate. And it’s a long, long ways down for stock prices until they reasonably reflect even Q1’s incredibly-strong corporate earnings. That’s very bearish for stock markets.
Adam Hamilton, CPA
Copyright 2000 - 2021 Zeal LLC (www.ZealLLC.com)
********


