Bond Yields Continue Advancing as QT Approaches


This week the Dow Jones seems to have figured out what its path of least resistance was; Down, if only by about 2% from last week’s close. I don’t know if the Dow Jones will see things the same again next week. Maybe next week will be different. But in the months to come, I see more deflation in market valuations due to pending changes in the FOMC’s “monetary policy.”
- Its second quantitative tightening (QT #2), a $95 billion dollar a month, month after month QT,
- Promises to increase their Fed Funds Rate in fifty basis point increments several times during the remainder of 2022.
If Powell’s Not QE #4 propelled the financial markets upwards for almost two years, his QT #2 is a promise the idiot savants at the FOMC are going to put the economy and markets into full reverse for the foreseeable future. Be afraid, be very afraid when the FOMC actually begins draining “liquidity” from the financial system in the weeks to come.
I don’t know about you, but I’m already anticipating the gale-force winds coming from Hurricane Powell, though it is still far from making landfall.
So far, it’s the debt markets that have taken the brunt of Hurricane Powell. Yields have been trending upwards, and valuations downward for months. Since the bottom of the March 2020 flash-crash, consider Powell’s Not QE #4’s historic inflows of monetary inflation from the FOMC; they’ve buoyed the financial markets these past two years.
Ahh, those were the good ole days. What’s coming is something completely different. It’s only to be expected that a promised reversal of this flow of monetary inflation (Powell’s QT #2), would cause some disquiet, and valuation deflation in the market place.
Valuations in the debt markets are in the early stages of a big move downward (bond yields upward). Since the bottom of the sub-prime mortgage bear market, corporate America has been gorging on cheap credit in the corporate bond market. Many famous names in the stock market may not survive what is coming their way in the coming years. Private citizens and governments have the same problem with their balance sheets; too many liabilities and too few liquid assets.
Currently, everyone’s income can service their debts. But what makes recessions and depressions so depressing, is how streams of income can be curtailed, or completely eliminated. If only old debt, obligations taken on during the good times were as simple to deal with. They are not though, as during the good times, or the bad, creditors want their principle and interest payments paid on time. Come some lean years in the economy, I see economic pain and suffering on the rise.
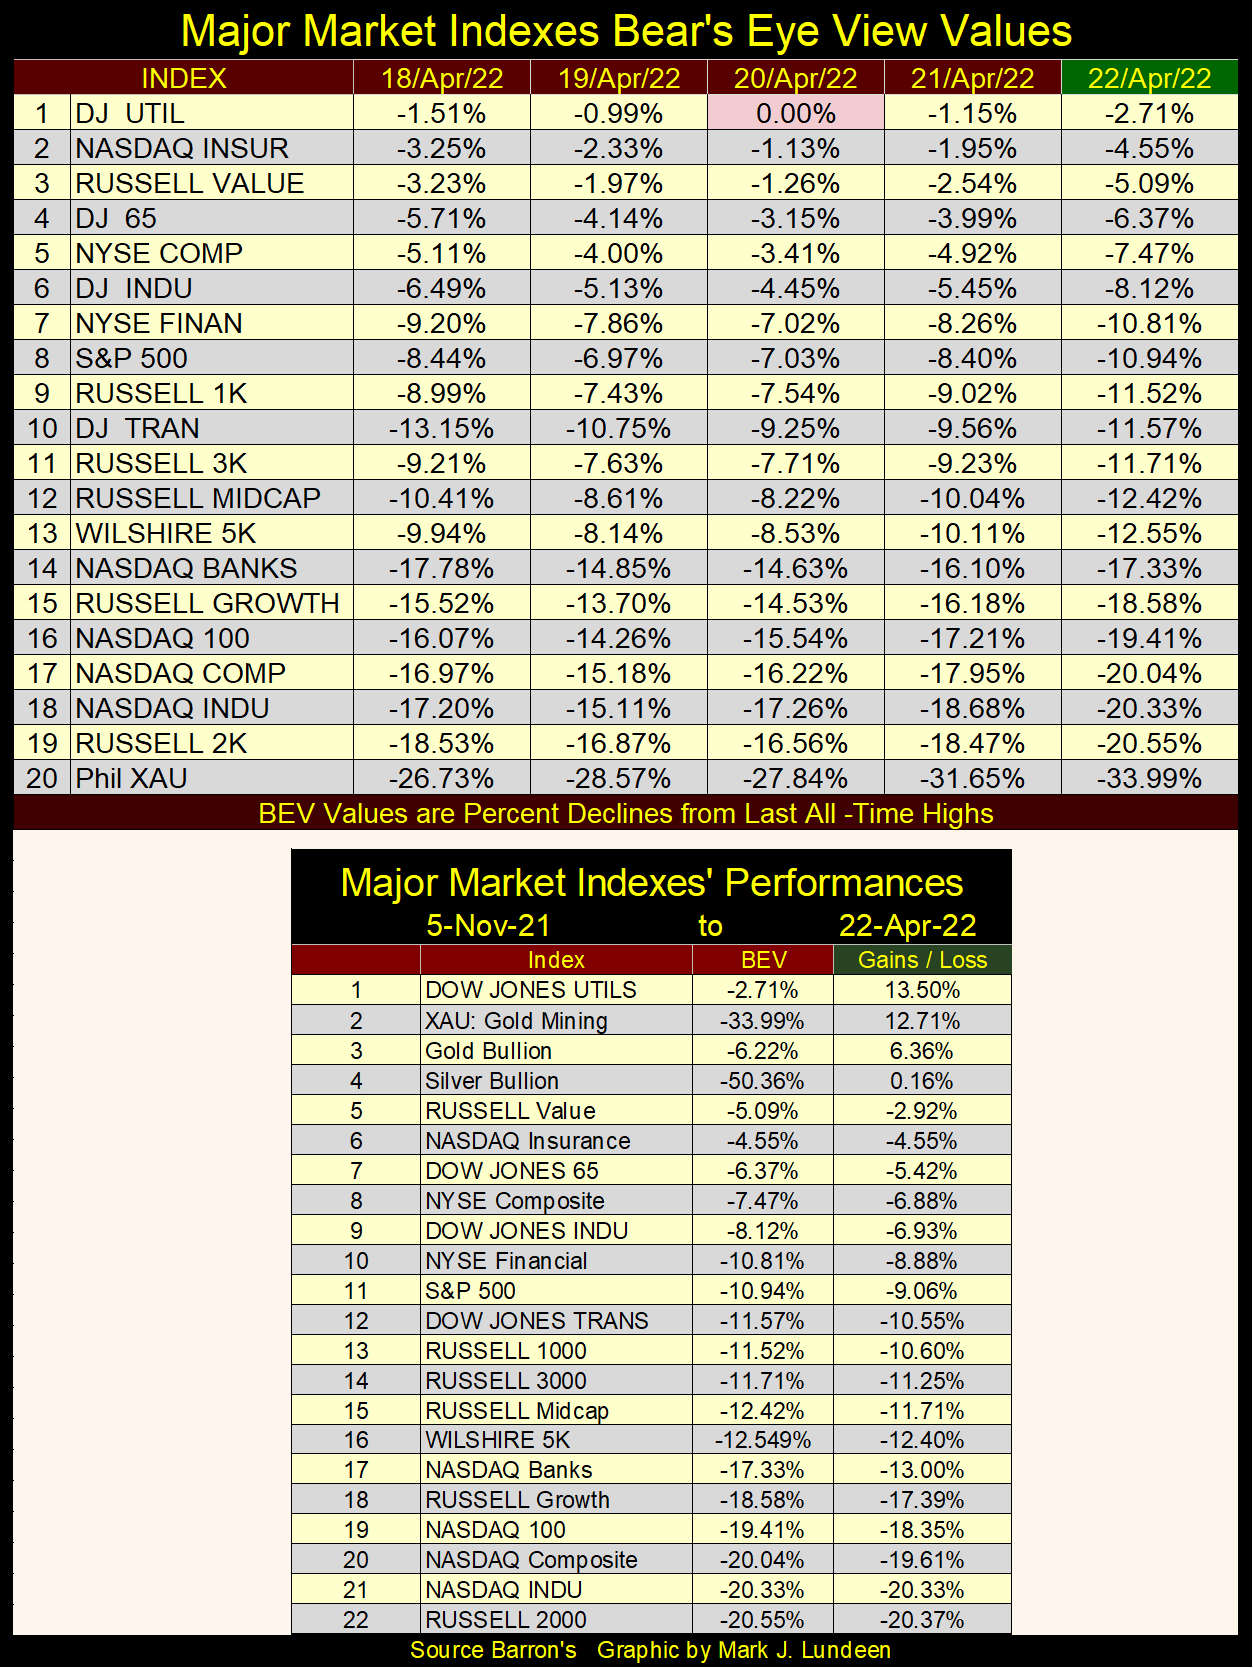
Considering everything happening in the bond market (see below), I think the Dow Jones is lucky being only 8.12% from its last all-time high at the close of this week. A month from now, we’ll see how lucky the Dow Jones continues to be.
The Dow Jones Utilities saw another BEV Zero this week, its tenth since early March, and the NASDAQ Insurance Index remained in scoring position (-0.01% to -4.99%) this whole week. However, the other major indexes seen below, like the Dow Jones, are also headed down. In most cases even more so. Below, I see some BEVs below their psychologically important BEV -20% level.
But that is what market indexes do; they go up, and then they go down. If this is a bull market, these market declines are a healthy development in the stock market, even had the Dow Jones’ BEV deflated below its BEV -20% level.
The BIG QUESTION is: *ARE WE STILL IN A BULL MARKET?* Not if the bond & debt markets continue deflating!
The following chart plotting yields for the Barron’s Best and Intermediate Grade Corporate bonds really freaks me out. These yields, since the first of the year, continue advancing (prices deflating), then in March these trends intensified.
Are we to see short-term pullback in these yields before the QT #2 takes a bite out of the market? Or are we going to once again see a selling panic in the corporate bond market, and corresponding spike in bond yields as we did in March 2020, but from these elevated levels?
If so, how will the multi-hundred trillion OTC interest-rate derivate market respond to such a shocking development in the debt markets? “Market commentators” seen to have forgotten this huge market in derivatives. But that doesn’t mean it still isn’t there.
It seems I’m always plotting bond yields. So below, I have daily prices for the Dow Jones Corporate Bond Index. If you’re a bull on the stock market, this is not a pretty chart, as maybe some of the companies you own stock in have bonds in this index. And deflation in the bond market isn’t just Mr Bear running around making mischief, but a concern in the debt markets of rising default risks in the companies whose bonds we see below.
What companies are these? I don’t know or care. If you do, contact the friendly people at Dow Jones. And they are friendly. From personal experience, they are very helpful when inquiring minds ask such questions.
As if all the above wasn’t bad enough, below we see how mortgage rates have aggressively been rising in the past six months. For the average wage earner, their homes are the most significant asset they own. Looking at the rate spike below in mortgages, it appears Mr Bear is coming for them too.

Rising consumer prices, and rates and yields in the debt markets, and being aware of how overextended everybody, and everything is after the FOMC had “injected” many trillions of dollars into the financial system since March 2009, in the wake of the mortgage crisis, if you’re looking for someone to hold your hand as you “invest” in one of today’s glamor issues from silicone valley. Sorry, but I decline the honor.
I could be wrong. I’ve been wrong before. But my advice would be to get out of the stock market ASAP. As far as any exposure to the bond market goes, I’m sure all bond portfolios have seen double-digit percentages declines since last November. There is an old adage in the market; the first loss is the best loss. Bigger losses are coming to the debt markets, so I’d get out of them too.
Looking at the Dow Jones in daily bars below, I believe it will be a long time before it makes a new all-time high, but wouldn’t be surprised should it close below 30,000 before June of this year.
With five trading days left in April, the Dow Jones could close below, or much closer to 30,000 before next Friday’s close. That’s not a prediction. I’m only considering how the foundations of the post March 2020 flash crash bull market, Powell’s Not QE #4 bull market, begun to crumble since last November. And now comes Powell’s QT #2.
Thinking about all the bad news coming from the debt markets these past few months. It seems the stock market has some catching up to do to the downside. It could do so at any time, next week or next month.
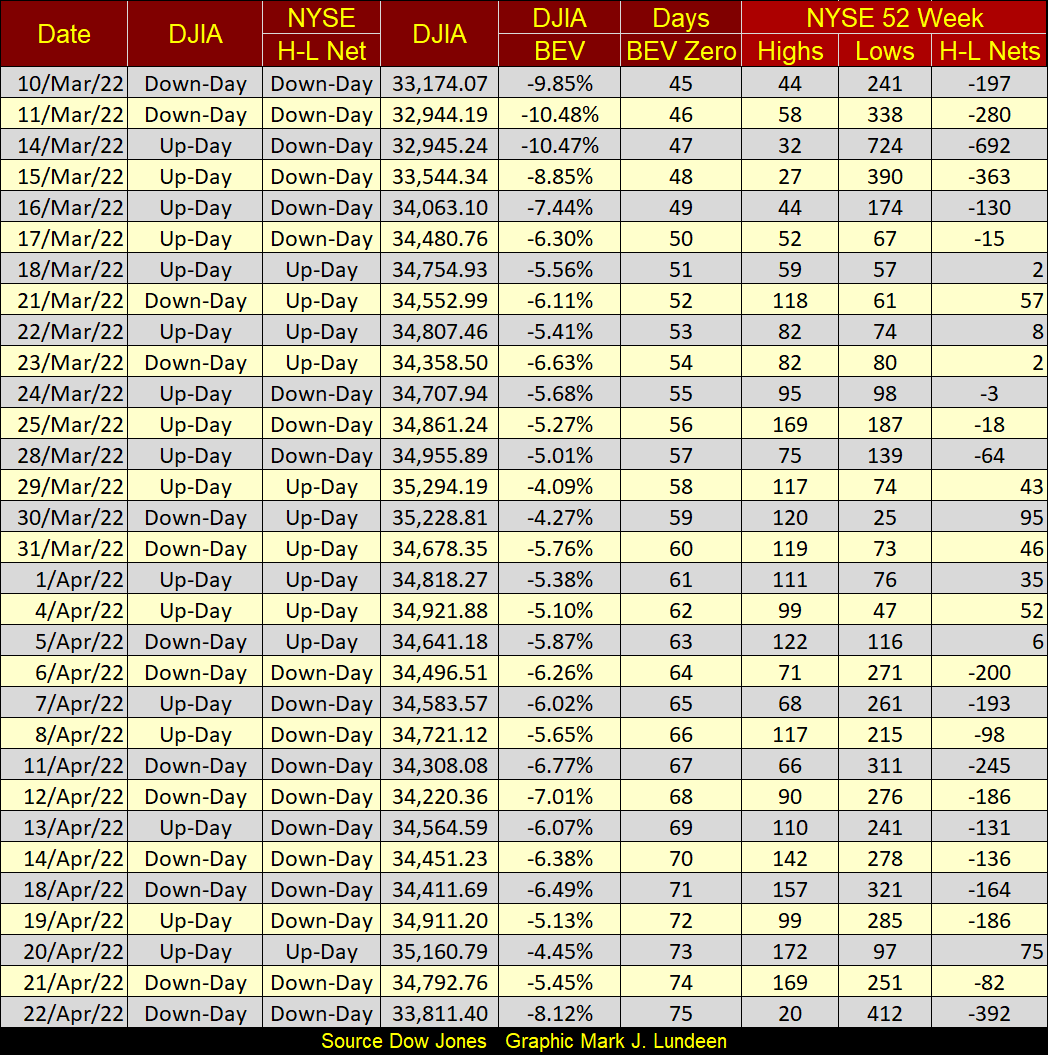
One more graphic on the stock market; the NYSE 52Wk Highs and Lows table below. On March 11th the Dow Jones, with a BEV of -10.48% hit a correction low. The following trading day the NYSE’s H-L Net hit a big -692.
Typically, after a big negative H-L net at the NYSE, the stock market is ready to rebound, and we’d see a recovery in 52Wk highs. But that didn’t happen below. Since March 11th, 52Wk Lows have dominated 52Wk Highs at the NYSE, with negative nets out numbering positive nets. Now on this Friday’s close, the 52Wk H-L net saw a hefty negative net of -392. I don’t have a good feeling about this market.
So, what have the idiot savants at the FOMC done this past week? Best way to see that is by looking at their weekly purchases of Treasury bonds’ 10Wk M/A chart below. Looking at the table on the left of the chart, this is the third week this 10Wk M/A has been in single digits, which is no small thing when you look at where it has been in the past two years; much higher, as seen plot below.
Looking at the plot within the red circle, it continues trending down. When it passes below its red Zero line, the idiots have begun their second Quantitative Tightening (QT #2) since the termination of their QE #3 in 2015. According to their press release, they intend to drain $95 billion dollars a month, month after month beginning in May. May is only a week away.
What does a QT, promising to drain $95 billion a month, month after month mean? During a QE, the FOMC purchases T-bonds. If you look at the table (above), in Barron’s 24 January 2022 issue, they purchased $86.27 billion in the open market. $86.27 billion in monetary inflation was created that week for this purchase; so, the Federal Reserve gets the T-bonds, and the financial system gets its “injection” of “liquidity”.
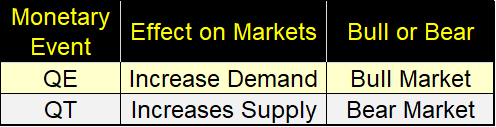
When the FOMC purchases T-bonds, it increases demand in the T-bond market, which for the week of 24 January 2022 was an increase in demand by $86.24 billion. This supports bond prices and keeps bond yields low. This “injection” of monetary inflation also supports prices in the stock market, and prices in other markets too. For instance, the price of gas at filling stations and cabbage at supermarkets everywhere.
This process is reversed in a QT, where the FOMC now sells T-bonds it previously purchased, back into the T-bond market, withdrawing the monetary inflation it had previously “injected” in the market. During a QT, the FOMC is increasing supply in the T-bond market, by selling their bonds into it. When a market, any market receives an increase in supply, this suppresses prices in the market. When that market is a debt market, such as the T-bond market, lower bond prices also result in higher bond yields.
So, QTs are deflationary, as they add supply to a market that normal market demand may not be able to absorb, at pre-QT pricing levels. Should the FOMC’s QT also motivate others to sell their T-bonds because of falling prices, it could create a selling panic in the market. This is exactly what happened in October 2019, when the FOMC abruptly terminated their first QT as a panic developed in the overnight repo market that sent overnight interest rates into double-digits.
It’s a dangerous game the idiots are playing; this QT. So far; it’s Mr Bear 1 / FOMC 0. It’s a game the FOMC has yet to win, and in my opinion, with little prospects they ever will.
So, I don’t anticipate this plot (in red circle above) actually going negative until June or so. It will be interesting seeing how many billions of dollars of T-bonds the idiots will sell each week in the months to come.
So, readers won’t have to go back to the Dow Jones Corporate Bond Index above; I’ve posted it again below.
There are early indications the debt markets have been anticipating less than positive results from the idiots’ pending QT. Valuations in the Dow Jones Corporate Bond Index (below) have deflated 13.7% since the first week of last November. For a bond index yielding 2.35% five months ago (4.29% this week), seeing these bond valuations deflate by 14% since November is a big deal.
In April 2022, there is more reason than not believing this deflationary trend in the bond market has much more to go before it stops. In my opinion, until the entire bond market yields something above the rate of CPI inflation, this bear market in bonds will continue.
The Department of Labor asserts CPI inflation is something just above 8%. Looking at the increases in my cost of living in the past year, that is ridiculous. Something deep into double-digit percentages seems more reasonable.
So, I’m expecting current yields in the bond market to continue rising until they too are deep into the double-digit percentages. And future prices for the Dow Jones Corporate Bond Index seen below, far below where we see them at this week’s close. We are far from the point in time when it makes sense to begin bargain hunting in the bond market.
I noted the March, 04-18 2020 valuation collapse in the above chart. I assign this market mishap to the FOMC’s QT #1 (January 2018 to October 2019), the FOMC’s first QT. At the bottom of this plunge in valuation, Chairman Powell announced the FOMC would, for the first time, begin to purchase corporate bonds.
The thing that stands out above is how well corporate bonds did during the last half of the first QT. From January 2018, to the panic in the overnight repo market in October 2019, the valuation in these corporate bond’s continued advancing. It wasn’t until early March 2020 (five months later) that panic, from out of nowhere, finally came to the corporate bond market – ten trading sessions straight down. No wonder the FOMC needed to “stabilize” the corporate bond market.
The corporate bond market in January 2018, four years ago at the start of QT #1, didn’t care, and would not until two years later in March 2020. Things are now different in the corporate bond market. This time bonds began selling off six months ago, and likely to intensify their sell off as the idiots’ QT #2 actually begins.
The mortgage market, chart below, has seen a very worrisome yield spike since last January. Like so many other markets, the mortgage market too has seen significant changes since late last year.
This data comes from the St. Louis Federal Reserve Bank. So, if this week they post mortgage rates at 5.11%, mortgage rates offered to people at banks must be something greater.
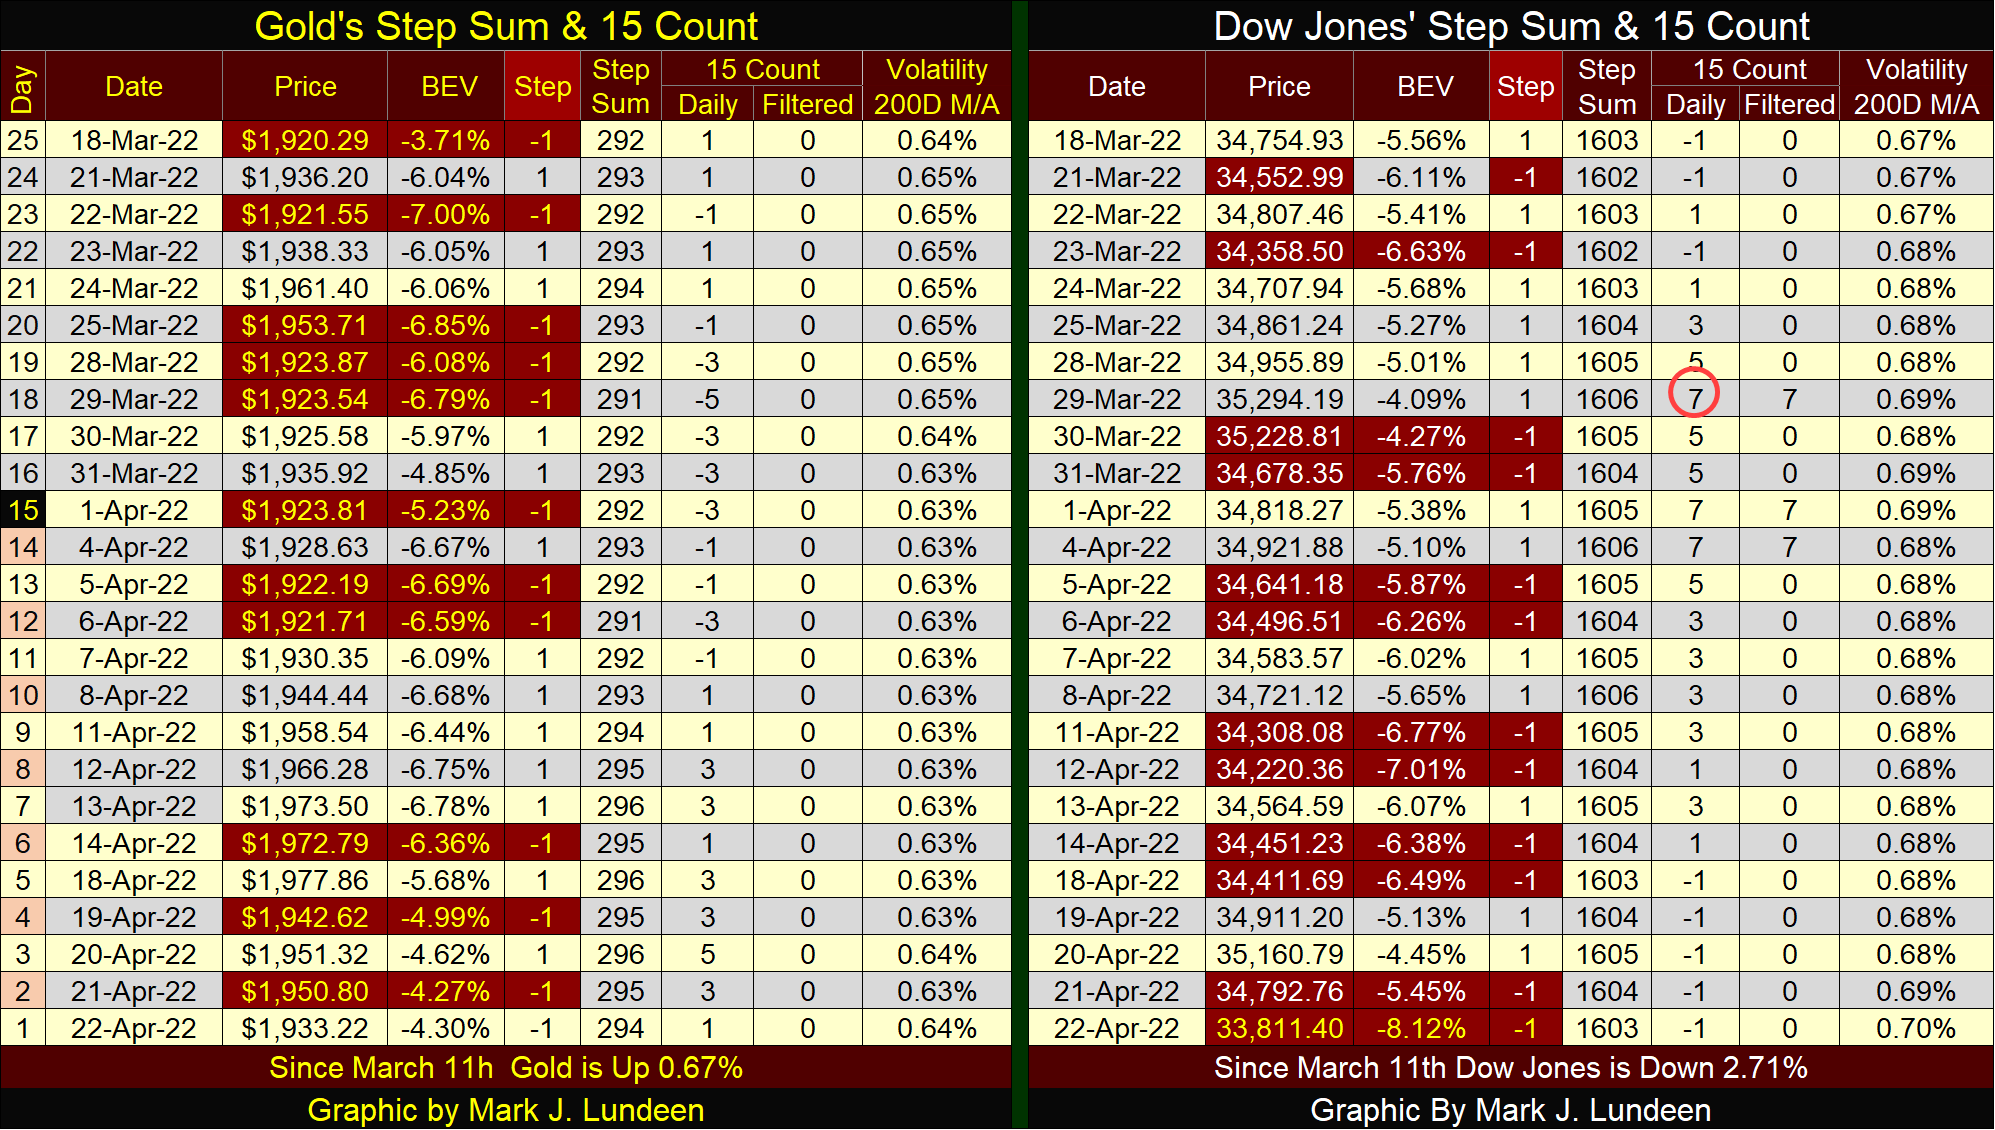
Let’s look at gold’s BEV chart. Gold’s BEV chart remains bullish. Though not in scoring position this week, as it was at last week’s close. With a BEV of -6.22%, it was still closer to its last all-time high than the Dow Jones’ BEV of -8.12% at this week’s close.
This week again, I’m going to skip gold and the Dow Jones’ step sum charts as they bore me, and will continue to bore me until we see some market action to the up or down side in these markets.
Here are their step sum tables. The item I noted was at the close of this week; the Dow Jones daily volatility’s 200D M/A had increased to 0.70%. Should daily volatility in the Dow Jones continue advancing, that would be a negative development in the stock market. Typically, should this market metric exceed 1.00%, you won’t need me to tell you that the stock market is selling off.
Here is something from the Epic Economist on the current supply chain disruption. Instead of listing the shortcomings in today’s supply chain, I’ll let you view this fifteen-minute video that is well worth your time.
https://www.youtube.com/watch?v=SPQzyVzaqIU
Mark J. Lundeen
********
More from Gold-Eagle


