Boring Market – BUT Could Explode At ANY Time


Three months and what do we have but a steady slightly negative drift in the price of gold. However, nothing lasts forever…so we just might see some volatile action soon. What will precipitate it? Who knows? And in what direction will this volatility move? Again, who knows…but here we might make some good educated guesses based upon historical price movements and price patterns.
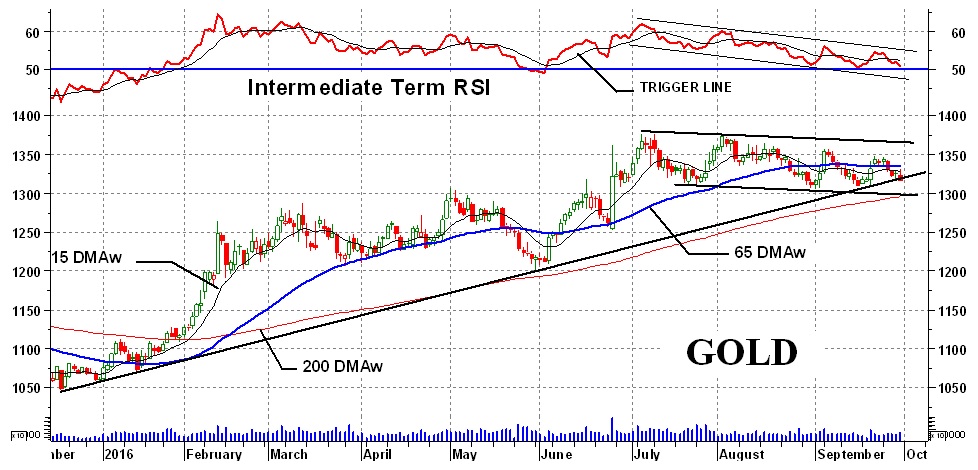
Daily trading activity such as represented by the above gold chart is based upon thousands of traders risking their capital on the price moving up or down depending upon their best information of the assumed future price direction. The up and down direction of the daily price action on the chart shows the battle between the bulls and bears each temporarily in control while the other takes a rest. Over the past three months the bears have been pushing the trend very gently in the negative direction. This has formed a gentle downward sloping flag pattern (or if you wish, a “box” pattern) in both the price and momentum. After a sharp upward move these gently sloping flag patterns are thought to be temporary rest periods with the next move being to the up side continuing the previous bull trend. This is text book stuff, but I like to wait for the move to be confirmed, rather than anticipate it before jumping in.
I took a look at my short term Point&Figure chart to see what it has to say. The long-term projection (to $2150) remains in effect. However, on the shorter-term we are just waiting for the next direction to show itself. A move to the $1380 (new high) level would give us the next short-term projection to $1640. A move to the $1300 level would, however, give us a short-term projection to $1010. A move to $1300 would also break below that long-term third FAN Principle trend line (shown) confirming a bear trend in effect. So, let’s see what the basic indicators are telling us.
Long-Term
The long-term indicators are still in basically positive territory but acting weak. The Friday gold price closed above the positive long-term moving average line. The long-term momentum indicator is still in positive territory although slightly below its negative trigger line. For now the long-term rating still remains BULLISH but getting weaker.
Intermediate-Term
Up and down, up and down, it seems the price just can’t make up its mind which way to go but I guess that’s all part of a lateral drift process. This is why we average out the action over some designated period to take away a lot of the daily volatility.
The Friday close was below the intermediate-term moving average line - as the line is in a gentle downward slope. The intermediate-term momentum indicator remains just a hair above its neutral line, in the positive zone, but below its negative sloping trigger line. Despite the slightly positive momentum (but ready to go negative) the only intermediate-term rating I can give gold is a BEARISH rating. This is further confirmed by the short-term moving average line remaining below the intermediate-term line for a negative indication of trend.
Short-Term
I guess we are waiting for the short-term price to make its concerted move and break its present lateral trend. Everything here from the short-term indicator stand point is negative. The price closed on Friday below its short-term moving average line and the line remains sloping downward. The short-term momentum indicator remains in its negative zone below its negative sloping trigger line. So, from a short-term rating perspective the price trend is BEARISH. As for the action this past week;
Gold lost $24.60 or 1.8%
Silver lost $0.60 or 3.0%
Texas Light Sweet Crude gained $3.70 or 8.5% (brief comment to follow below)
Gold And Silver Stocks
The raw numbers for the past week look like this;
NYSE Arca Gold Miners Index (GDM) lost 16.76 points or 2.2%
NYSE Arca Gold BUGS Index lost 3.99 points or 1.7%
PHLX Gold/Silver Sector Index lost 1.76 points or 1.8%
Merv’s Gold & Silver 100 Index lost 2.7%
Merv’s Penny Arcade 50 Index lost 3.6%
Merv’s Silver 30 Index lost 2.5%
Merv’s Canadian Energy 100 Index gained 3.1% (more below)
Merv’s Gold And Silver 100 Index
The largest 100 gold and silver stocks trading on the North American markets had a bad week. After a strong seven months of upside activity, the Index topped out in early August and has been showing weakness in the group ever since. The long-term indicators are still mostly positive, but not the intermediate or shorter-term. The Index is below both moving averages and the averages are pointing downward. The shorter-term moving average has been below the intermediate-term moving average for the past month. Based upon the basic indicators I can only rate the shorter and intermediate-term as BEARISH while the long-term is still BULLISH.
As for the overall performances, the short term BULL/BEAR comes in as 29% positive and 60% negative. The intermediate term is 18% positive and 72% negative while the long term is 39% positive and 37% negative. These long term numbers just didn’t seem to square with the rating above but that’s the way it come across. There are a lot of neutral stocks that are ready to go negative but not yet. On the week there were 22 stocks closing higher, 76 closing lower and 2 going nowhere.
PENNY MERV’S ARCADE 50 INDEX
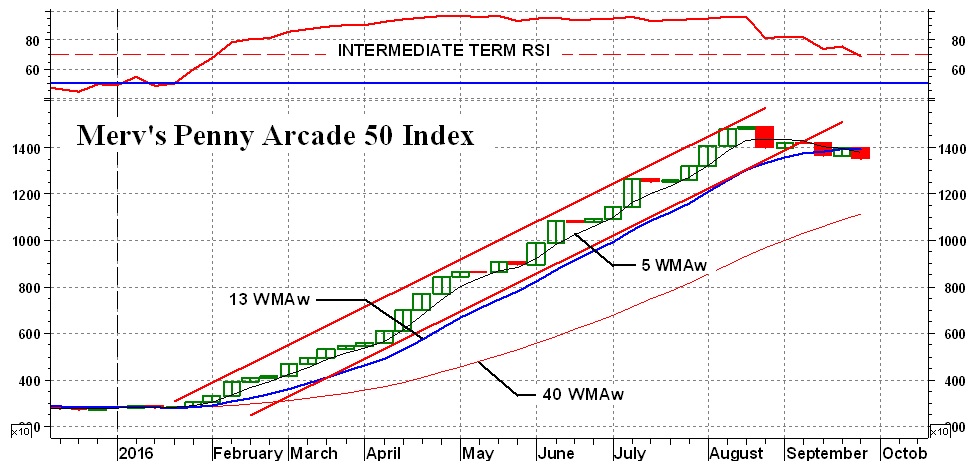
Well I guess it had to happen sooner or later. The “penny” stocks have had their day…at least for now. This is just not the time to be looking at speculating in the pennies unless one is not worried about the increased risk of speculating in bummers.
We see here an Index that has broken its long-term up trend line as well as its shorter and intermediate-term moving average lines. The Index closed the week at new reaction lows. The long-term rating is still BULLISH although not the intermediate-term. Both the shorter and intermediate-term are rated as BEARISH with further confirmation by the shorter-term moving average trading below the intermediate-term average.
The intermediate-term momentum indicator has been deep in overbought territory since early February, an excellent example why one would not act on this one indicator, refraining from acting just because the indicator is overbought. Wait till the indicator moves back below its overbought line as it did this past week.
To get back into the penny speculating game it’s now a waiting game until the indicators turn around to the up side for a reduction in the risk factor.
As for where these stocks are in overall BULL/BEAR performance, 18% are positive and 71% are negative shorter-term wise, 22% positive and 72% negative intermediate-term wise and 51% positive and 41% negative wise. 12 stocks closed higher during the week, 33 closed lower and 5 were going nowhere.
MERV’S CANADIAN ENERGY 100 INDEX
This Index contains all of the stocks in the S&P/TSX Capped Energy Index plus additional secondary Canadian energy stocks to fill the gap to the 100 level. Despite a gain of 8.5% in Texas Light Sweet Crude during the week the Merv’s Canadian Energy 100 Index only gained 3.1%. The S&P/TSX Capped Energy Index gained 5.6% so it looks like the secondary stocks were the lower performing stocks to lower the gain in the Merv’s 100. Still, the group looks better poised for further gains. It all depends on the performance of oil and as we all know that is often more due to global politics than anything else. The intermediate term projection noted here some weeks back, to the $35 level, is still in effect. A move by oil to the $52 level would be needed to nullify this projection at which time a new projection to at least the $62 level would be possible. However, a move to $42 would continue the downward drift in the oil price, to that $35 level.
********
Readers are invited to view my Facebook page at https://facebook.com/merv.burak where I will be slowly posting commentaries explaining in more detail my various indicators and techniques. I also present from time to time some individual stocks that look as if they may be good speculations. However, nothing I post is meant to be a recommendation to buy or sell. One should check with their broker or investment advisor before acting.
 Merv is a retired Aerospace Engineering consultant. He is also a retired market technician with over 40 years of market experience and research. Merv received his certification as a Chartered Market Technician (CMT) in 1992. Developer of many technical techniques and programs which he has been using in his previous Technically Speaking with Wil-Arm and Technically Precious with Merv commentaries posted throughout the globe. Developer of several gold and silver Indices, Merv continues to update his Merv’s Gold & Silver 100 Index and Merv’s Penny Arcade 50 Index and reviews them during his periodic on-going Technically Precious commentaries.


