Breakdowns Of DOW Stocks And Breakouts Of Gold Price


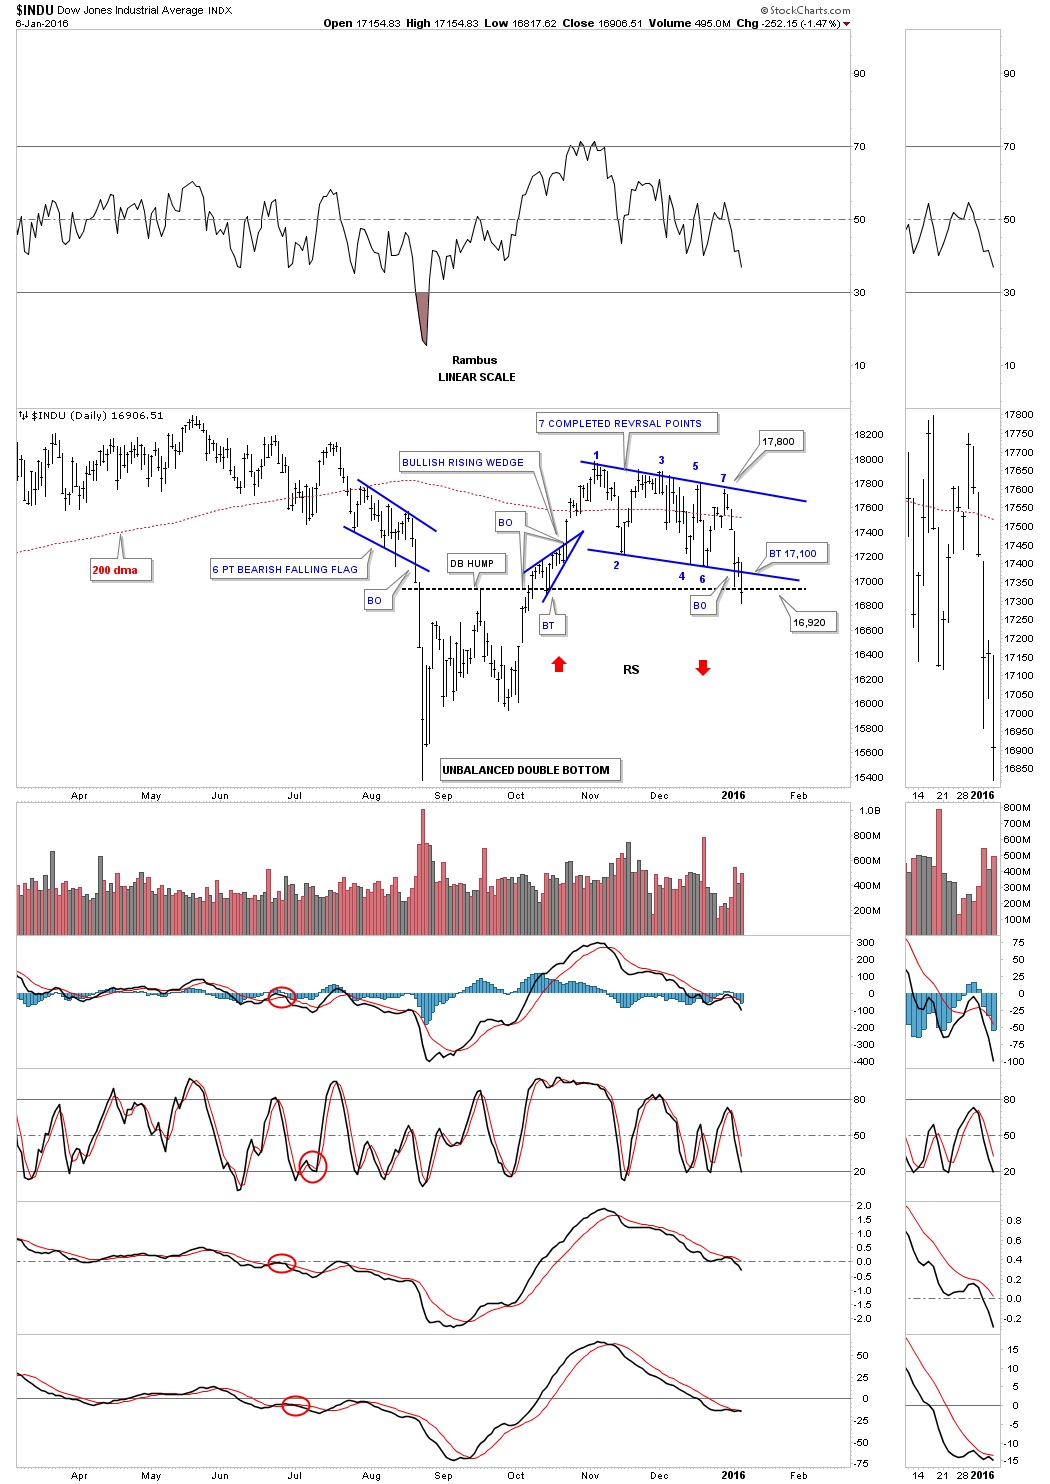
Today felt like an inflection point in gold and the DOW INDU with both breaking important trendlines. As there is a lot of ground to cover tonight let’s get right to the charts starting with the daily look at the DOW INDU. Today the INDU finally closed below the bottom rail of the now seven point bearish falling flag and the double bottom trendline at 16,920. This was a big deal IMHO. We may see a little backing and filling in this general area, but today’s move clearly setup a pattern of lower highs and lower lows. Note the six point bearish falling wedge that formed back in July of last year. As it formed below the previous high it needed an even number of reversal points to complete the pattern to the downside. Because our current seven point bearish falling flag formed at the top it needed to have an odd number of reversal points to make a reversal pattern. One last point on the chart below which shows two red arrows one point up and the other pointing down. As you can see the rally out of the low made in October was vertical only taking three days. The red arrow pointing down shows how it’s possible we may see the INDU reverse symmetry back down over the same area as shown by the red arrow pointing up.
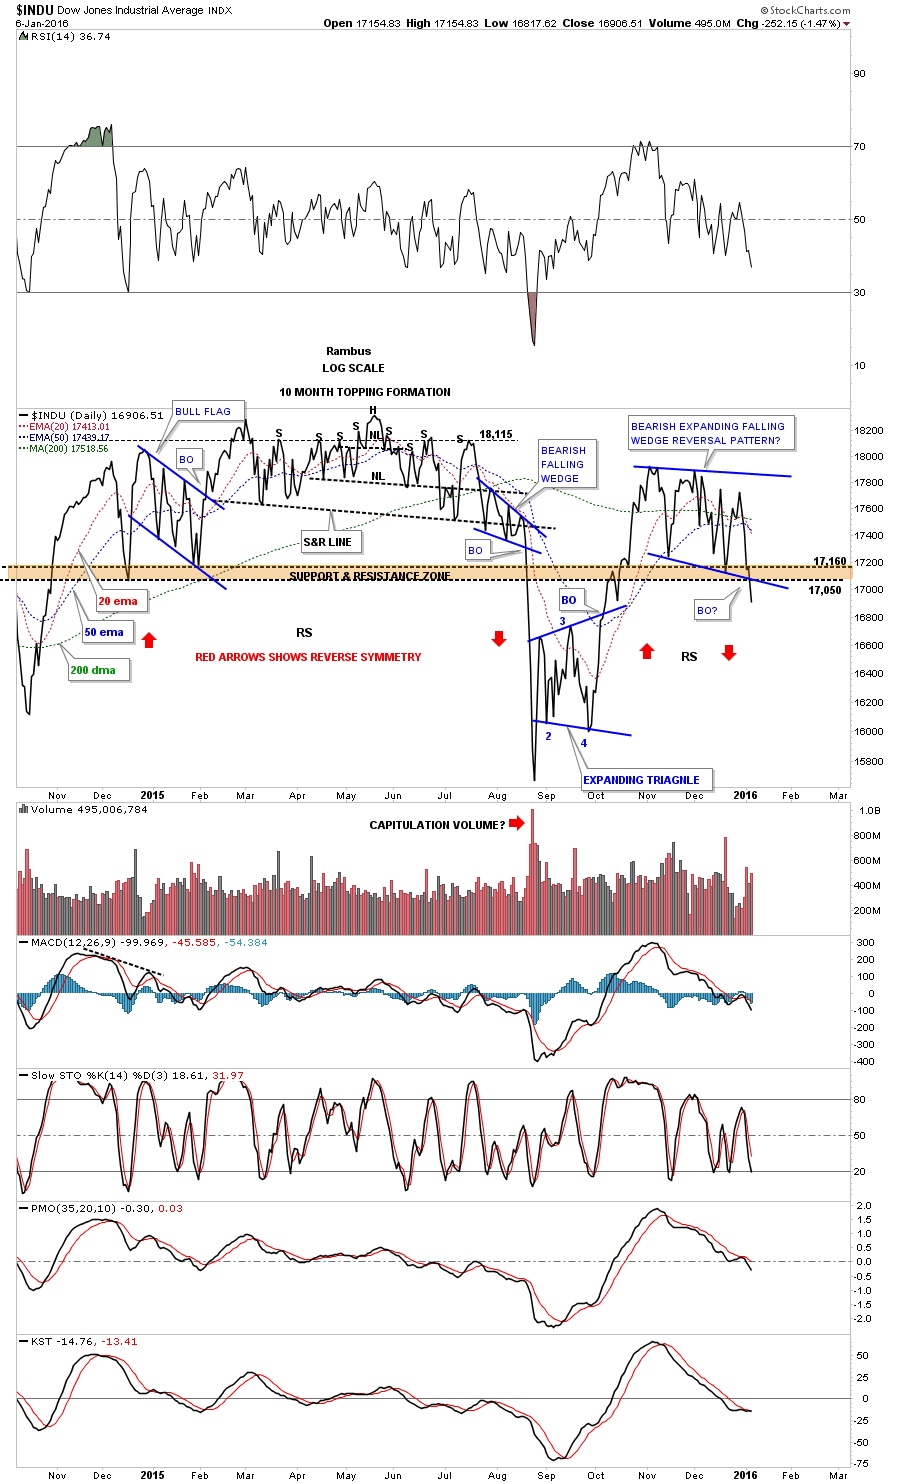
Below is a daily line chart for the INDU which shows it closing below the brown shaded support and resistance zone today. Also the 20 ema crossed below the 50 ema giving a sell signal.
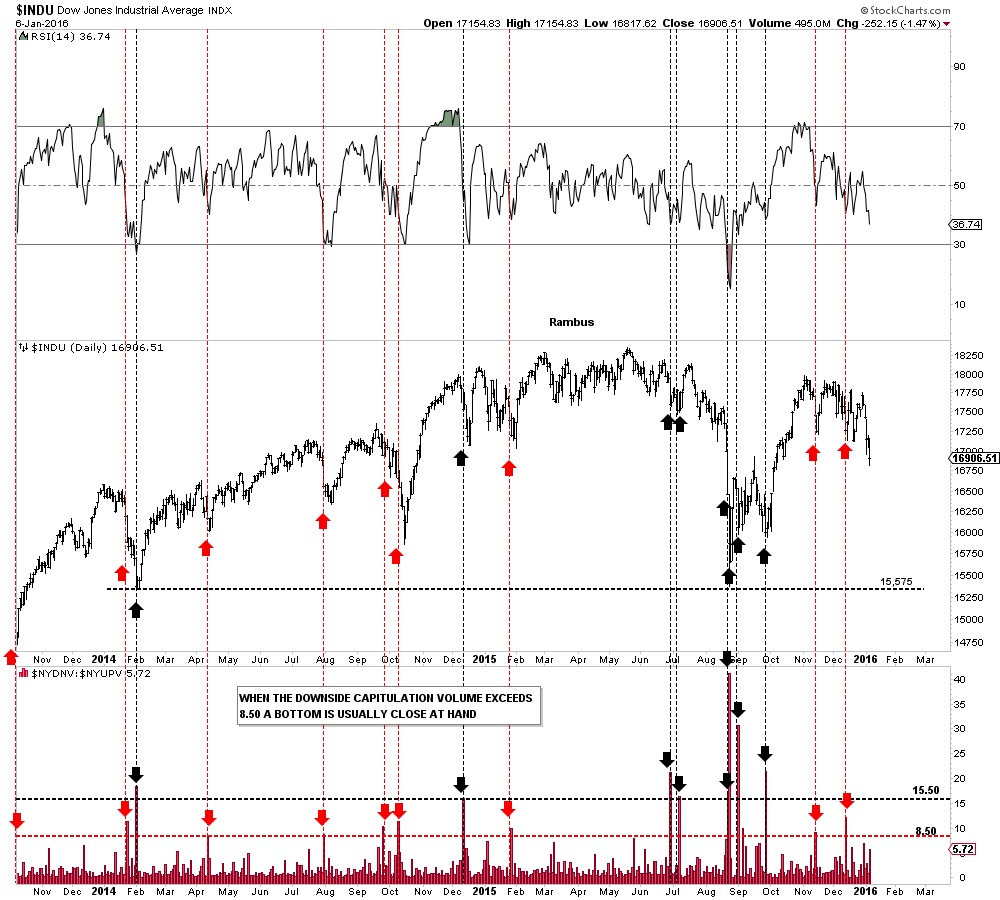
This next chart for the INDU is the down to up volume chart which shows when the down volume out paces the up volume in a big way we usually see some capitulation take place and get a bounce. We had a red arrow in November and December which showed some mild capitulation and a small rally. What’s interesting about this chart right now is that the INDU is making a lower low but the down to up volume isn’t showing any capitulation. As long as the INDU can keep declining without any capitulation spikes the further it can fall before we get some type of relief rally.
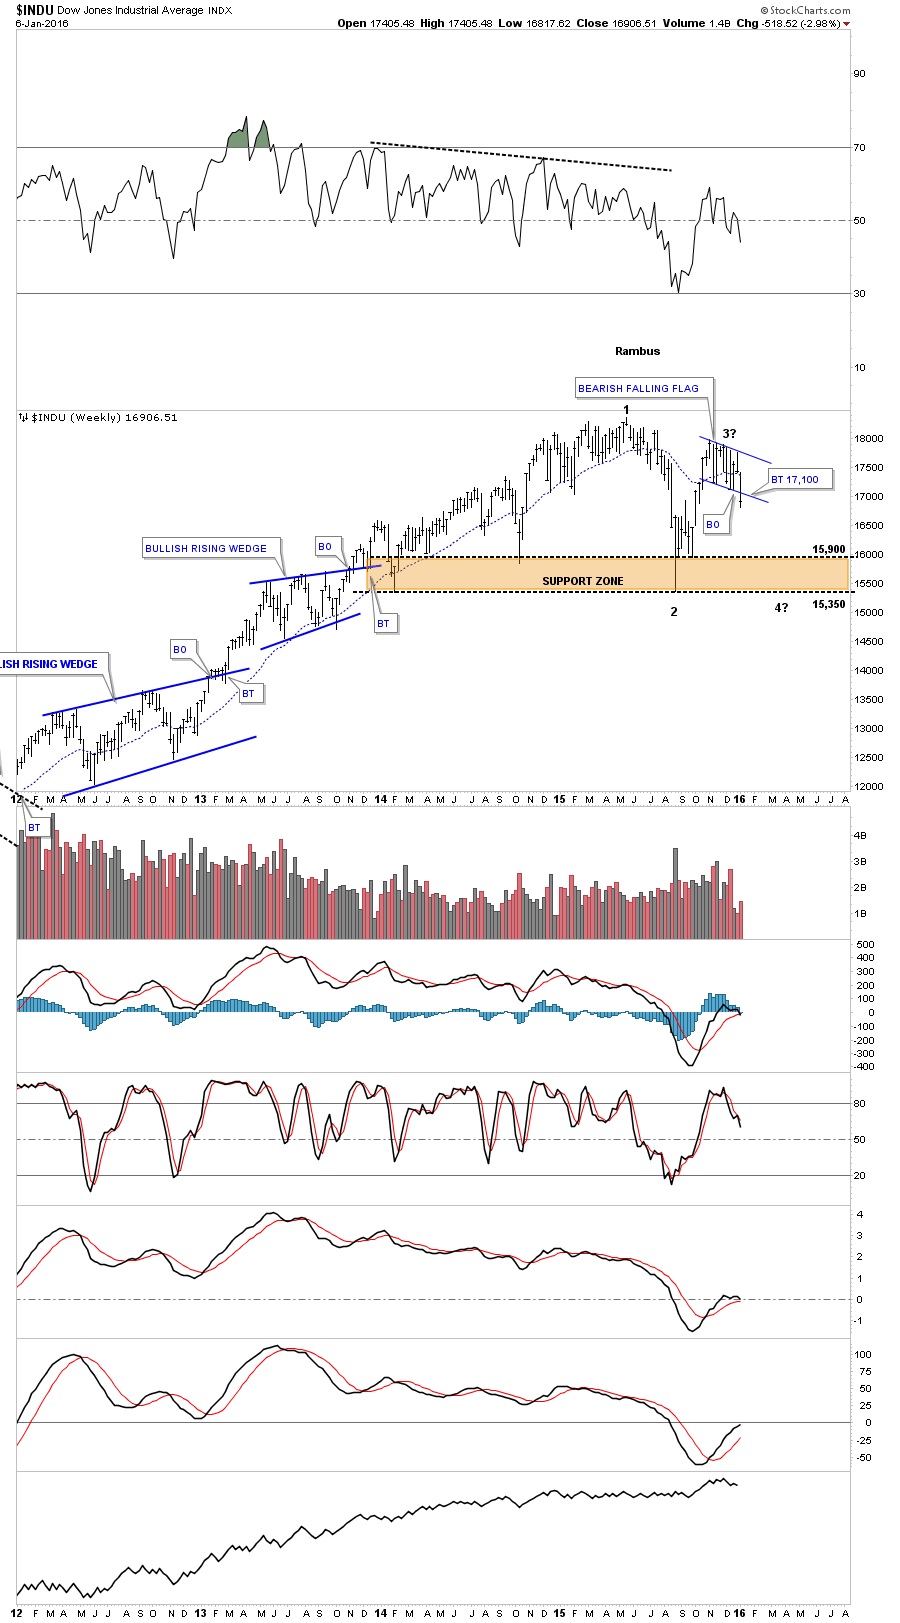
This next chart is a weekly look which now puts the bearish falling flag in perspective. Up until today that flag could have been a bull flag with upside potential. The breakout to the downside is clearly seen now. I also added a brown shaded support and resistance zone which is made from several important lows. I can’t rule out the possibility that the INDU could be building out a big consolidation pattern as one of several scenarios.
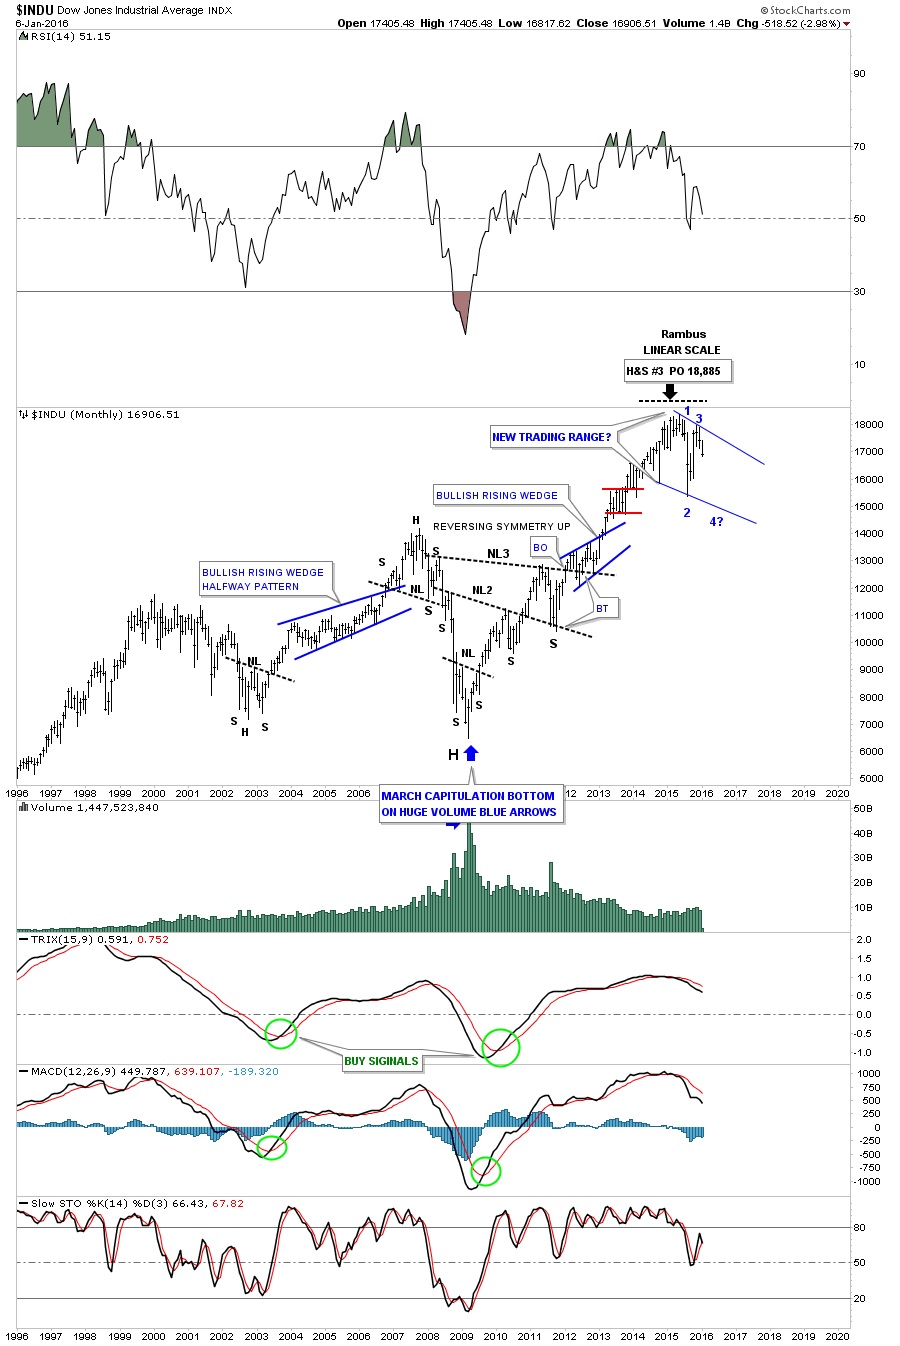
The monthly chart below shows what a possible big trading range might look like with the 3rd reversal point in progress to the downside right now.
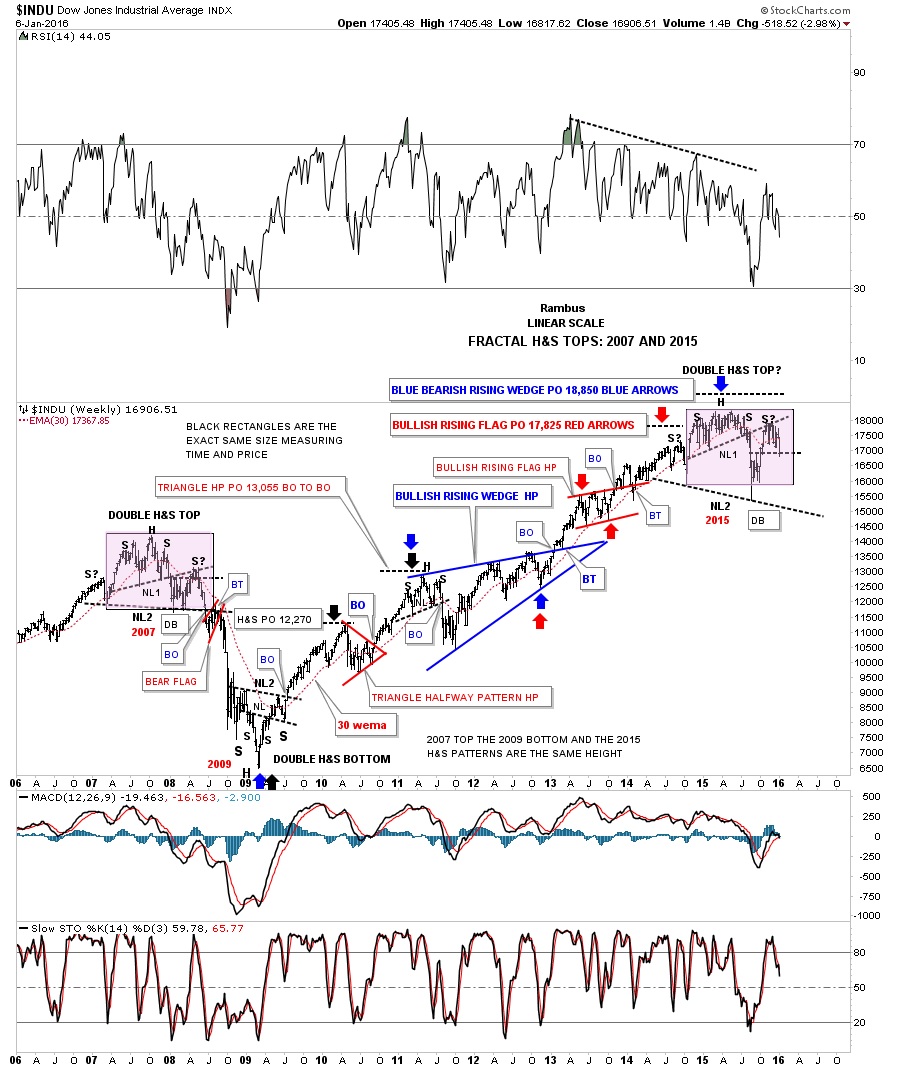
This last chart for the INDU is a weekly fractal chart we’ve looked at a couple of times in the past which compares our current topping pattern to the 2007 topping pattern as shown by the purple rectangles. The last time week looked at this chart the INDU was just starting to trade back up to NL#1 which shows the backtest with the S? on it. With the potential bull flag forming below neckline #1, on the daily chart we looked at earlier, I wasn’t quite convinced that the fractal would keep playing out like it has. If you look at the 2007 fractal top you can see it had a backtest to the underside of neckline #1 after breaking out from a failed double bottom. We have the same situation taking place right now with the INDU’s double bottom failing. If this fractal keeps playing out today’s price action closed basically right on top of the double bottom trendline which would put us in a similar position to the 2007 double bottom trendline.
Note the price action of the 30 week ema during the formation of the 2007 top. Once the INDU broke below the double bottom trendline the decline began in earnest taking out neckline #2. The INDU then formed the red bearish rising flag as the backtest to neckline #2 which took roughly eight weeks to complete before the real fireworks took place to the downside. The INDU never again traded back above the 30 week ema until the inverse H&S bottom formed in 2009. Our current topping pattern for 2015 shows the 30 week ema held resistance this week in a similar fashion to the 2007 top. So here the INDU sits resting right on its double bottom trendline just below its 30 week ema. An interesting juncture for sure.
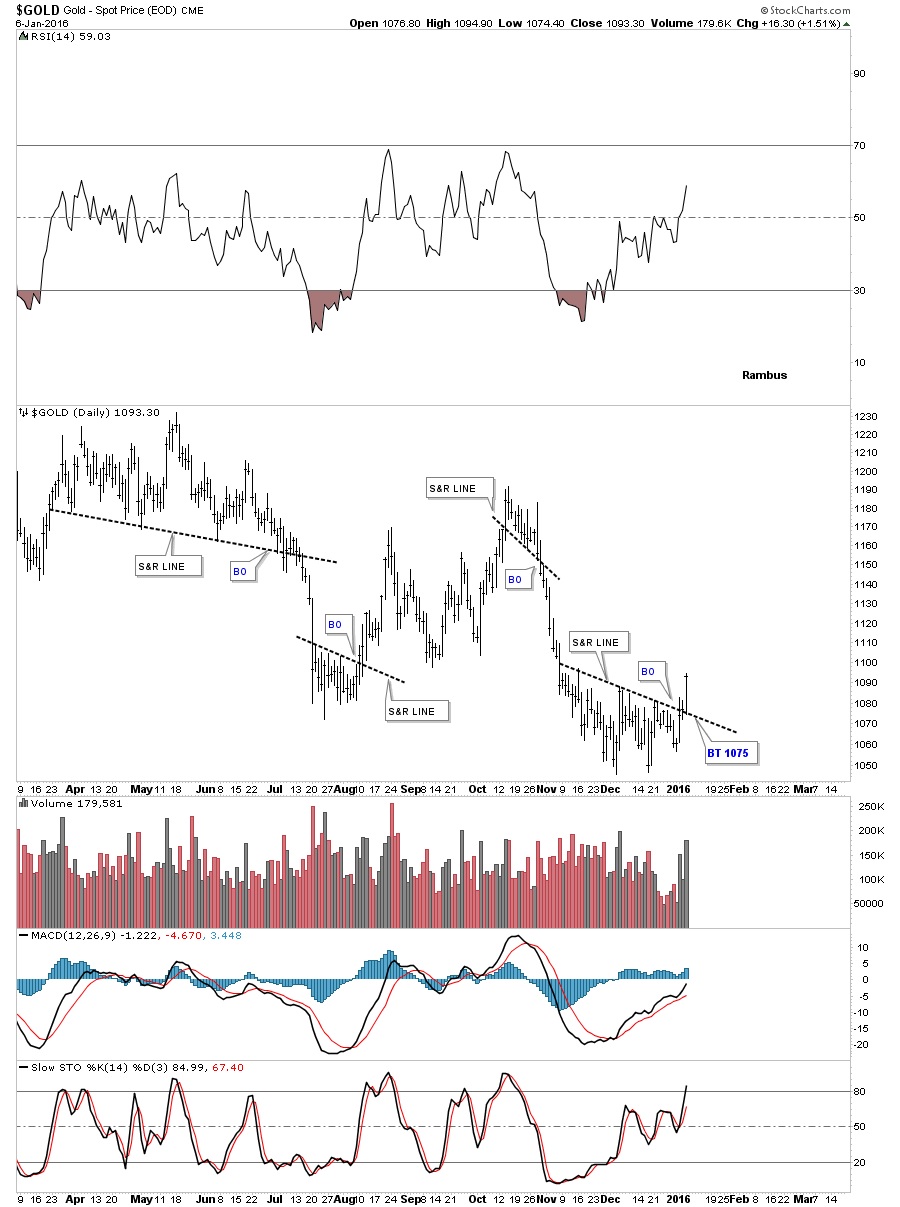
Next let’s look at a daily chart for gold which finally showed its hand today. This is just a simple bar chart which shows four support and resistance lines gold made over the last year or so. When you look at the S&R lines just think of the price action as bullish above and bearish below. After flirting with the recent S&R line over the last several days gold finally showed us it was ready to rumble on increasing volume. If we get a backtest to the S&R line it would come in around the 1075 area.
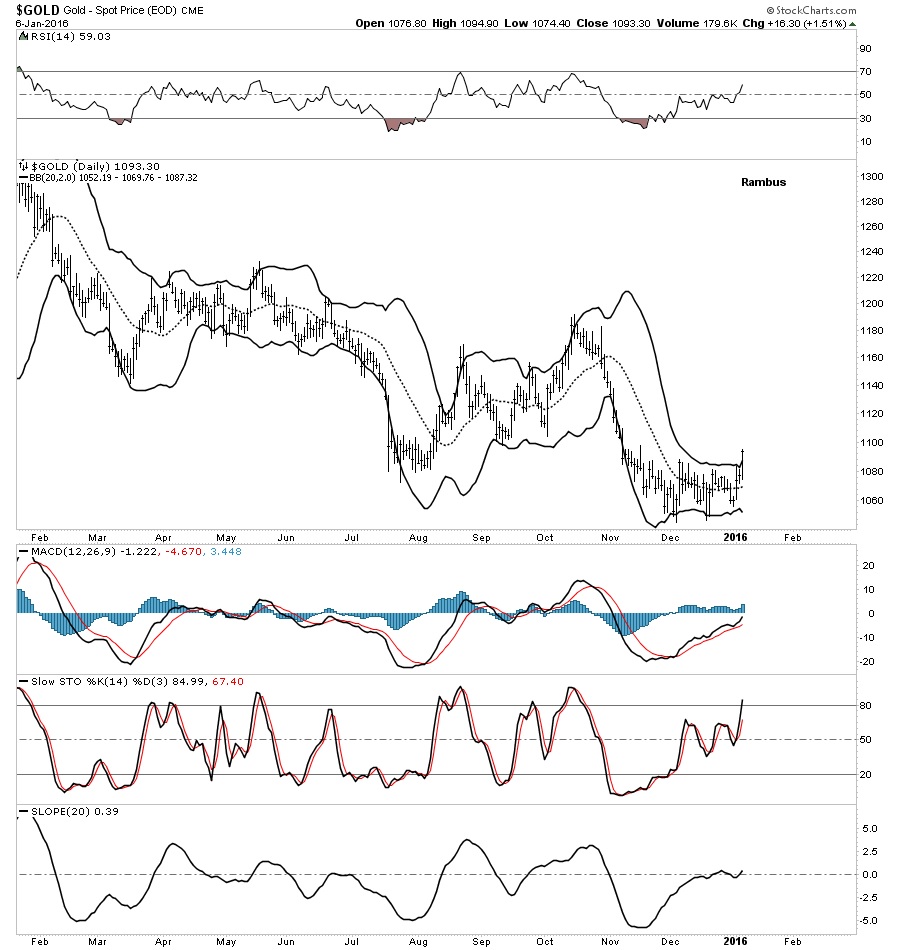
After squeezing pretty close gold closed above the upper BB today which may help in giving us a backtest to the S&R line at 1075.
********
Courtesy of http://rambus1.com/
 Meet Rambus, a seasoned trader and technical analyst renowned for his unbiased and insightful chart work. Through his website, Rambus Chartology, and Substack newsletter, Rambus shares his expertise with a global community of subscribers, providing daily updates, commentaries, and hands-on training in the art and science of chartology. With his calm, humble, and down-to-earth approach, Rambus demystifies complex market trends, helping his followers navigate the challenges of today's volatile markets. Join the Rambus Chartology community today and discover a unique blend of technical analysis, trading expertise, and time-tested protocols. Subscribe now at www.rambus1.com or https://rambuschartology.substack.com/


