Bull and Bear Market Psychology


The Dow Jones saw some downward pressure this week. Nothing serious as it closed the week with a BEV of -2.33%, still deep in scoring position. In my BEV charts, I always include a table giving the point values for the important BEV lines. If you look at the one in the chart below, as long as the Dow Jones remains above 38,003.41 in points, it remains in scoring position.
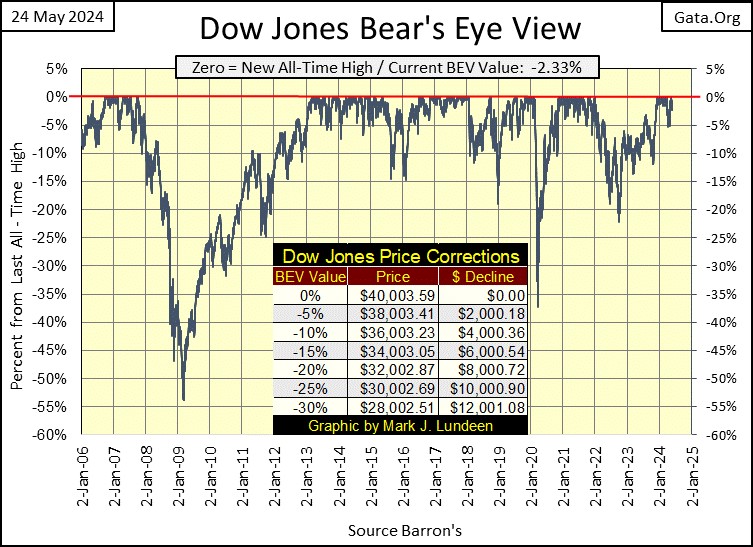
That is the key issue for the Dow Jones at the close of this week, for it not to close below 38,000. Until it does, I’m remaining bullish on the stock market. I may even remain bullish until the Dow Jones deflates very close to its BEV -10% line (36,000), and then maybe not.
Of course, for me to be bullish on this market, it’s with the understanding that I also have no exposure to it. Except for precious metal assets, I’ve been out of the financial markets for years.
I don’t intend to come back until the Dow Jones has a dividend yield of something more than 6%. At this week’s close, the Dow Jones paid out $836 in dividends, and yielded 2.14%. For it to yield 6% with its payout of $836, the Dow Jones would have to deflate to 13,934, a collapse in valuation of 65% from its last all-time high of 40,003.59. Yep, I’m a big bear.
Moving on to my table of BEV values for the major market indexes I follow below, the market saw some new all-time highs this week. Even following Thursday’s deep declines, the week still closed with the top three indexes at BEV Zeros. That plus the next eleven in the table below closed well within scoring position, less than 5% from their last all-time highs.
Based upon what I see below, this is a stock market that still wants to go up, something it has been doing since last December. Until that changes, until a time comes with no more BEV Zeros, and all of these indexes below close well below their BEV -5% & -10% lines, I’ll remain bullish on the stock market.
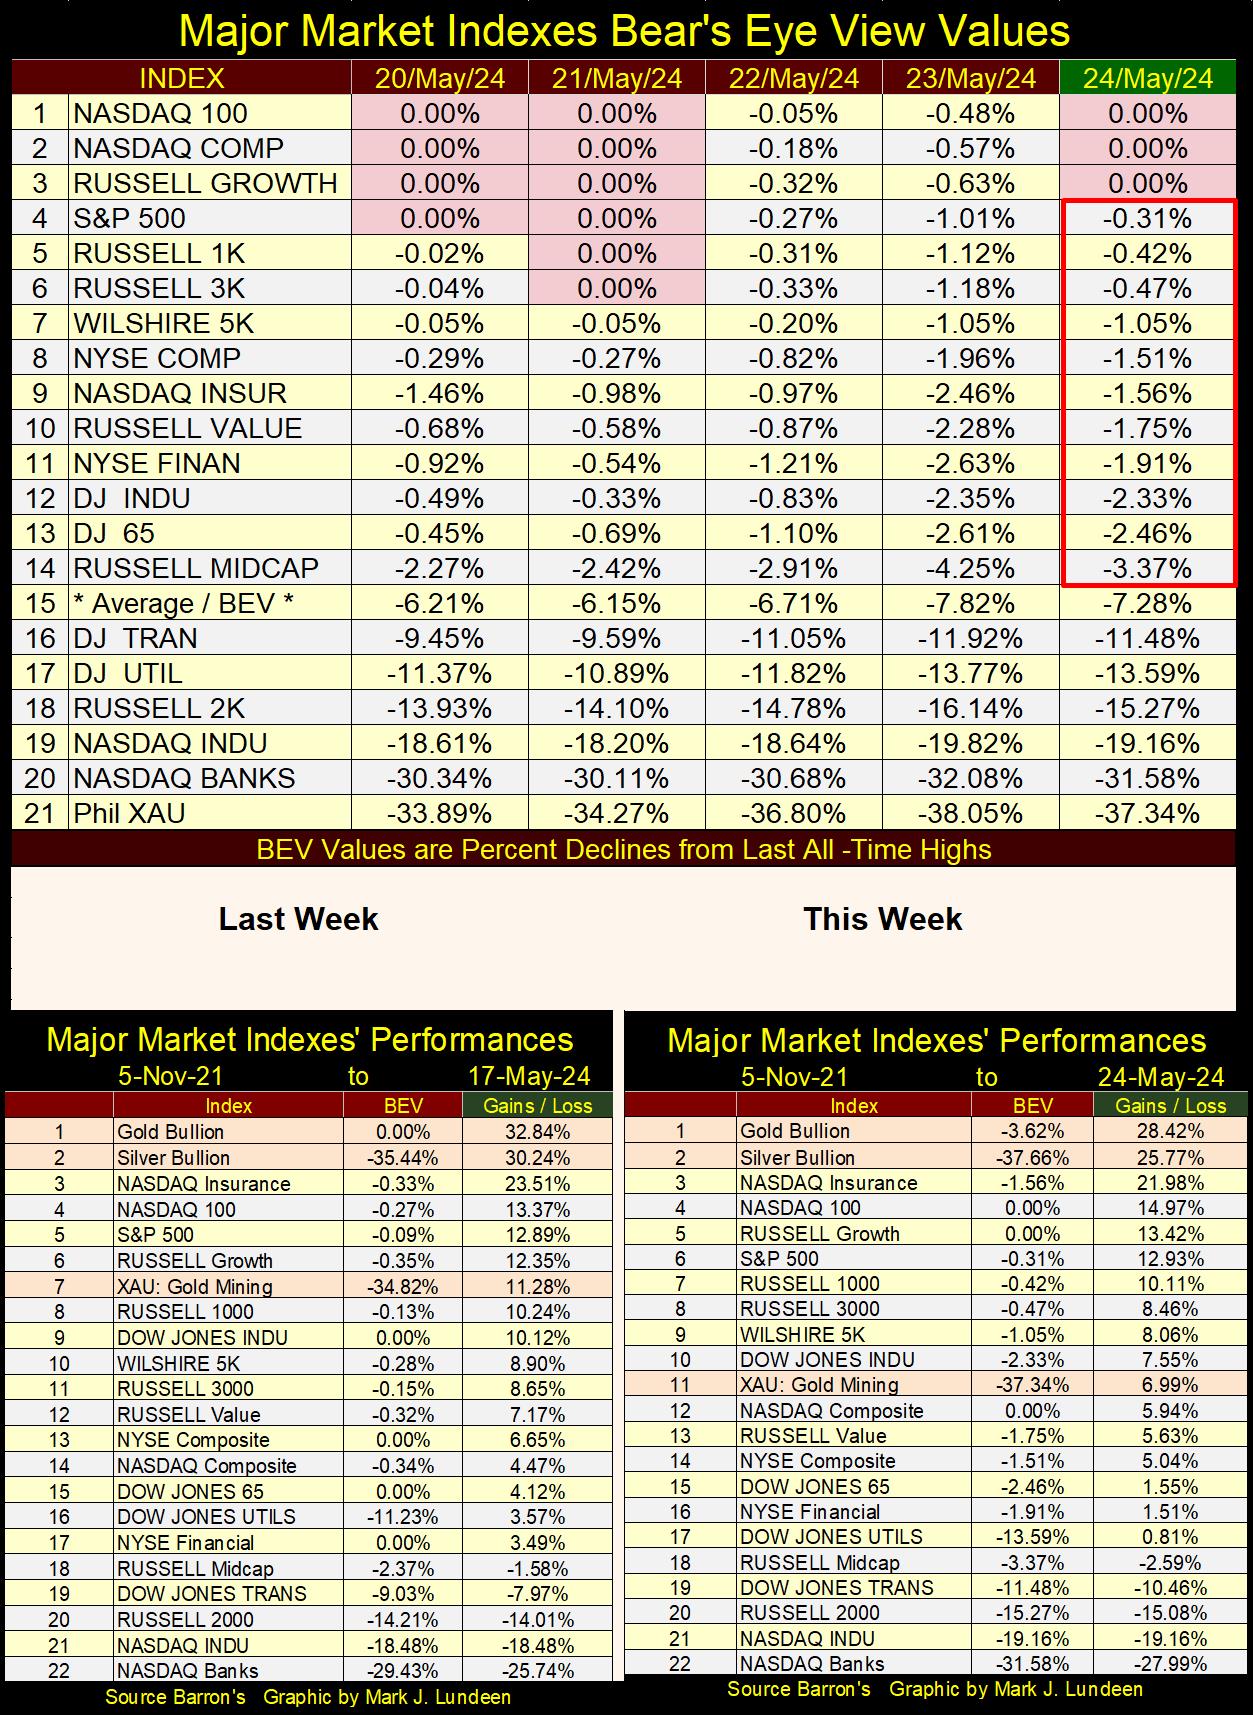
In the performance tables above, most of the items have lost ground from last week’s close, including gold and silver, and the XAU. But gold and silver retained their positions at #1 & #2, though the XAU slipped down to #11. Since the end of 2023, the old monetary metals have outperformed the rest of the market, something I’m anticipating will continue as 2024 moves into summer.
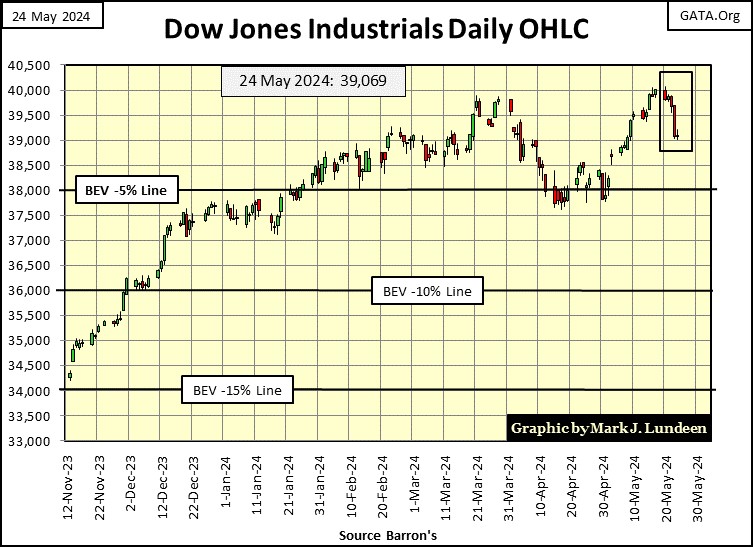
Next is my chart of the Dow Jones in daily bars. I like BEV charts. Still, charts plotting the Dow Jones in dollars do provide insights the Bear’s Eye View can’t, such as what a bad day last Thursday was for the Dow Jones, and the stock market in general.
A concern I have after looking at this chart is, last Friday the Dow Jones closed for one day, and one day only above 40,000, with a close of 40,003.59. Just $3.59 above 40,000. That isn’t much of a toehold above 40K. Then this week, the Dow Jones began upchucking dollars starting on Monday, with absolutely no follow through above 40,000.
My concern with the Dow Jones is; 40,000 is a big number. Are the bulls beginning to develop a fear of heights? We’ll know more next week. But as I see it, unless the Dow Jones can generate a few more daily closes above 40,000 in the weeks to come, the market may begin to see some difficulties this summer.
Come on Mark, get a grip on yourself! The Dow Jones closed the week well above its BEV -5% line in the chart below. Don’t start psyching yourself out!
Thanks Mark, I needed that.
We haven’t looked at mortgages for a few months, so let’s do it. This week, the St. Louis Fed reported its mortgage-base rate closed the week at 6.94%, down nicely from the 7.22% of a few weeks ago, but still far above the 2.65% it was in January 2021.
So, what’s the big deal with rising mortgage rates? Well, mortgage rates are key in pricing real-estate valuations.
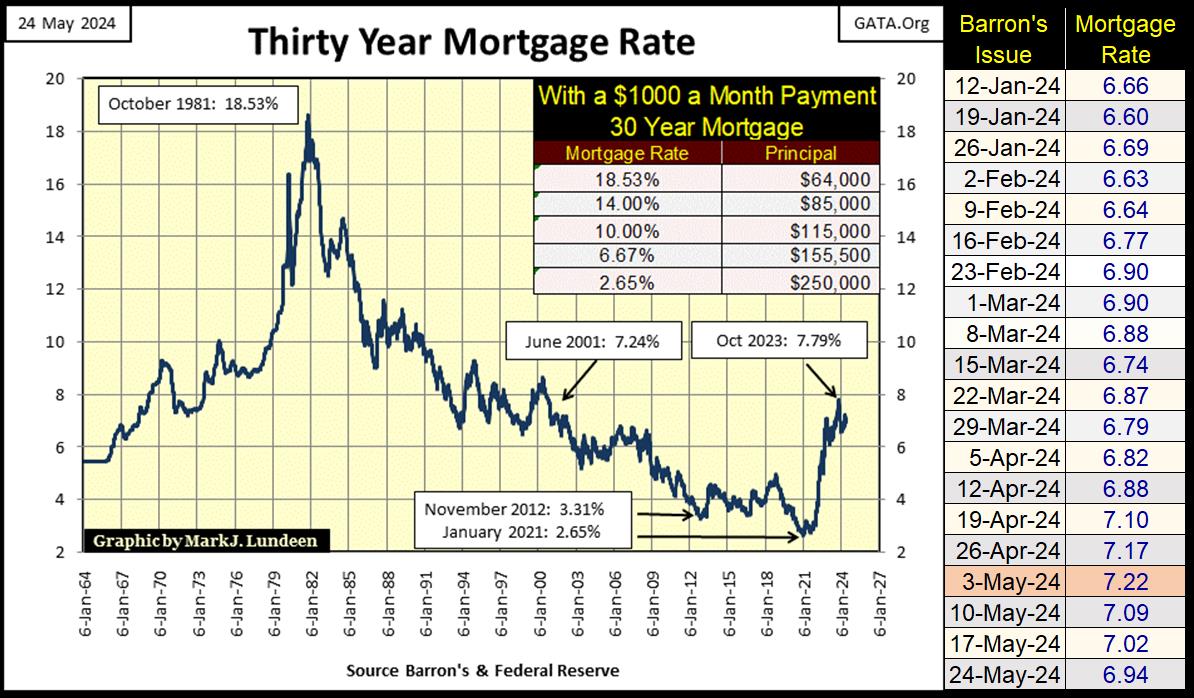
A young couple come into a bank, hoping to buy a home priced at $248,200 (right side table below). It’s January 2021 when mortgage rates were at 2.65%. After doing their calculations (due diligence by the bank), the banker concludes the young couple can indeed make the mortgages’ $1000 a month payment for the next 360 months, as all 30yr mortgages demand. The deal is made, and the couple become owners of a $248,200 home.
Keep in mind; bankers don’t give a damn how much a house cost. Such considerations are for real-estate agents and homeowners. What the banker is concerned with, and only with; can the perspective homeowners make the 360 monthly payments, as all 30yr mortgages demand.
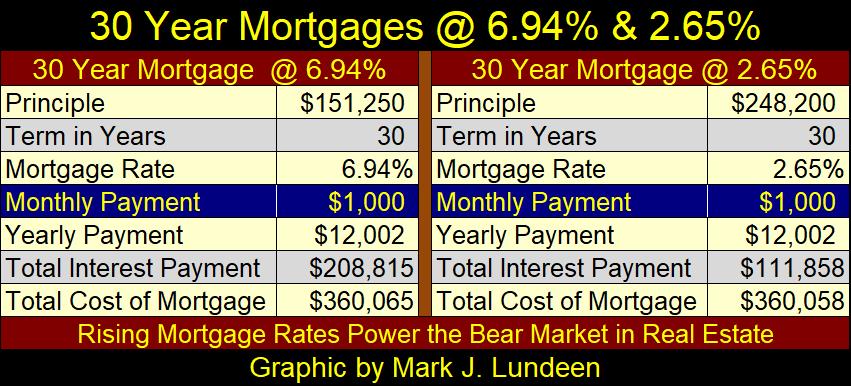
A few years later, say in May 2024, the couple who bought a home in January 2021 for $248,200 in the table above (right side) now want to sell. That shouldn’t be a problem, as another young couple now comes to the same banker who wrote them their mortgage, who are also able to make a $1000 a month mortgage payment for the next 360 months required for a 30yr mortgage.
But, and this is a * BIG BUT *, mortgage rates in May 2024 have increased to 6.94%. So in May 2024, a $1000 a month payment now qualifies for only a $151,250 mortgage (left table above).
For that young couple who now want to sell their home for $248,200, they’ll now need someone willing to pay $1641 a month (left side table below) to get free and clear from their home and mortgage. That is possible, but not likely in a bear market in single-family homes. So, they are stuck with an upside-down home; a home whose mortgage is larger than the price they could sell their home for.
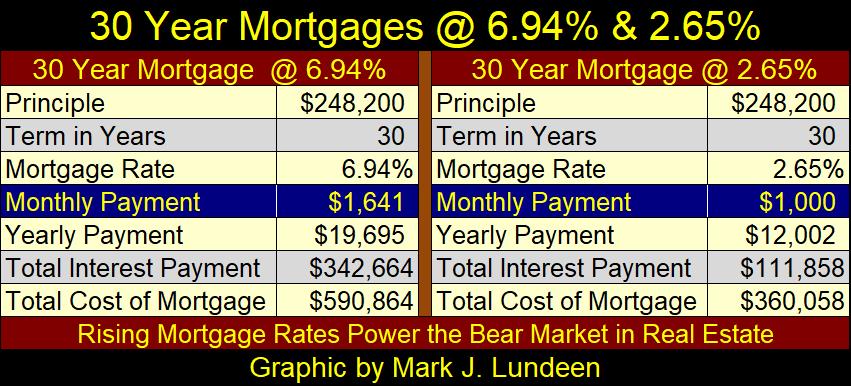
By having mortgage rates increase from 2.65%, to 6.94%, the pool of available funds supporting real estate valuations has contracted by 39% in the past three years. As mortgage rates continue to rise, this pool of funds supporting real-estate valuation (courtesy of a bunch of idiots from the FOMC) will only get smaller, taking real-estate valuations down with them – ouch! Bear market mathematics can become very grizzly.
So, should someone still purchase a home? Depends on why someone wants to purchase a home. If they were doing so thinking they were going to flip it in a couple of years, doubling their investment. That just isn’t going to work anymore, not if mortgage rates continue to rise – which I expect they will. But in an era of rent inflation, if someone wants to buy a house as a means of fixing their monthly housing costs, buying a home seems to make a lot of sense.
So Mark, how did you learn so much about the markets? Well, most of what I did learn was from the school of hard knocks, that plus I used to subscribe to market letter writers whose knowledge of the market was amazing. One was James Dines, who said when an investor is right about the market, they’ll get what they wanted; profits. But when` an investor is wrong about the market, they’ll get what they actually need; experience. Sad, but true. But between you and me, I prefer the profits.
I’d like to think I’m an experienced investor, someone who’s been around the block a few times. Over the decades, I’ve taken more from the market, than the market has taken from me. To help me take the measure of the market, I found it helpful putting my thoughts on the market down on paper, and that is what I share with my readers every week; for good or bad, my thoughts on the market.
This week I should go over some brilliant market insight by Richard Russell, whose insights on the market psychology of bull and bear markets should be the bedrock of any investors’ understanding of the financial markets. Years ago, before I read Mr. Russell’s insights on the market, I never thought about market psychology.
But doing so makes sense, as markets are human creations. Like dumb beasts, humanity is driven by its emotions, not logic as most people would like to believe. Note; looking at the market from a psychological perspective has nothing to do with how far the market may rise or fall, only how investors’ perception of the market evolves, as a bull or bear market progress from start to finish.
Both bull and bear markets go through three psychological phases; let’s begin with bear markets. Bear markets begin at the absolute top of a bull market, and at all bull markets tops, things absolutely can’t get any better. So, they begin to get worse as Mr Bear enters the market.
But it’s much more than just my metaphoric Mr Bear coming to pay Wall Street a visit. What actually defines a bull market top is the credit (debt) extended to marginal companies during the bull market’s rise, begin struggling to service their debts.
So, why did banks make loans to “marginal companies” during the bull market? Because during the bull market, these companies didn’t look like marginal companies to the banks and bond purchasers who made these loans to them.
Unfortunately for both these marginal companies and their creditors, the market will absorb only so many of the widgets they manufacture. Once the widget market becomes saturated, sales slump, and the widget factories built by these now marginal companies, funded by the banks who financed them, begin laying off personnel to cut costs.
At bull market tops, previously expanded lines-of-production become liabilities, instead of sources of revenue needed to service debts. Decades ago, such companies were forced into receivership (bankruptcy), where its assets were quickly liquidated, at greatly reduced prices, to recover as much of the banks, and bond-holders money from the company as was possible.
It was very ruthless. But back then, if a company couldn’t pay its bills, it was put out of its misery by being liquidated - ASAP.
But today, the idiots at the FOMC prefer keeping Wall Street’s living dead animated, in a vain attempt to keep “market valuations stabilized.” As the FOMC has the ability to expand credit to infinity, they have their banking system extend additional credit to these “zombie corporations” for the purposes of servicing past, but now problematic debts.
In May 2024, the economy is dealing with many trillions of dollars of pending defaults, for the banking system and corporate-bond market.
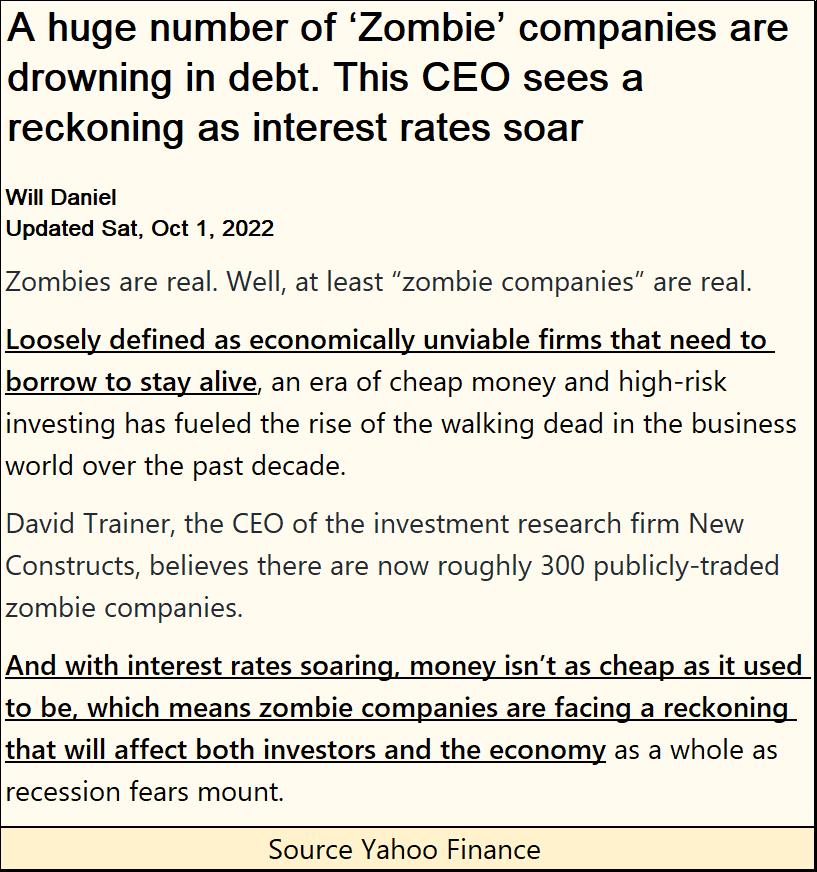
https://finance.yahoo.com/news/huge-number-zombie-companies-drowning-120000776.html
The above article was from October 2022. But as with the single-family home market discussed above, this situation for corporate America will only become worse as time passes, and bond yields and interest rates rise.
As the bear market progresses, and the economy contracts, an increasing number of formerly solid credits, become additional shaky credits; companies that find paying their debts to the banking system and their bond holders increasingly impossible, as expected market demand for what they are selling declines.
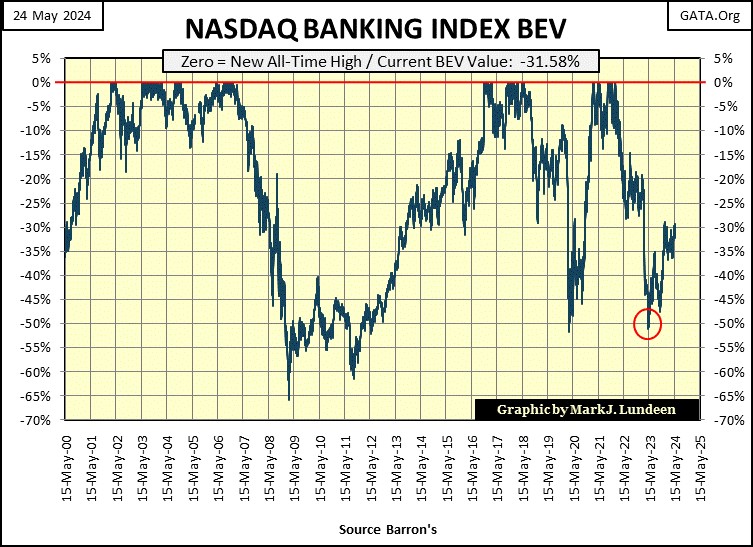
This is why I keep an eye on the NASDAQ Banking Index as a market bellwether (chart below). Typically, banks are an early victim in a bear market. So, what does the NASDAQ Banking Index look like now? Could be better. Its last all-time high was in November 2021, then broke below its BEV -50% line last May (Red Circle) as Silicon Valley had some banks go under.
Since then, the NASDAQ Banking Index recovered to its BEV -30% line last December, and has oscillated between its BEV -30% & BEV -35% lines since then, or five months of indecision by this banking index. I’m just looking at its BEV chart, and the banks look weak as most of the other major market indexes’ BEV values (table above) are much higher. How can that be good?
In the first phase of a bear market, most investors still believe it’s a bull market. After all, didn’t the previous bull market have regular market corrections? So, seeing the market decline by 20%, or more, is expected by the bulls, who stubbornly refuse to exit the market. Being a bull, expecting the market will turn around, and go on to new all-time highs is becoming a bad habit that will cost these bulls dearly as the bear market progresses.
In the second phase of a bear market, one by one, the bulls are recognizing something is amiss with their bull market, doubts the market will ever become profitable again are entering the minds of the bulls, as one by one, they exit the market.
In the third, and final phase of a bear market, market sentiment becomes bleak as the bear market approaches its bottom; that inevitable point in all bear markets where things absolutely can’t get any worse. This is also the point where bull markets are born.
But market psychology at the bottom of a bear market is such, that any belief of buying at the bottom is ridiculed by the now much battered bulls of the previous bear market, which typically includes “market experts” of the mainstream financial media.
So, if you buy at the bottom of a bear market, don’t expect anyone to hold your hand to reassure you that you’re doing the right thing – they won’t.
Now on to the three psychological phases of a bull market.
In the first phase of a bull market, investors willing to buy at these deeply discounted values are a rare breed, as most of the market’s participants from the old bull market are now long gone. Former investors also believe the bear market has not, or will ever end. They will come back, but only after market valuations are much higher.
In the second phase of a bull market, being bullish is once again becoming popular with a brave few. Not that most people would dare to buy stocks, as the psychological scars, and shame of financial loss from the previous bear market runs deep. As in all bull markets, corrections occur, and on each of them in this second phase, fear of the resumption of the bear market rapidly arise in the minds of the bulls. But it’s now a bull market, so that doesn’t happen.
In the third, and final phase of a bull market, being a bull once again become a wide spread social phenomenon, as concerns of taking a loss in the rising market are no longer considerations by most bulls. Examples of this would be the summer of 1929, the peak year of the Roaring 1920s bull market. As was early 2000 for the NASDAQ High-Tech Bubble, and 2007 for the sub-prime mortgage bubble.
Joseph P. Kennedy, the father of President Kennedy, was a massive figure on Wall Street during the 1920s, as well as a bootlegger during prohibition. Old Joe Kennedy illegally imported Scotch whisky from Scotland, during the 1920s. I remember reading somewhere, that the Kennedy Family still gets a few dollars for every bottle of Scotch imported into the United States to this day. Is that true? Sure, why not? We are talking about the Kennedys.
Old Joe said he exited the 1920s bull market, when he began receiving investment advice from the kid who shined his shoes on Wall Street. Apparently, old Joe knew when everyone is in the market, it’s time to get out.
Here are some other items concerning `bull and bear markets, something to keep in mind seeing how the Dow Jones in the past week closed above 40,000:
- At bull market tops, the risk of losing money is maximum, the possibility of financial reward is minimum.
- At bear market bottoms, the risk of losing money is minimum, the possibility of financial reward is maximum.
Of course, the trick with the above is knowing when a bull market is at its top, and a bear market is at its bottom. Not an easy task.
But both James Dines and Richard Russell agreed that if someone purchased stocks within 10% of a bear market bottom, or sold within 10% of a bull market top, it was a reason to celebrate. Making money in the market is not now, ever was, or will ever be an easy task, because about the time you think you understand the rules of this game, someone always changes the rules.
This is why I stress the need in today’s markets to get out should the Dow Jones decline below its BEV -10% line, as that will get people out of the market within 10% of the top.
How bad could this pending bear market be? Historically, a good rule of thumb for estimating how bad a bear market could be, is seeing how extreme the bull market was that preceded it. In our case, the bull market began in August 1982, with the Dow Jones closing for the last time under 800, to now over 40,000, as seen in the chart below.
Jeeze Louise, since the bottom of the sub-prime mortgage bear market (Red Oval / March 2009), the Dow Jones has risen straight up, from all the “liquidity” the idiots at the FOMC have “injected” into the financial system with their four Quantitative Easings.
The abscess on display below almost broke open in March 2020 (small red circle), bottoming exactly on the upper trend line, when the idiots began “injecting” over two trillion dollars of “liquidity” (100% pure monetary inflation) into the market in March to May of 2020.
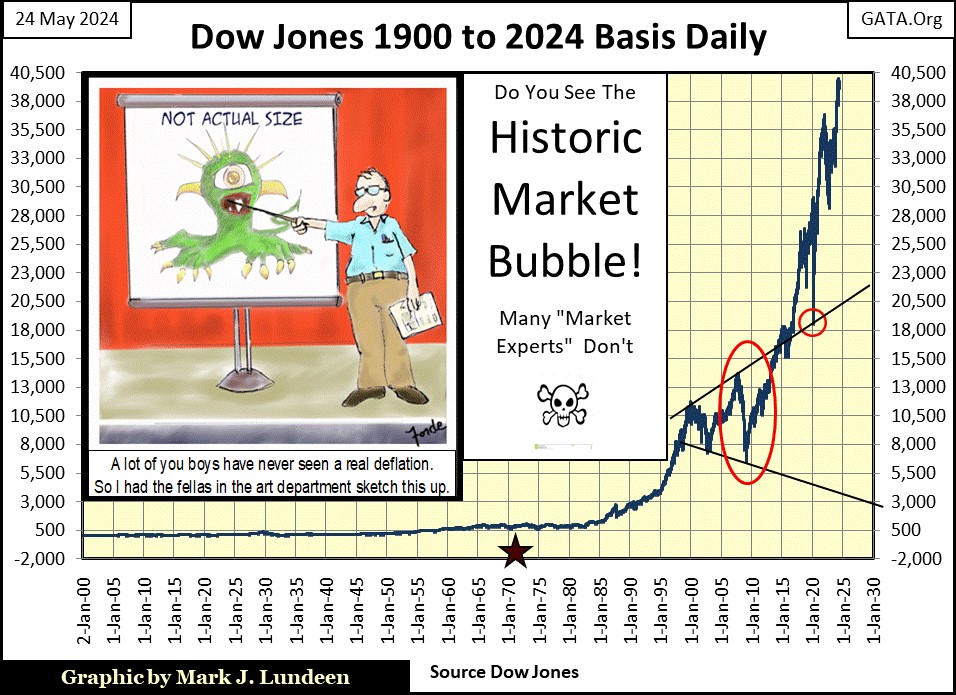
It was also in March 2020, when the FOMC began “monetizing” corporate bonds, to stabilize corporate-bond valuations during a selling frenzy in the corporate bond market.
Corporate zombies have been with us for a long time. Mr Bear attempted to liquidate their bonds four years ago, but a bunch of idiots stopped him from doing that, by doing what no one else would do; by buying these junk bonds at prices no sane money manager would offer, by the tens of billions of dollars.
So, the problems of corporate insolvency just fester on. No one remembers these little details anymore, but I haven’t forgotten.
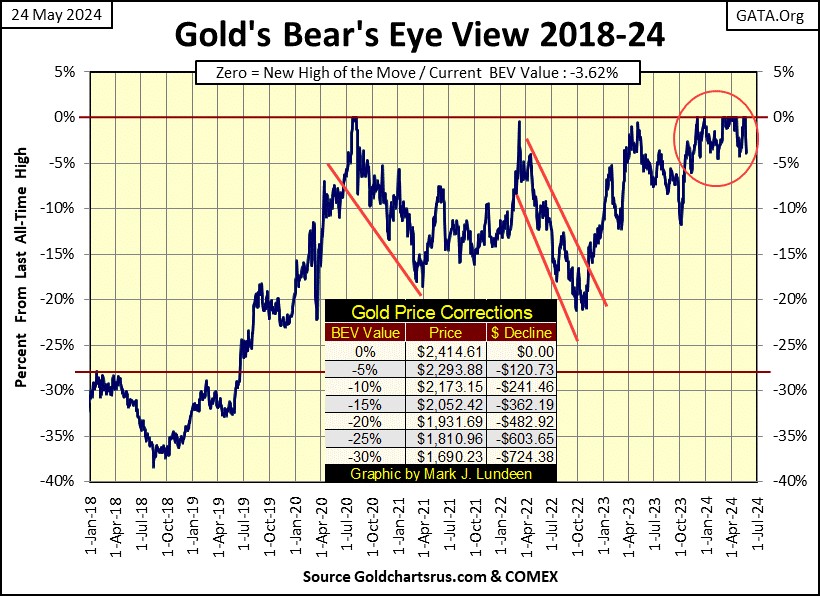
Let’s move on to gold’s BEV chart. This week the goons on the floor of the COMEX made their best effort to drive gold back below its BEV -5% line, and so far, have failed. They’ll be back next week. But I have no fear as I know gold is in a bull market, most likely late in its 1st phase, or early in its 2nd. So, its corrections are sharp, and a bit scary to shake loose any weak hands in the market.
Moving on to gold and silver’s indexed chart, little has changed from last week. Since gold broke above its 47.5 line in the chart below, it has gone straight up with no correction in price. For it to correct a bit, back to its 52 line maybe good for it technically. But I’d prefer if it continued going up, blasting above its 60 line ($2635) before July.
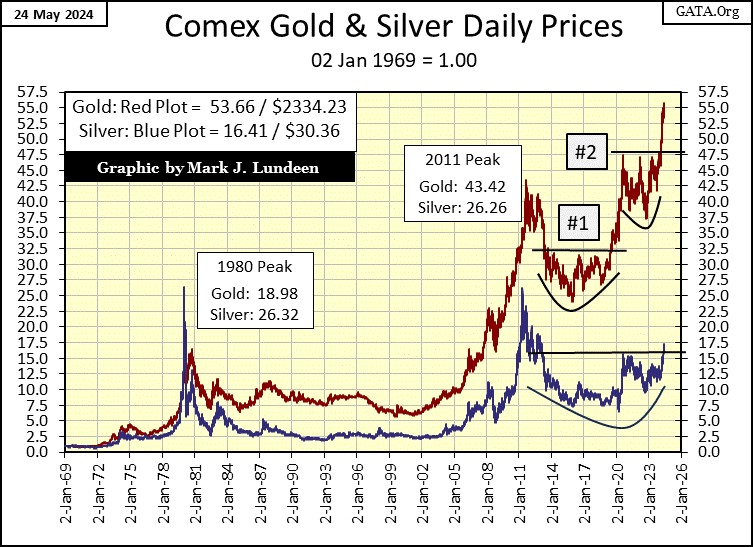
Silver has broken out of its bowl and breakout pattern, but hasn’t yet begun its attempt to take out its last all-time highs from January 1980, something that hopefully it will attempt to do sometime during 2024. That would be a close above 26.32 in the chart above, about $50 an ounce, less than a double from this week’s close. In a strong market, this would not be a hard thing for silver to do.
Gold in its step sum table below saw two new BEV Zeros this week, before selling took it down over 3% from those new all-time highs. No matter, gold remains in scoring position as of the close of the week. I’m expecting gold to continue rising to new all-time highs in the weeks to come.
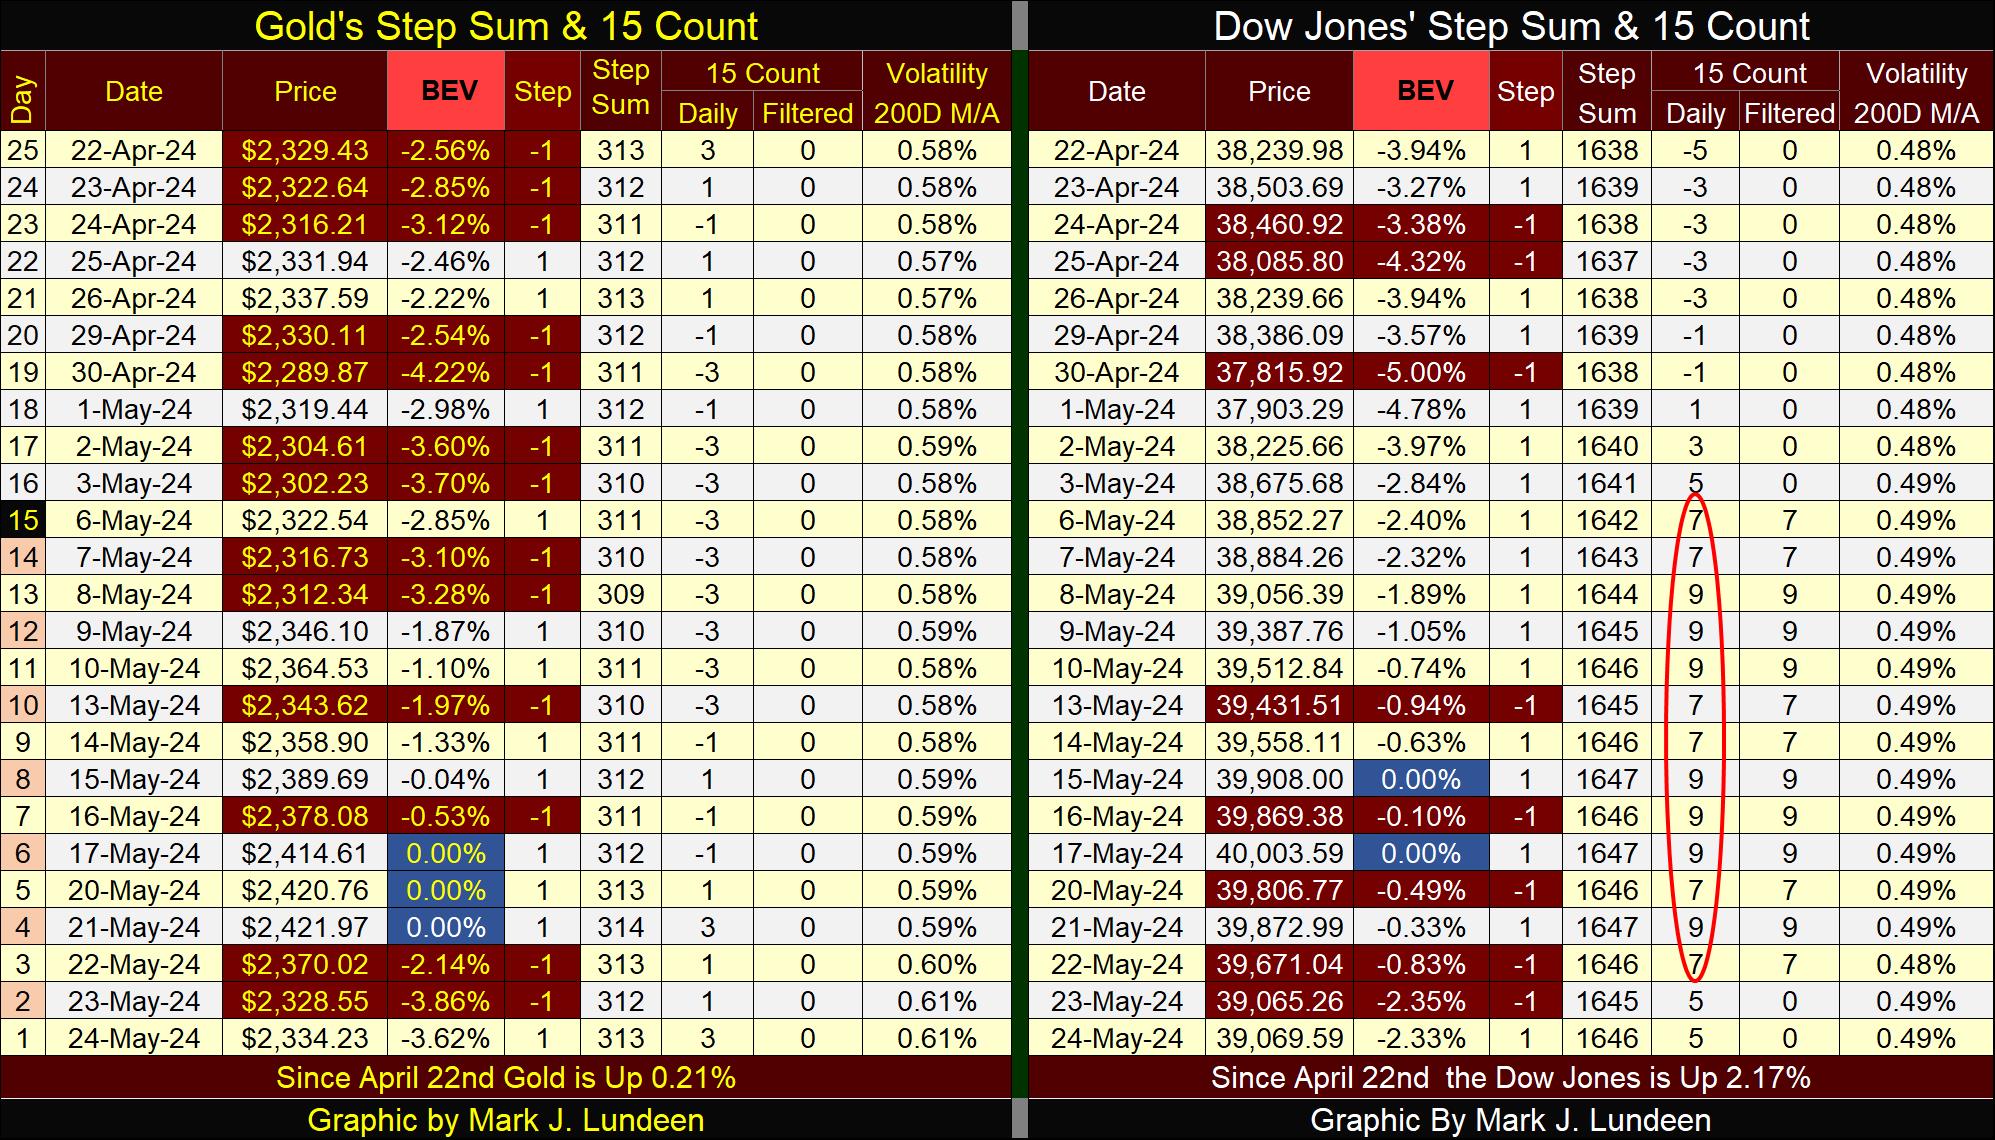
The Dow Jones from May 6th to May 22nd was overbought, with its 15-counts either at a +7 or +9. It’s time for the Dow Jones to see a period where daily declines overwhelm daily advances. Let’s see if it can remain in scoring position when this happens.
Mark J. Lundeen
********


