The Bullish Chartology For Gold Price


Tonight I would like to update you on some of the longer term gold charts we’ve been following which are still hanging in there from the bullish perspective. Keep in mind these are long term charts so changes come slowly.
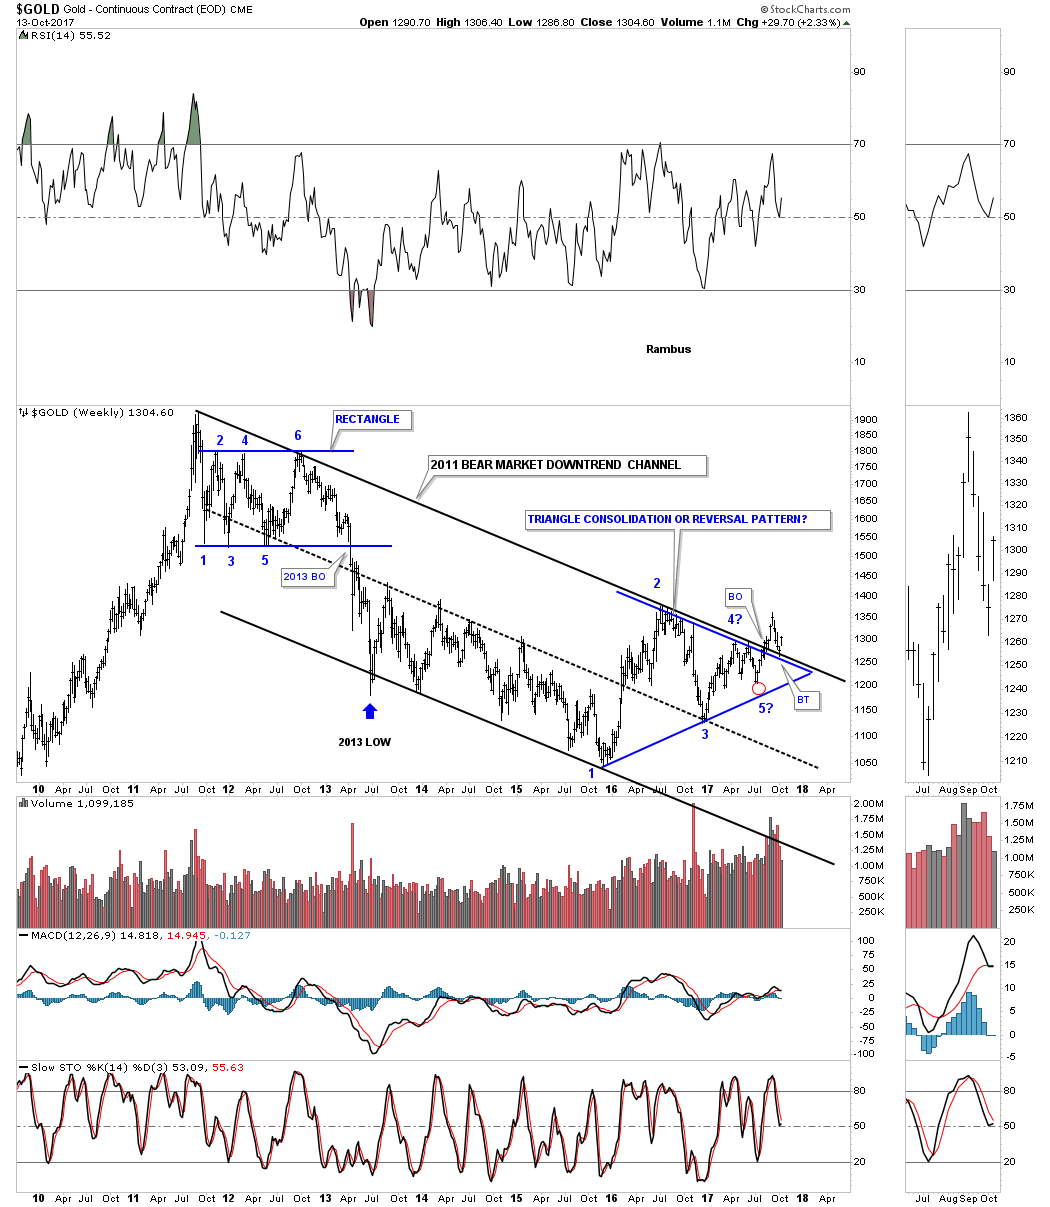
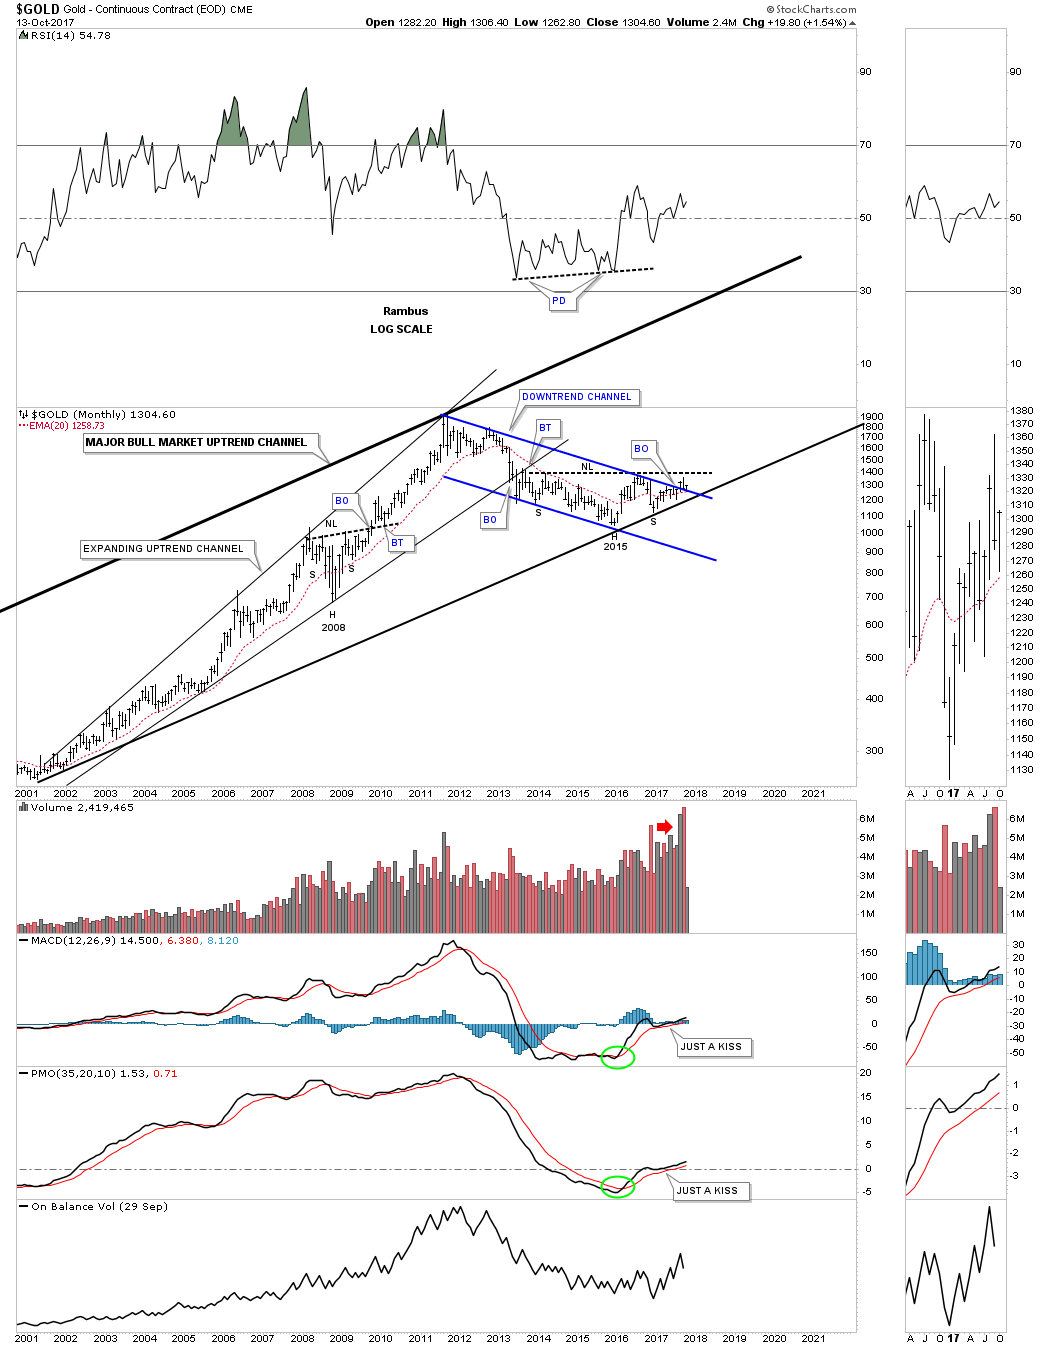
Lets start by looking at the long term weekly chart for gold which shows its 2011 bear market downtrend channel we’ve been following for a long time now. Back in July of this year the price action broke out above the top rail and just recently the top rail was backtested from above and we are getting a bounce exactly where we needed to see a bounce.
Normally at the end of a long protracted bull or bear market you will find some type of reversal pattern buildout. As you can see the 2011 top built out the 6 point rectangle just below the all-time highs. Currently gold has built out the blue triangle with the 5th reversal point falling just shy of reaching the bottom rail. I have seen in the past that sometimes when the 5th reversal point fails to reach the bottom rail it can be a sign of strength, meaning the bulls are not waiting around, red circle. If the bulls are truly in charge the next thing we’ll want to see is a new high above the previous high that was made on the initial breakout.
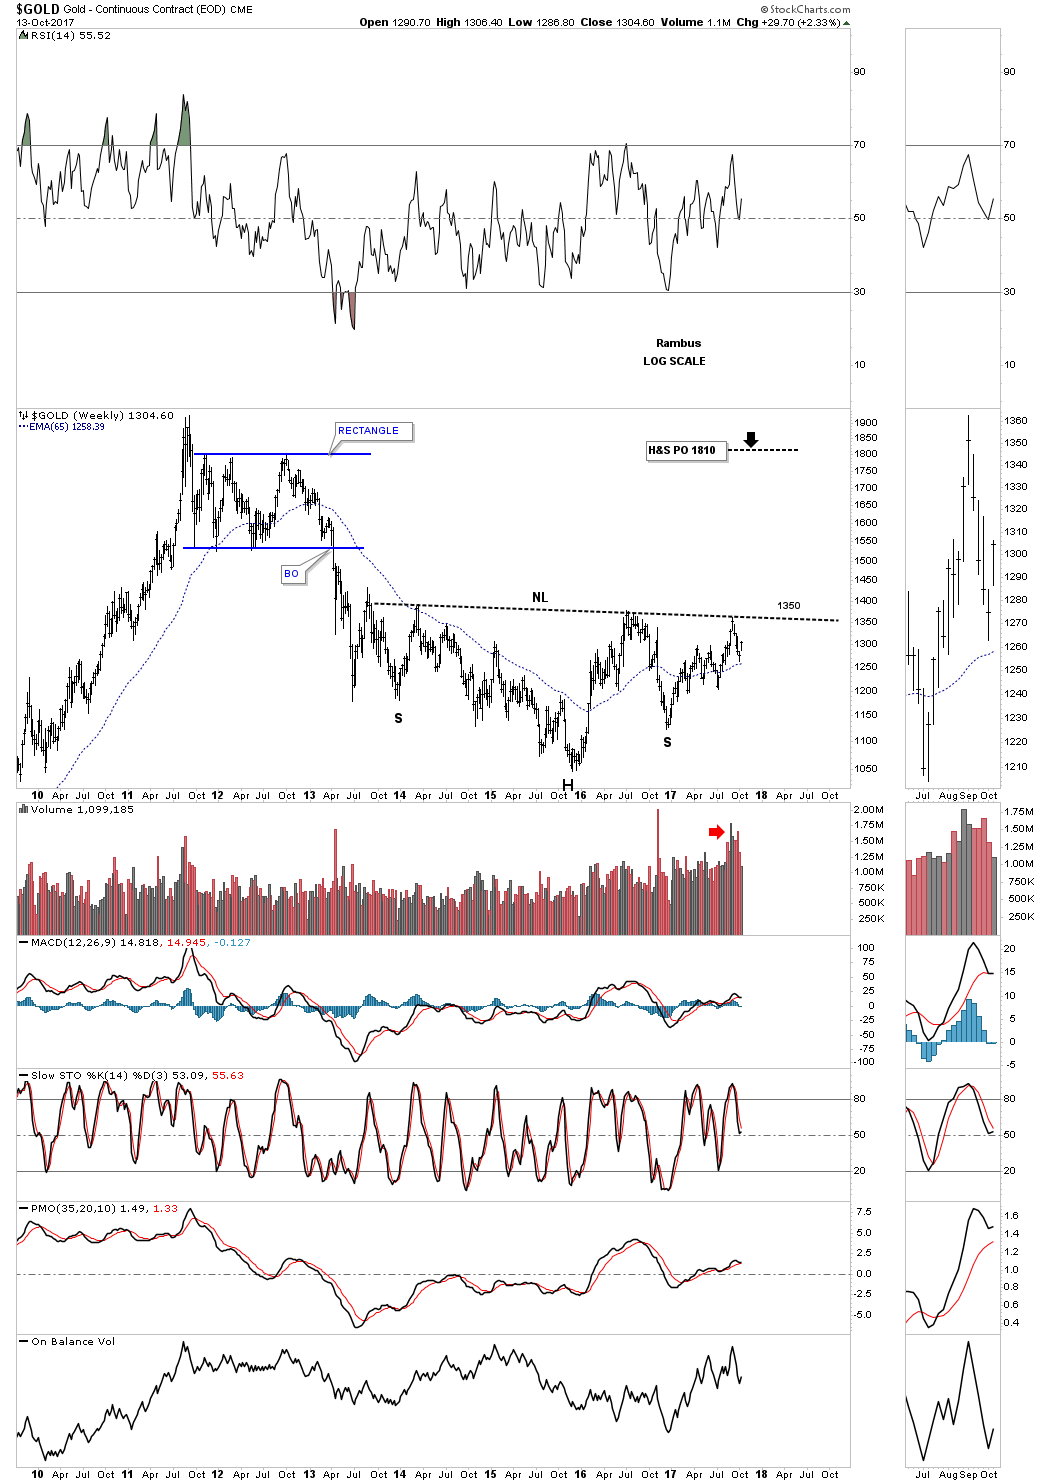
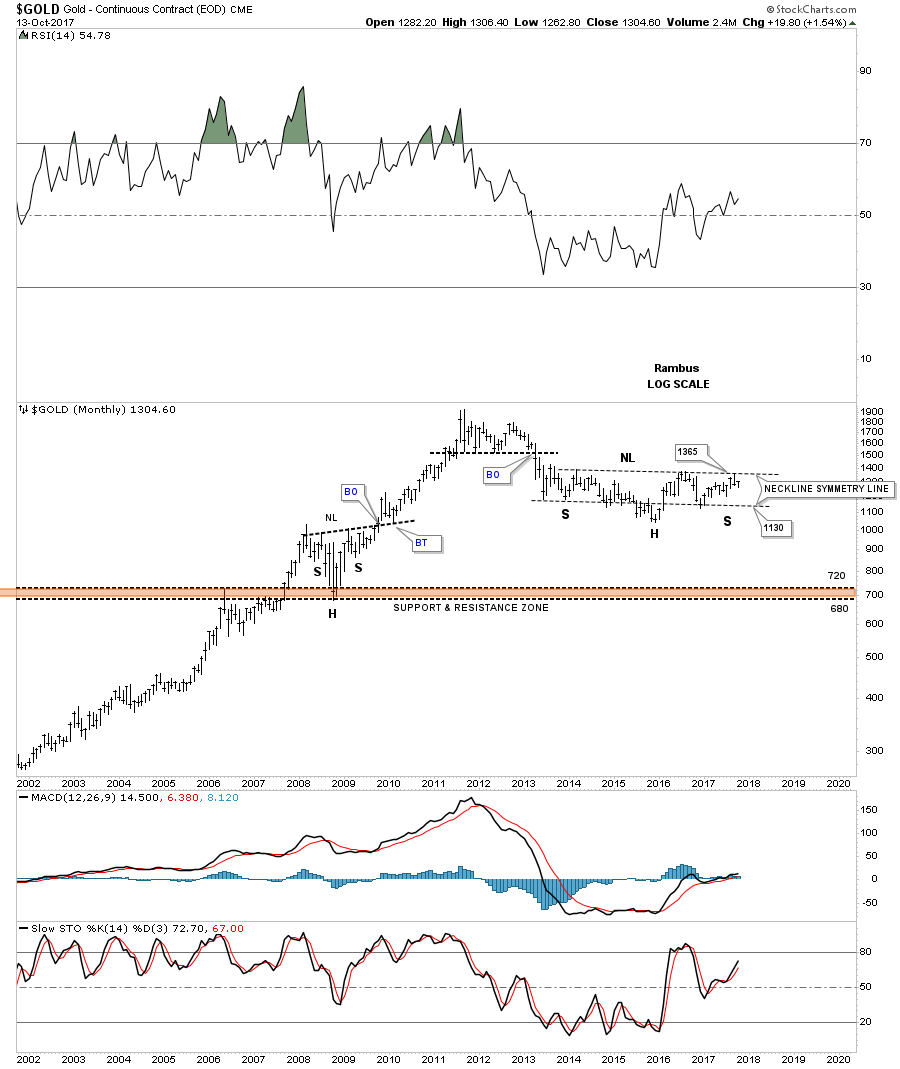
This next chart is probably the most important chart for gold as it shows the possible H&S bottom building out. We’ve discussed in the past that big patterns lead to big moves. This potential H&S bottom is 4 years in the making and is big enough to lead the next leg of gold’s bull market much higher if the neckline is broken to the upside. Currently the neckline comes in around the 1350 area.
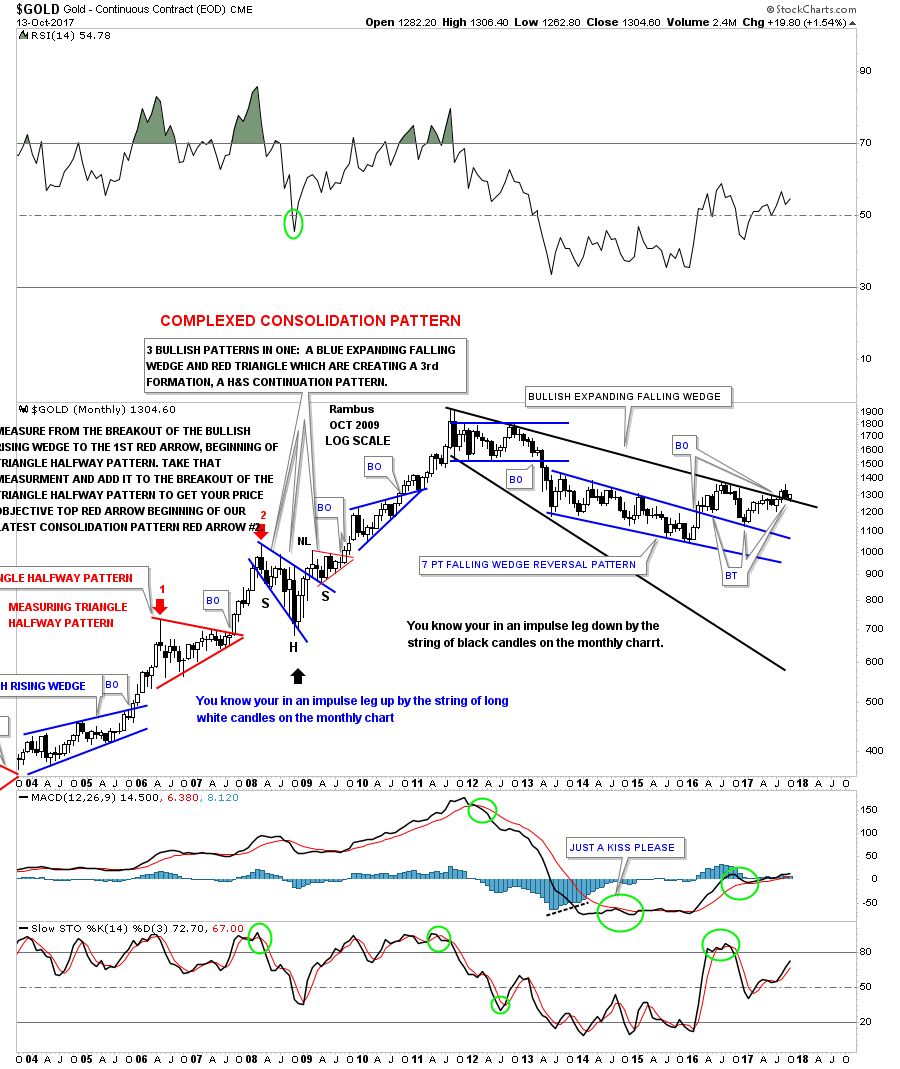
There are several other possibilities we been follow as well for gold. This next chart is a monthly look which shows the ping pong move taking place between the top rail of the blue expanding falling wedge and the bottom rail of the black expanding falling wedge. Again, we are seeing gold bouncing right where we need to see it bounce.
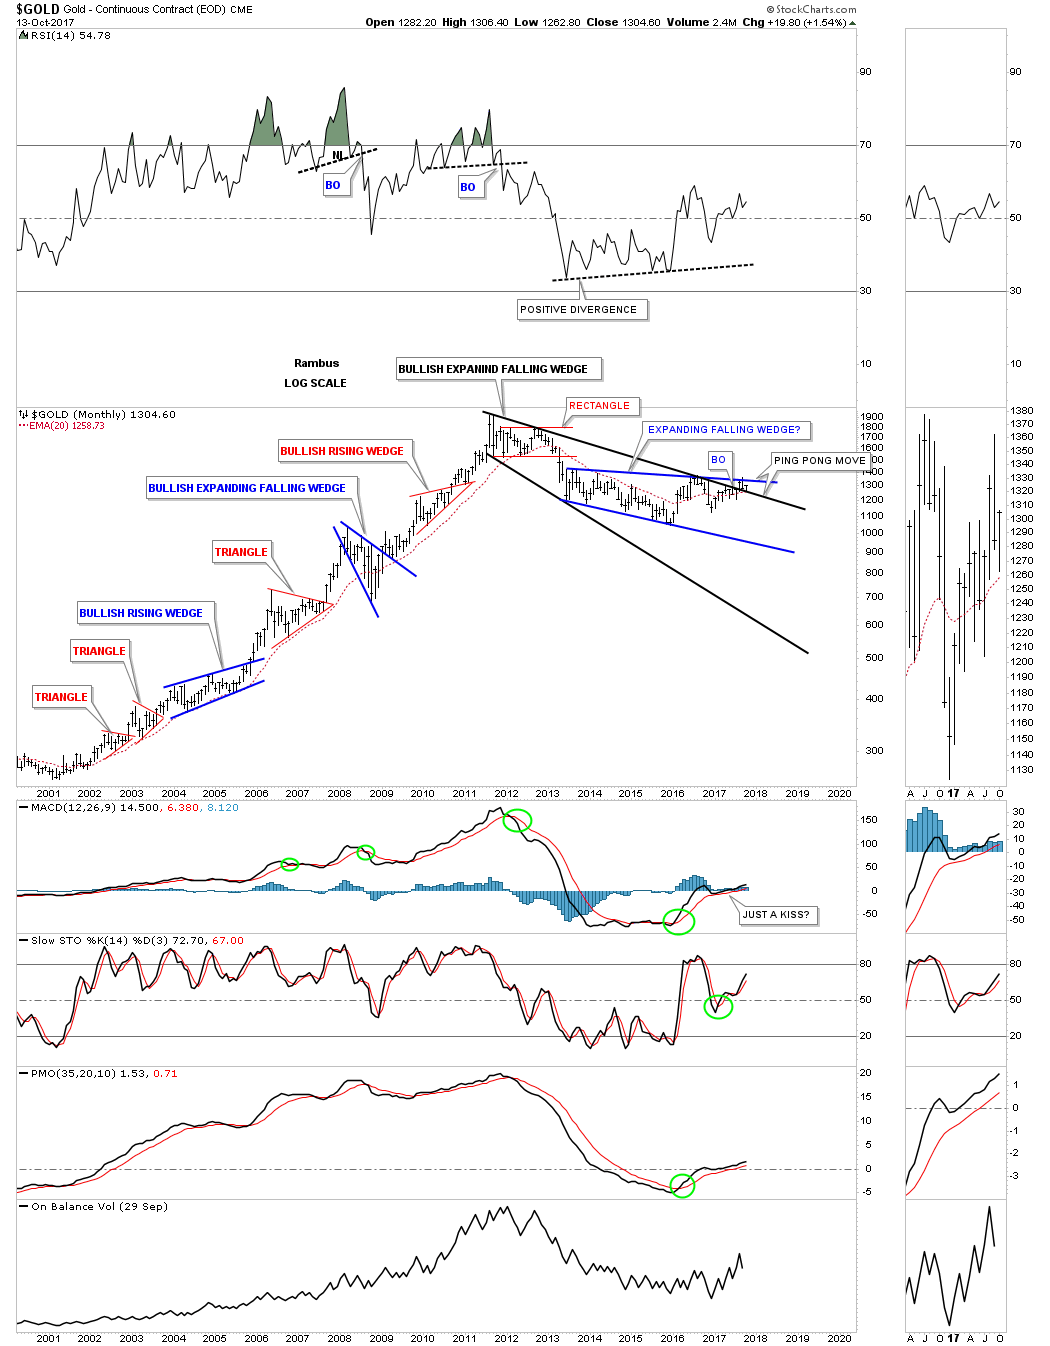
The blue expanding falling wedge without the top rail of the downtrend channel or the much bigger black expanding falling wedge.
Almost 2 years ago gold broke out above the top rail of the blue 7 point falling wedge with the top rail holding support on two backtests. It would be nice to see a white candlestick form at the end of this month and if the breakout is going to really take hold we should see a string of white candlesticks form all in a row which tells you the impulse is very strong. In a strong move down you will see a string of black candlesticks all in a row.
Gold’s major bull market uptrend channel with the 2011 bear market downtrend channel with the possible 2015 H&S bottom.
Gold’s long term monthly chart showing the potential H&S bottom.
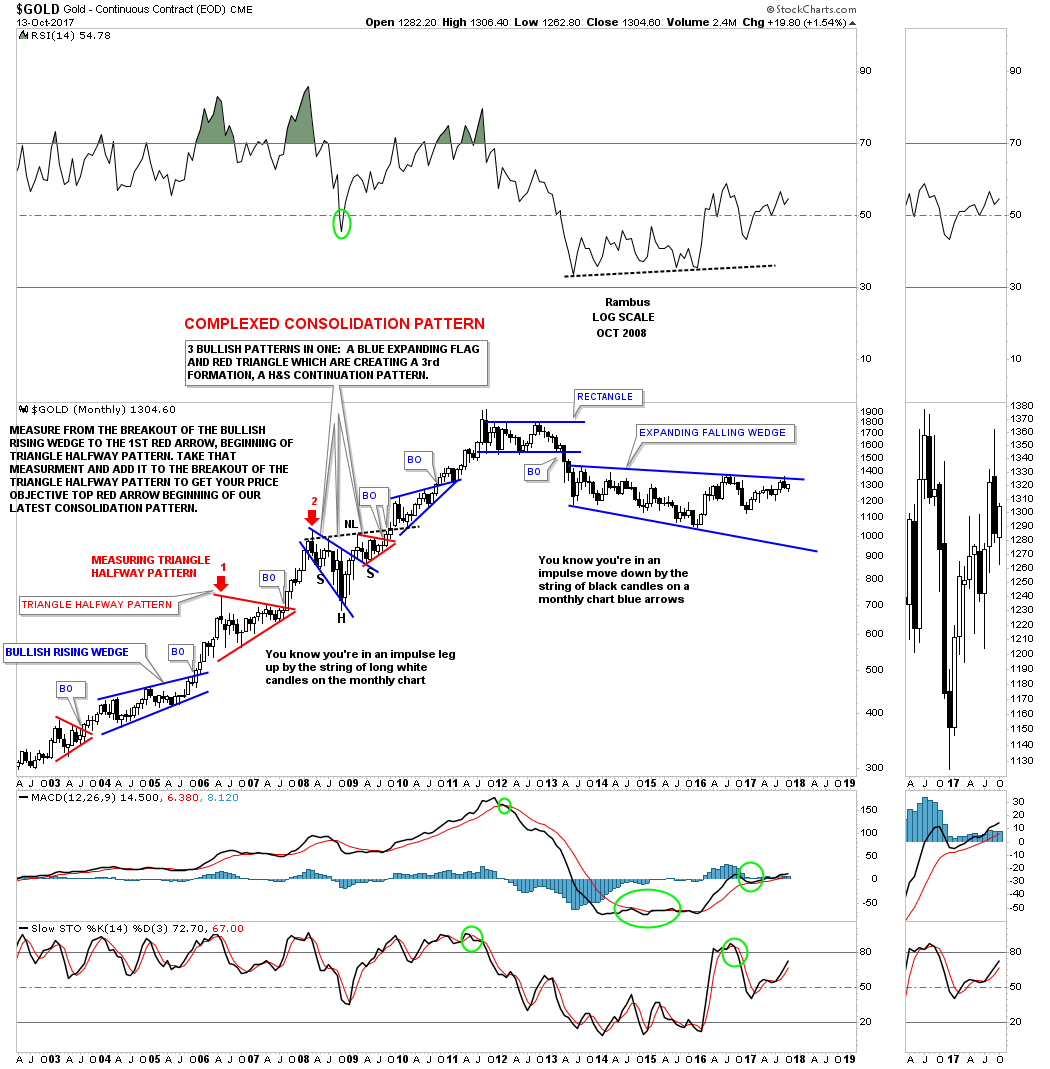
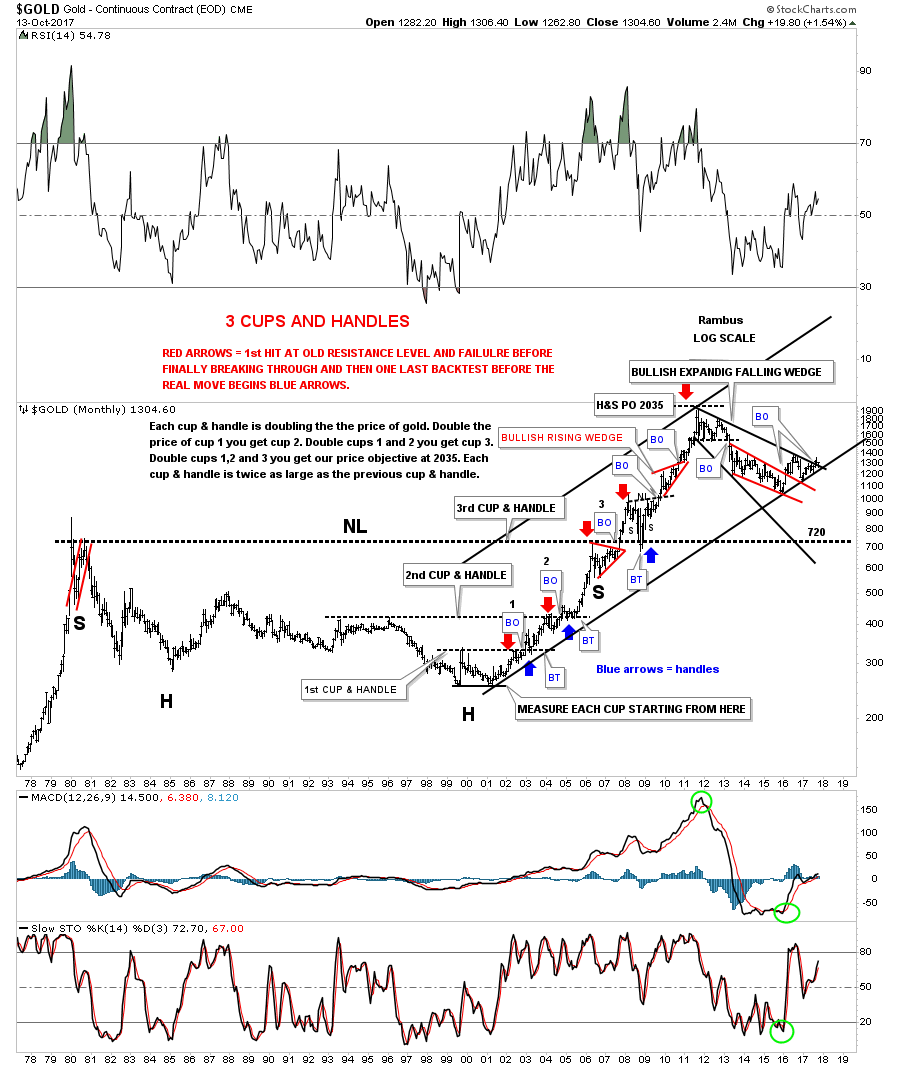
Gold’s 40-year chart.
********
 Meet Rambus, a seasoned trader and technical analyst renowned for his unbiased and insightful chart work. Through his website, Rambus Chartology, and Substack newsletter, Rambus shares his expertise with a global community of subscribers, providing daily updates, commentaries, and hands-on training in the art and science of chartology. With his calm, humble, and down-to-earth approach, Rambus demystifies complex market trends, helping his followers navigate the challenges of today's volatile markets. Join the Rambus Chartology community today and discover a unique blend of technical analysis, trading expertise, and time-tested protocols. Subscribe now at www.rambus1.com or https://rambuschartology.substack.com/


