Bullish Metals Ratio Charts Indicating a New Healthy Bull Market


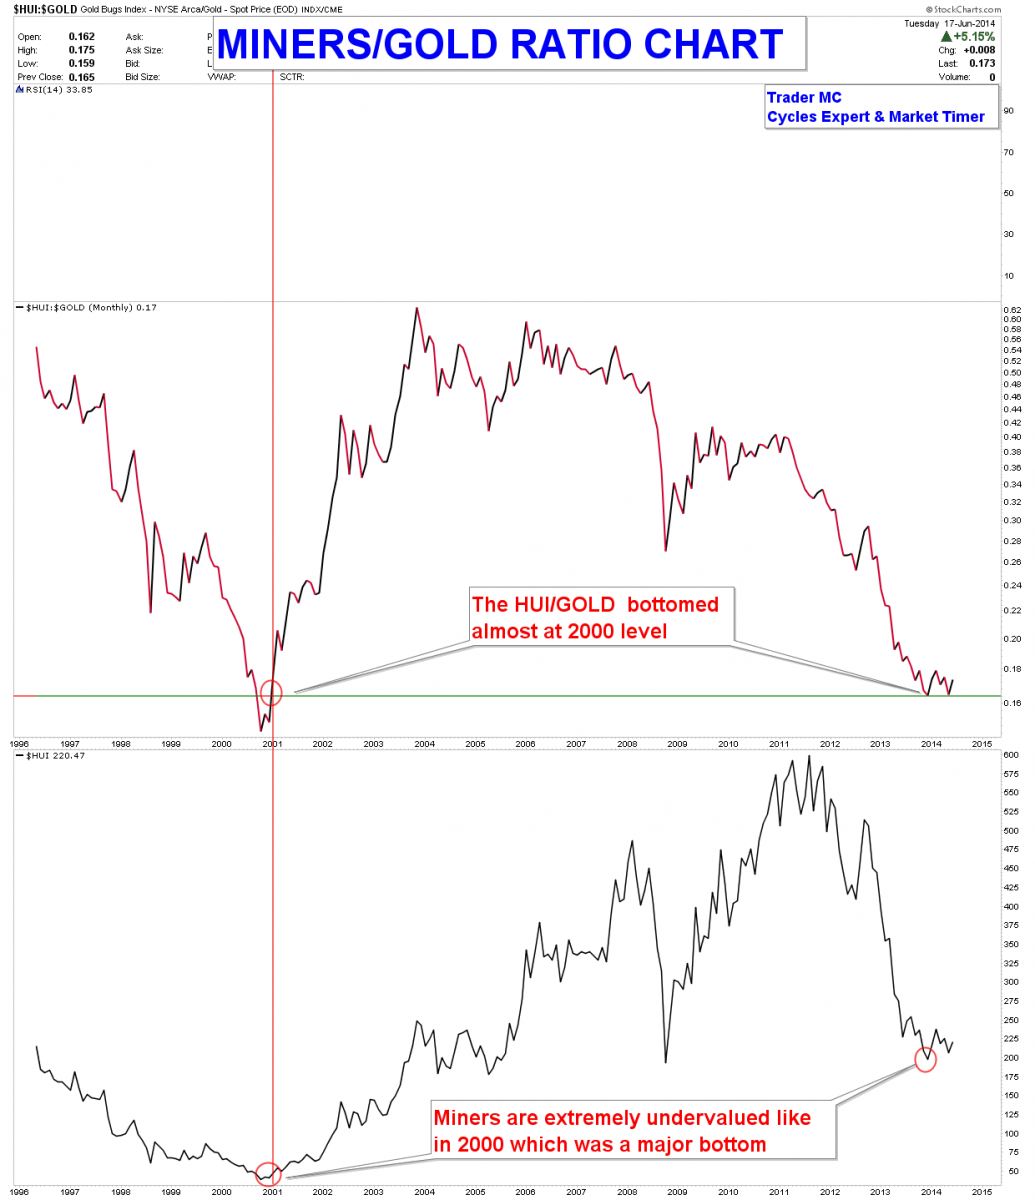
First of all, it is important to keep in mind that Miners are extremely undervalued and the down move in Metals was a cyclical bear market within a secular bull market which means that the primary trend is up. Bullish price action and bullish patterns have been taking place since several weeks in Miners and Metals. You can see on the following charts that the HUI/GOLD ratio bottomed almost at the same level as in 2000 which was a major bottom for the Miners Index.
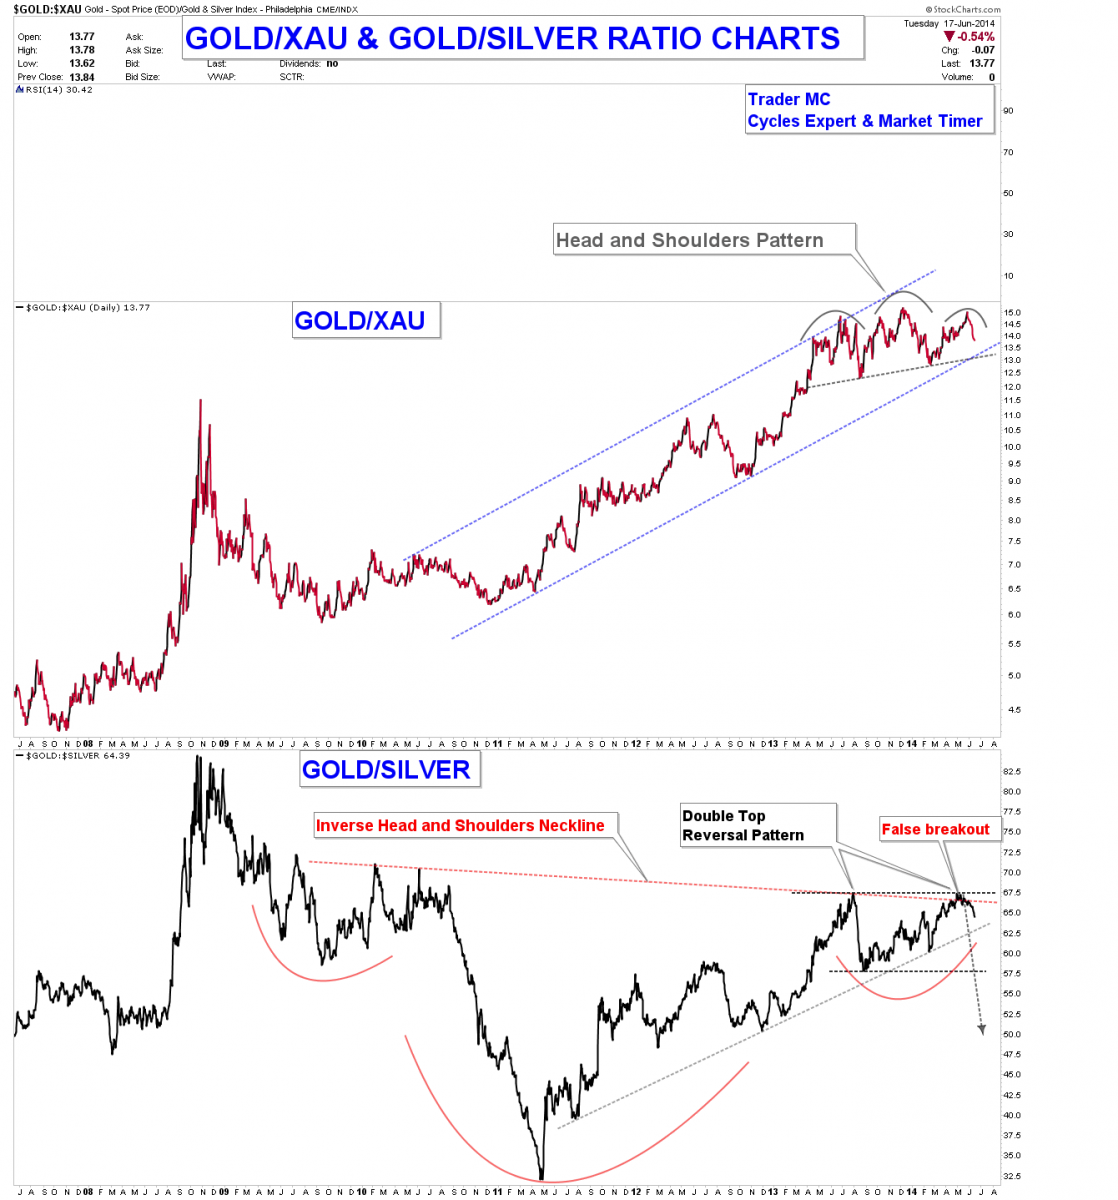
Below you can see that the Gold/XAU ratio chart is currently showing a possible Head and Shoulders Pattern which indicates that Miners are outperforming the Gold Metal. The Gold/Silver ratio long term chart made a false breakout of an Inverse Head and Shoulders Pattern. A false breakout often generates a strong move in the opposite direction.
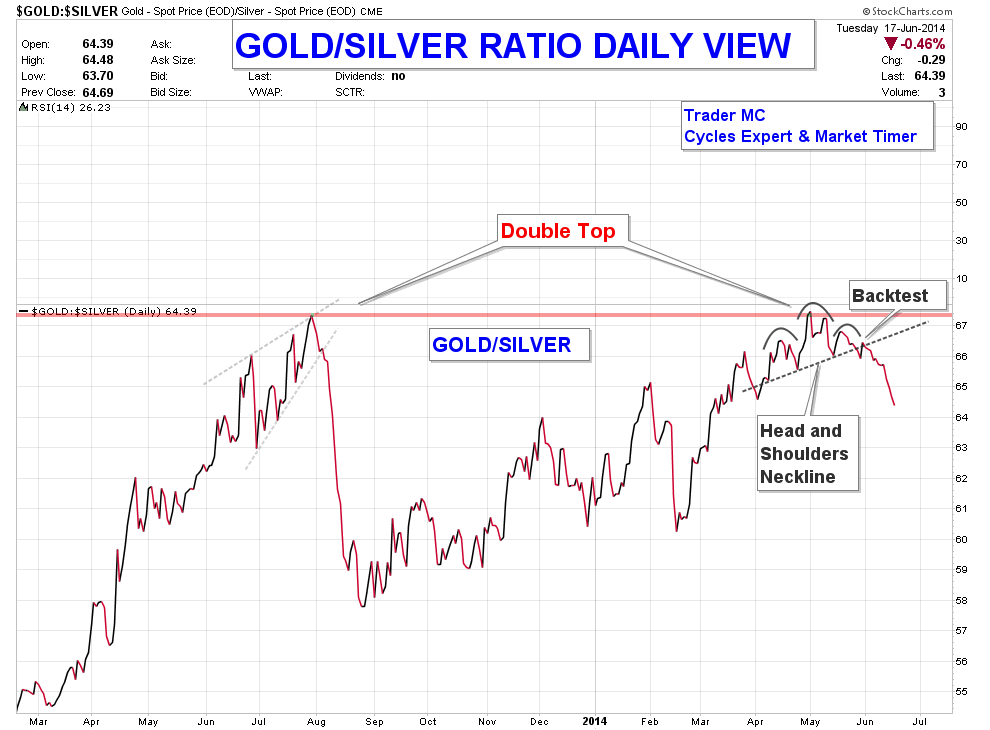
On a closer view you can notice that the Gold/Silver ratio chart made a Double Top Pattern and broke below the neckline of a Head and Shoulders Pattern. The Gold/Silver ratio backtested the neckline and is currently making new lows which is also a bullish sign for the Complex Metals. Miners are outperforming Gold and Silver is outperforming Gold, which is what we want to see in a healthy Metals Bull Market.
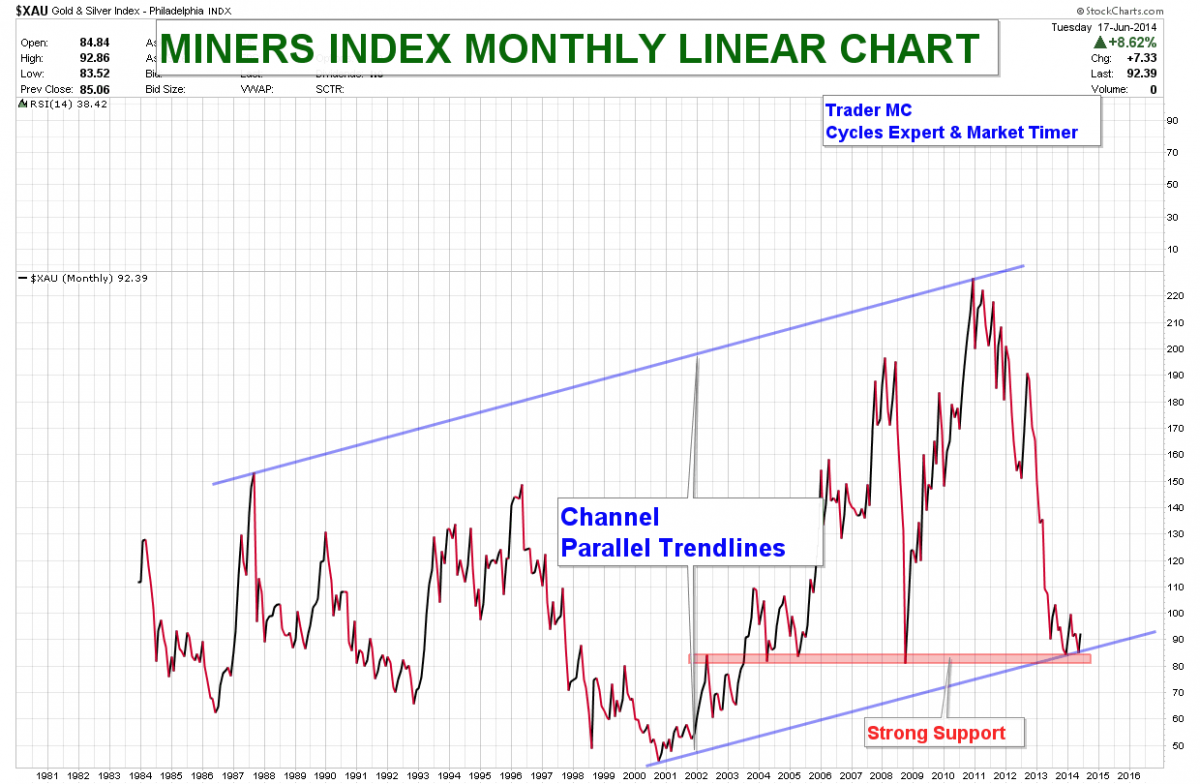
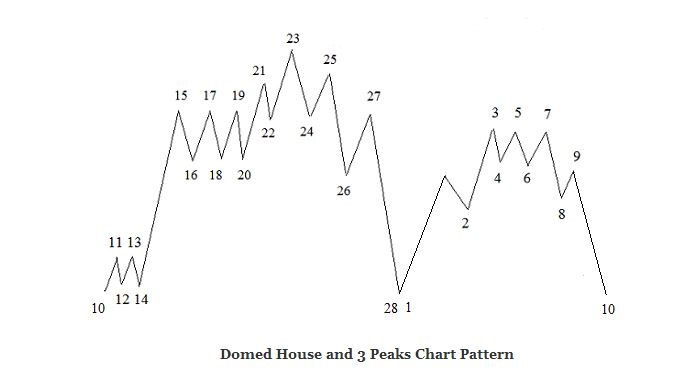
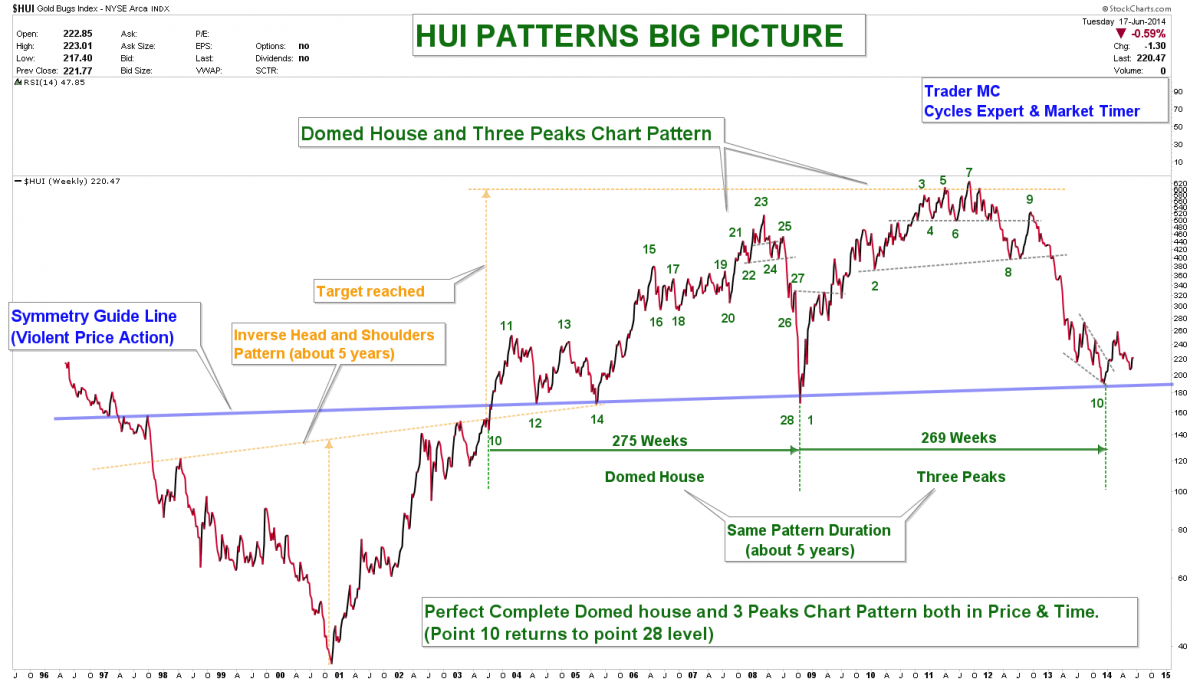
On the following chart you can see that the XAU Index backtested strong supports and prices reversed to the upside. The Domed House and Three Peaks Chart Pattern has also been entirely completed at point 10 several weeks ago and the price action reversed strongly to the upside at point 10.
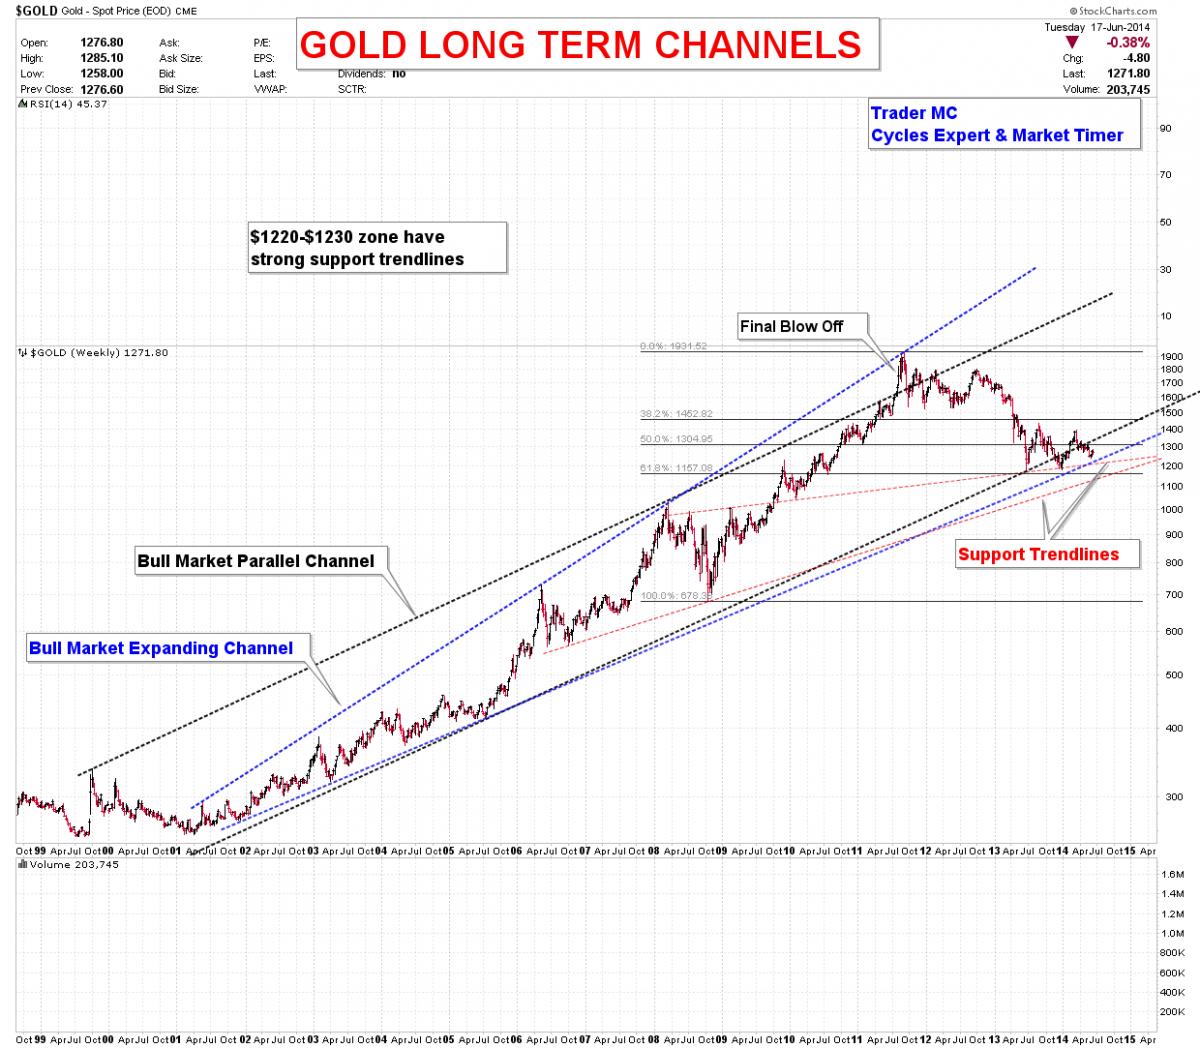
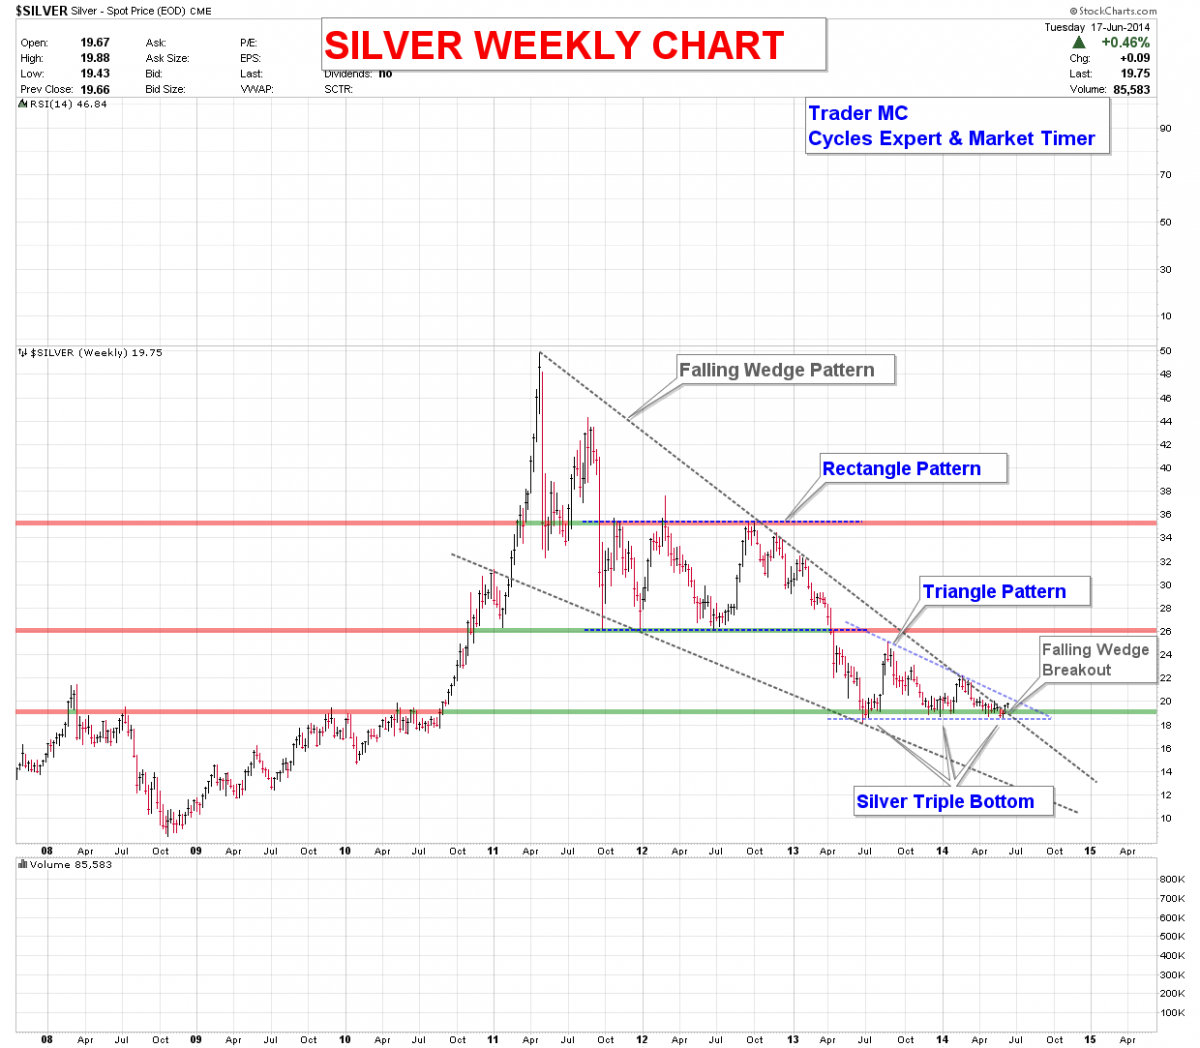
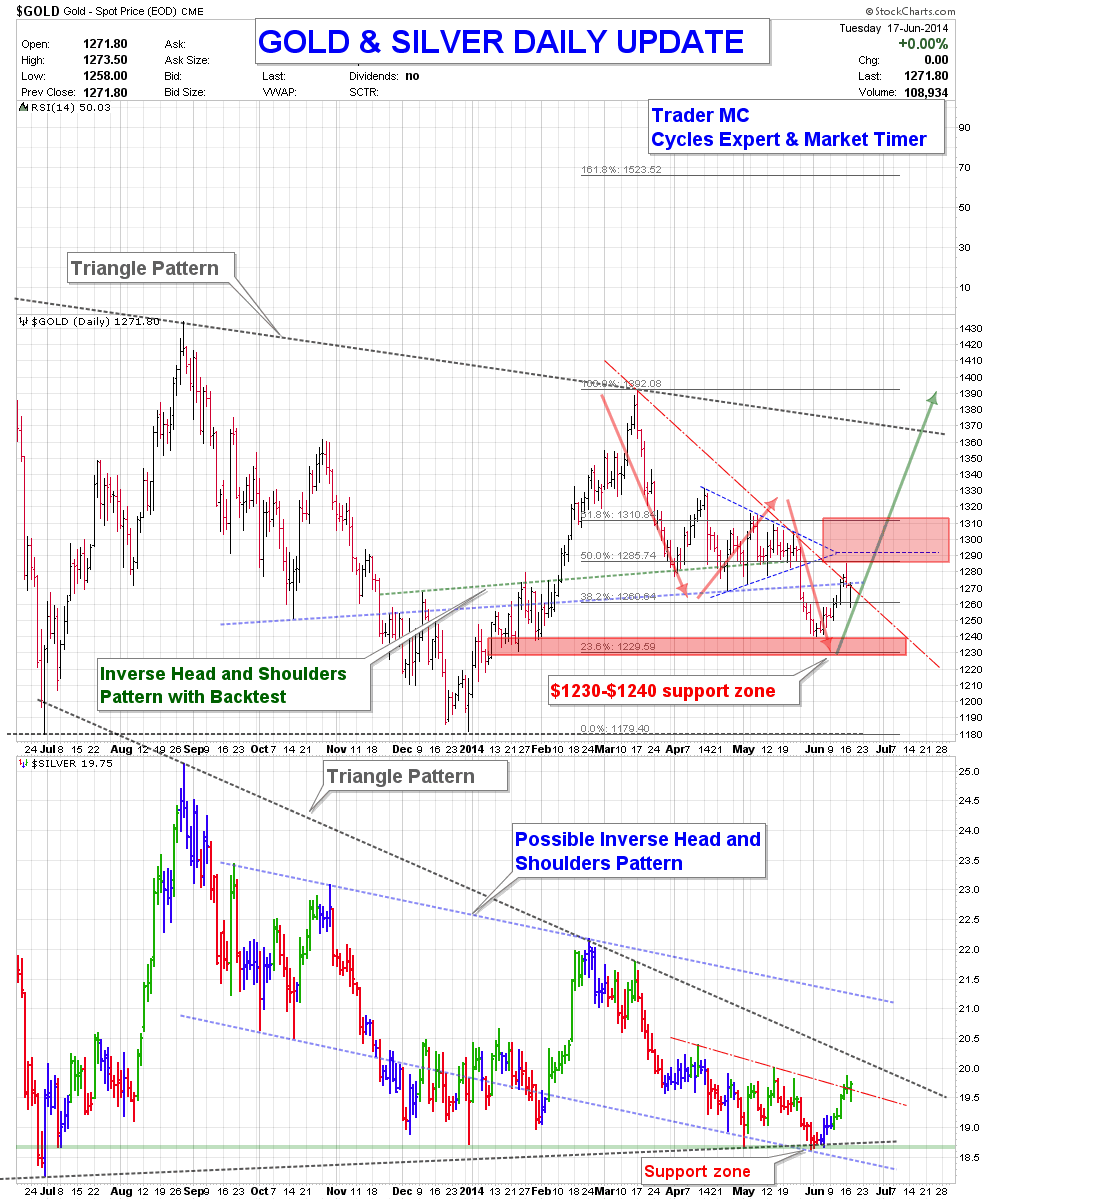
The Gold Metal has strong support channels around $1220-$1230 and Silver broke out of a Falling Wedge Pattern.
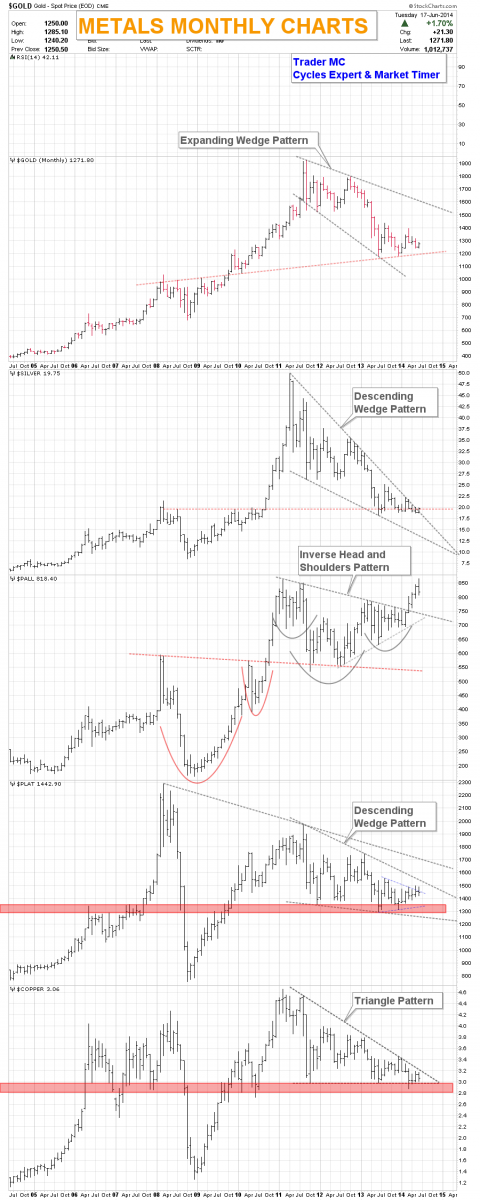
The big picture of all the Complex Metals is showing bullish consolidation patterns. Corrections often end with Falling Wedge or Expanding Wedge Patterns. Silver and Platinum are forming Falling Wedge Patterns and Gold is forming an Expanding Wedge Pattern. You can also notice that Copper is very close to break out of the Falling Wedge Pattern like Silver. Palladium is leading with new highs which is also bullish for the Complex Metals.
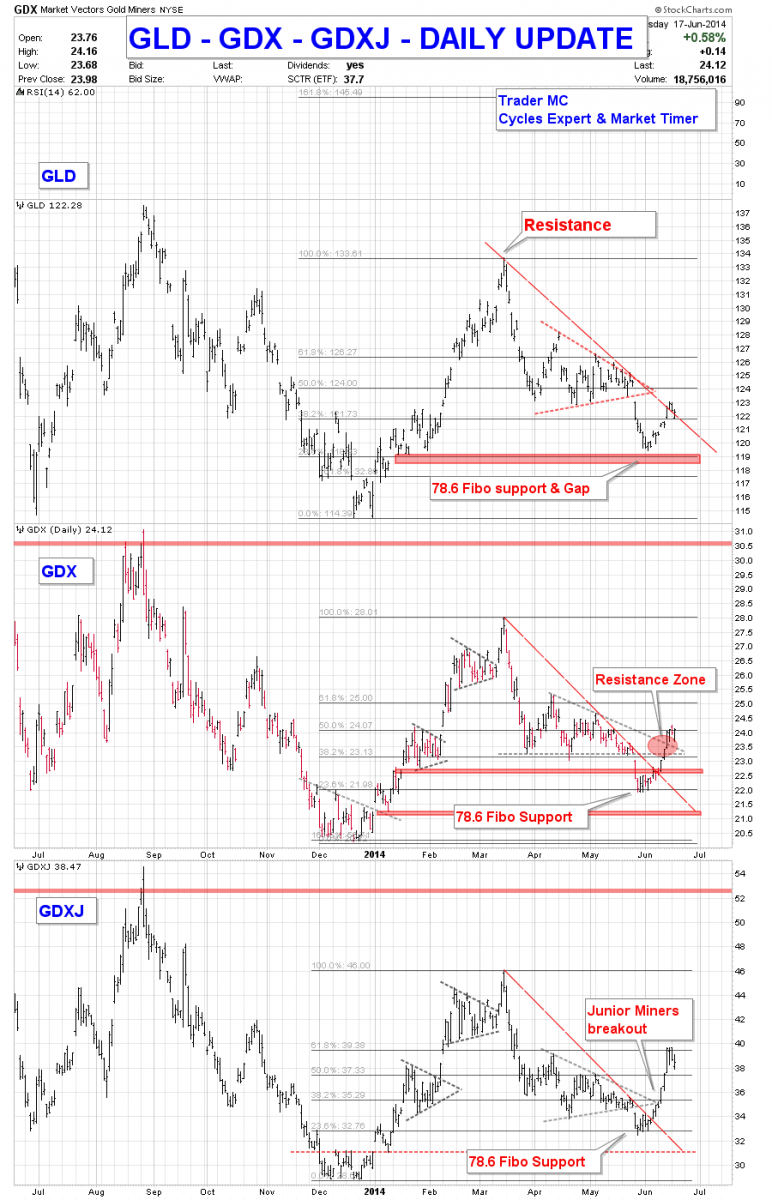
On a closer view you can see that Miners rebounced as expected on the 78.6 Fibonacci level. The Miners Junior Index (GDXJ) is leading as prices already broke above the apex of the Triangle Pattern and also above the declining trendline resistance.
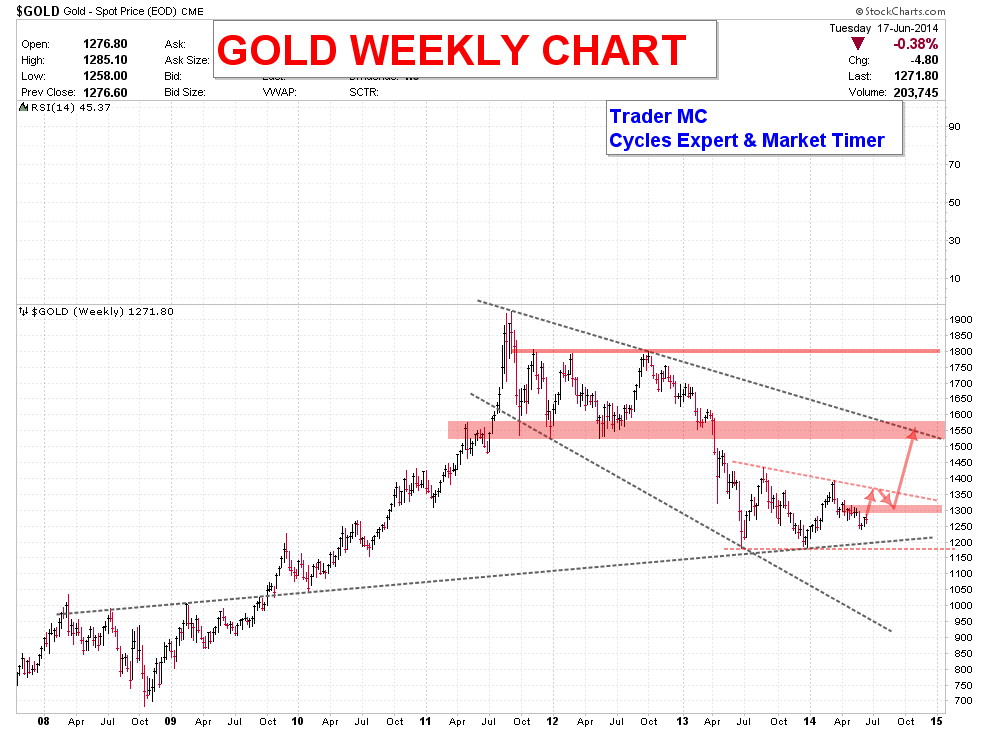
Gold has an important resistance zone at $1290-$1310, a breakout above $1310 should send it at much higher prices around $1550-$1600.
It has been several weeks that the price action has been showing us bullish patterns in Miners and Metals ratio charts. We therefore took long positions in Miners and Metals for the intermediate term trend (JNUG 3X leverage is already up 80%) as I think that it is important to respect what the market is telling us and to look for clues that reverse the trend. Charts are showing that the cyclical bear market has ended and the secular bull market primary trend has still a lot of upside potential.


