Can Lightning Strike Twice?


The saying goes that lightning can strike twice in the same place. Perhaps it can do so and also in the same season. Just more than 2 years ago, the following chart of the gold price and part of the comments appeared in the US Markets report. In this chart, the master line M was derived from a very significant trend line from a time when the gold price became unfettered and ran up to $850/oz in the first of its two major bull markets.
The master gradient from long ago carried forward and when gold fixed right on the lower boundary of the megaphone, it was considered that the bottom of the steep bear trend was in place and that the top of the megaphone could be a target.
-------------------------
Dollar Gold Chart
This analysis and the master line used for it has a long history, going back to the 1980s. The key feature is megaphone XF, with Friday’s PM fix ending right at line F. Megaphones are chart patterns that typically contain violent moves and reversals that can happen very quickly. Should this be the low for gold after the attack – with some room to move lower along line F – the new bull market has a target at line X ($1717) to complete the next leg of the megaphone.
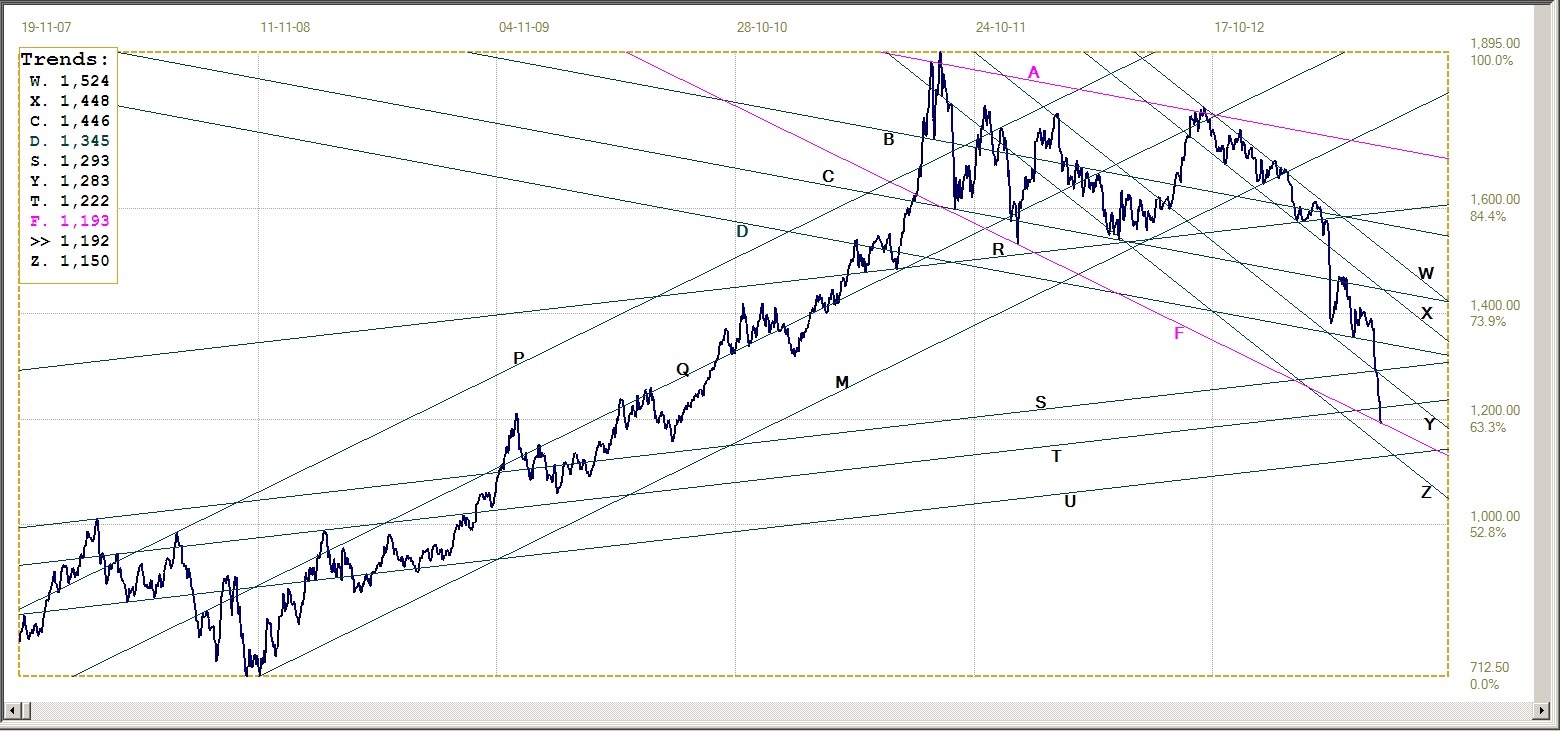
Gold price – London PM fix, last = $1192 (www.kitco.com)
---------------------------
As it happened, the price reversed right off that support line, but - sad to say - the new rally was not allowed to last very long. The Bear then took over again.
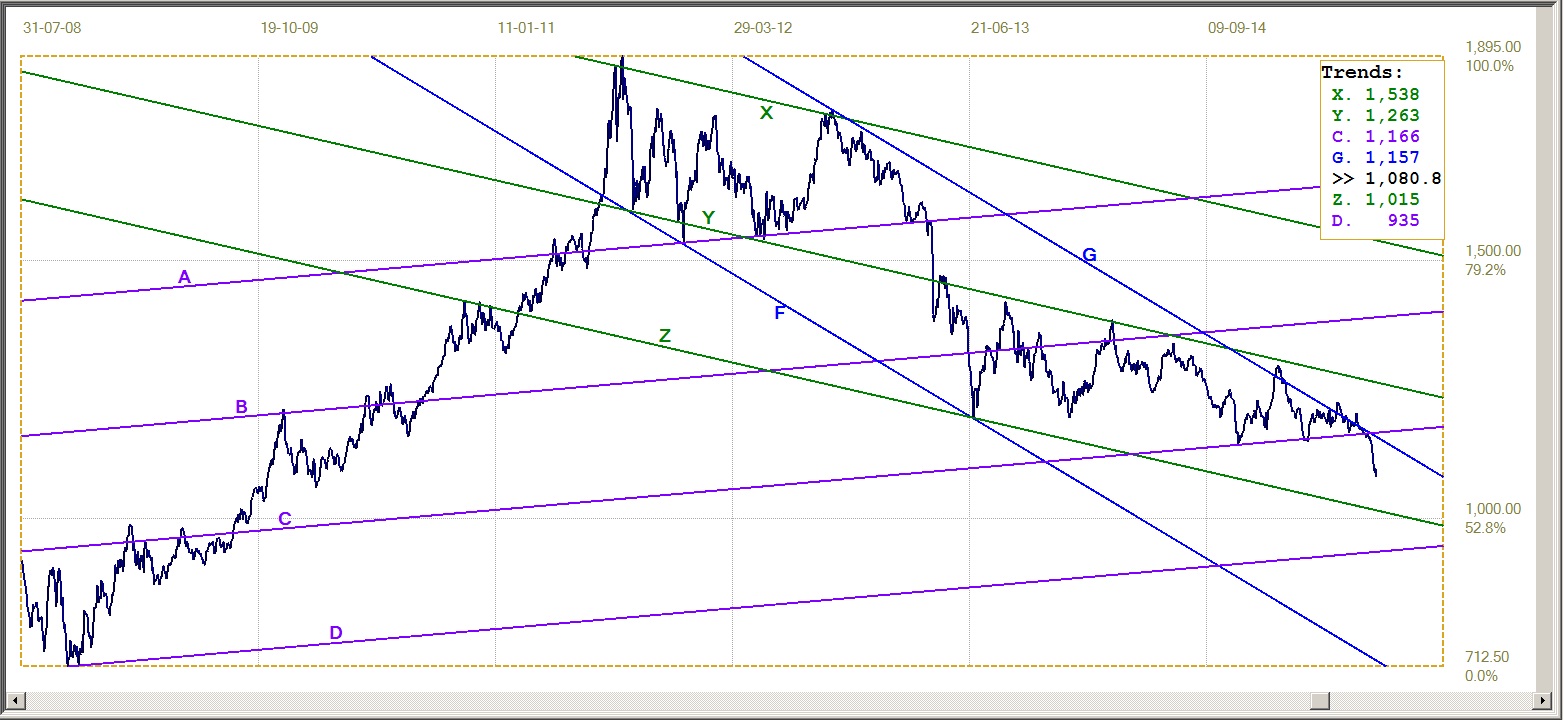
Gold London PM fix. Last = $1080.80
The first of two gold charts based on an old master line shows the London PM fix on June 30, 2013 right on the lower boundary of megaphone XF at its cross-over with line Z. For quite a long time a chart with its focus on triangle GC was a feature of the US Market report. Right at the time when one could have expected a break to above line G and the start of a bull trend, the price suddenly broke lower.
As the price was testing resistance at line G after having completed its leg 4 with a second rebound off line C, the prospects looked good, but the break then took place in the opposite direction. In a rather similar event in February 1996, when the price also broke lower just after a bullish break from a major chart pattern, my interest in the gold market took off and started the study of the internet and the gold price that still occupies me today.
I believed that such abnormal breaks from the kind of patterns that I had learnt to treat with good confidence over more than a decade of pattern analysis meant that an outside event - or in the absence of such an event an outside force – had taken control of the direction of the market. I still hold that belief; the break below line C on the chart above is another example of such a break.
Below is a second chart using the same old master gradient. Bear channel XYZ in the chart above is replace with a chart with a slightly steeper gradient which also has been derived from the original gradient. The slightly lower gradient of channel PQR has line R that also passes through the end June 2013 low acting as the lower boundary of another major chart pattern – a pennant in this case.
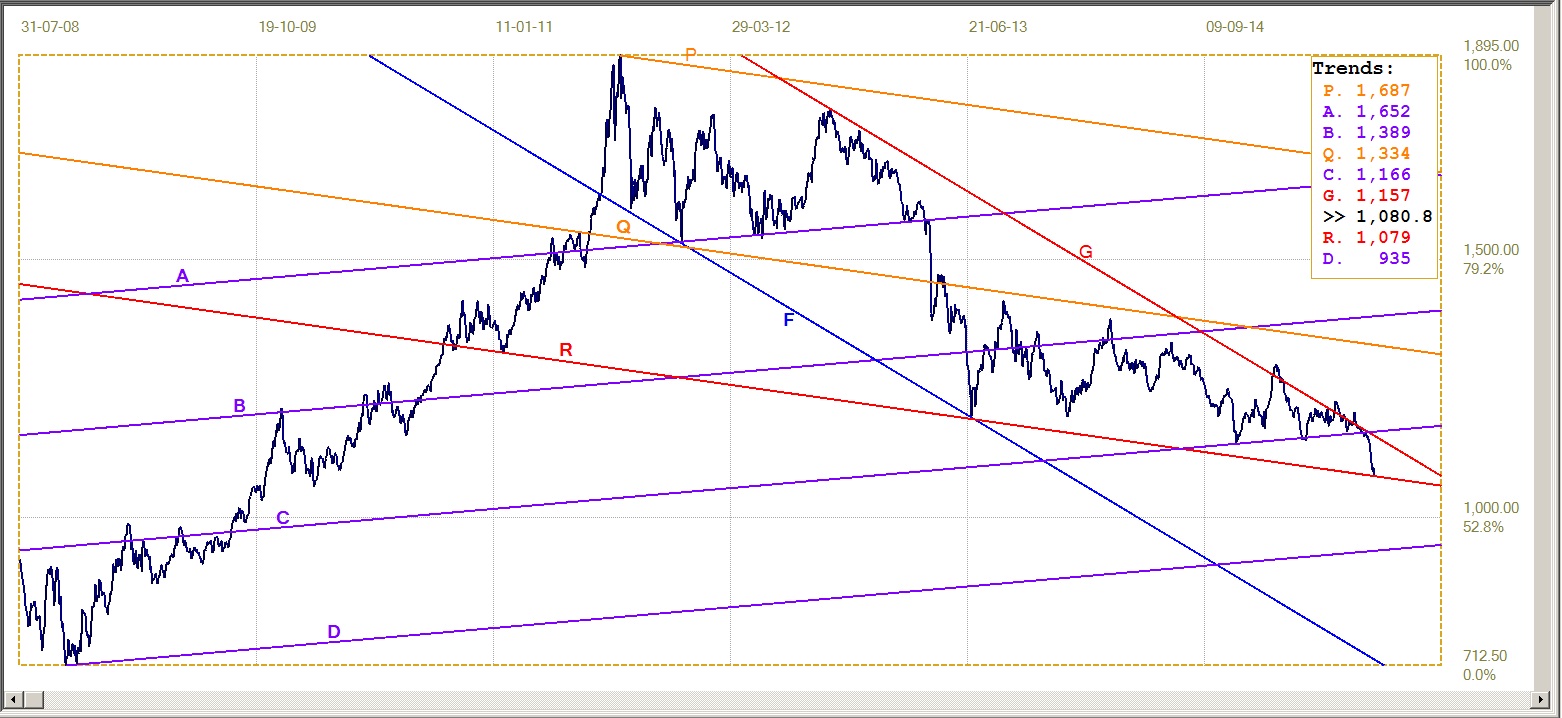
Gold London PM fix. Last = $1080.80
Pennant GR has just completed its leg 4 at line R with the PM fix at $1080.80 on 24 July, also a Friday. The question now is whether the support at line R – also part of a major chart pattern similar to line F as bottom boundary to a large megaphone – will prove as solid as line F had done two years ago.
At that time there was mistaken optimism after the massive and steep down trend in the price of gold that the bear market had ended with the reversal higher off line F. That was not to be; the bull trend fizzled out in an extended, if volatile, sideways and bearish trend that for the moment seems to have ended with a final collapse in the price to complete leg 4 of pennant GR. A break below the pennant could find support at around $1015 from line Z in the preceding chart.
This time, however, the remainder of the pennant does not offer adequate room for a similar sideways trend that developed after July, 2013. Hopefully, the pattern will prove its worth with a break higher into the long-awaited bull trend. However, one should not allow optimism to run rampant – as we all know well, there may well be an engineered and unpleasant surprise waiting in the wings. Nevertheless, I hold to a positive frame of mind until developments prove me wrong.
********
(c) daan Joubert July 25 2015


