Capital Markets Outlook


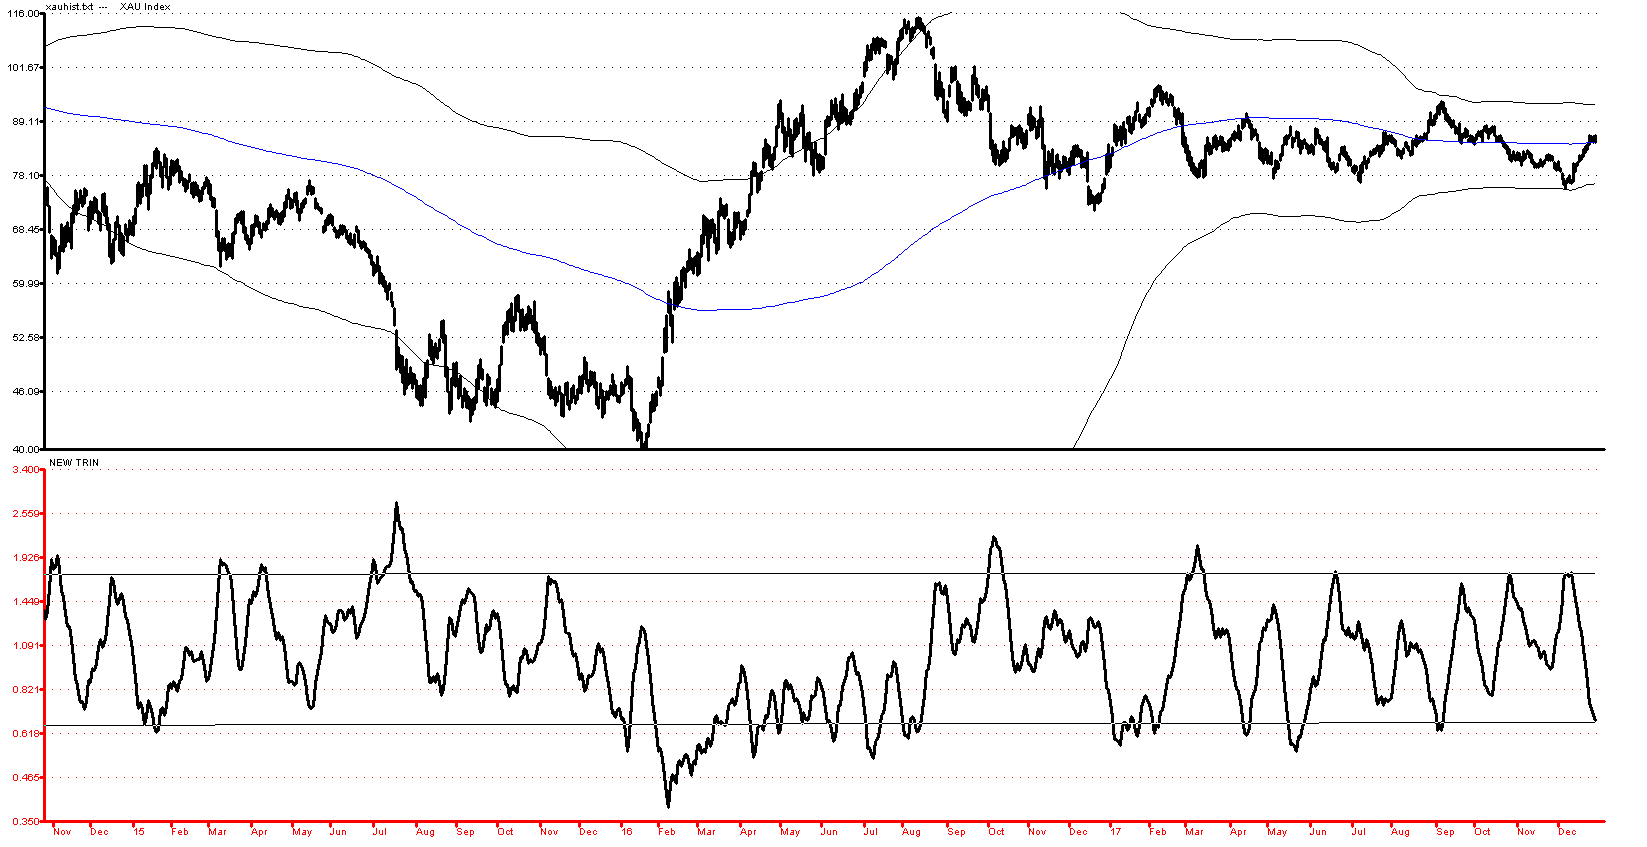
Gold stocks have enjoyed a nice rally off their lows, rallying up to initial resistance at the 182 area on HUI and then pressing even higher over the balance of the last 7 to 8 days. For the year 2017, HUI was up 5.42%, GDX up 11.08%, and XAU up 8.12%, with virtually all of those gains coming in the final 9 days of the year. On the positive side for 2018, both gold and the gold stocks did manage to hold very important support at the lower one year, or 250 day trading band and the initial rally off those lows looks to have good momentum and breadth characteristics. Potentially the kind of positive technicals that could well be signalling a more important turn.
In this vein, it is very possible that a large A-B-C Wave (2) corrective pattern has been completed in the gold stocks (and gold) and that 2018 will see the stocks head consistently higher tracing out an extended primary Wave (3) advance which would easily exceed 100% over the next 12 to 18 months.
Above: The Medium Term ARMS Index has flipped from oversold to overbought in just the last two weeks. Low readings like these can be a sign for near term caution and can mark peaks, although the ARMS Index is better at spotting bottoms then tops.
Yet, while we will be quick to acknowledge that the weight of the technical evidence here is now bullish, we do not believe that the gold stocks or gold is fully out of the woods just yet. To begin with on the bearish side, all of the technical indicators have fully unwound their prior oversold readings and are now back to intermediate term overbought. In the very short term, gold stocks and gold both seem to be ahead of themselves and a bit
extended, implying that a near-term dip or consolidation should be the order of the day over the first five to eight days of the New Year. That means there is a good chance that at least some of these recent gains will be retraced as the Dollar rallies off oversold levels and gold comes in.
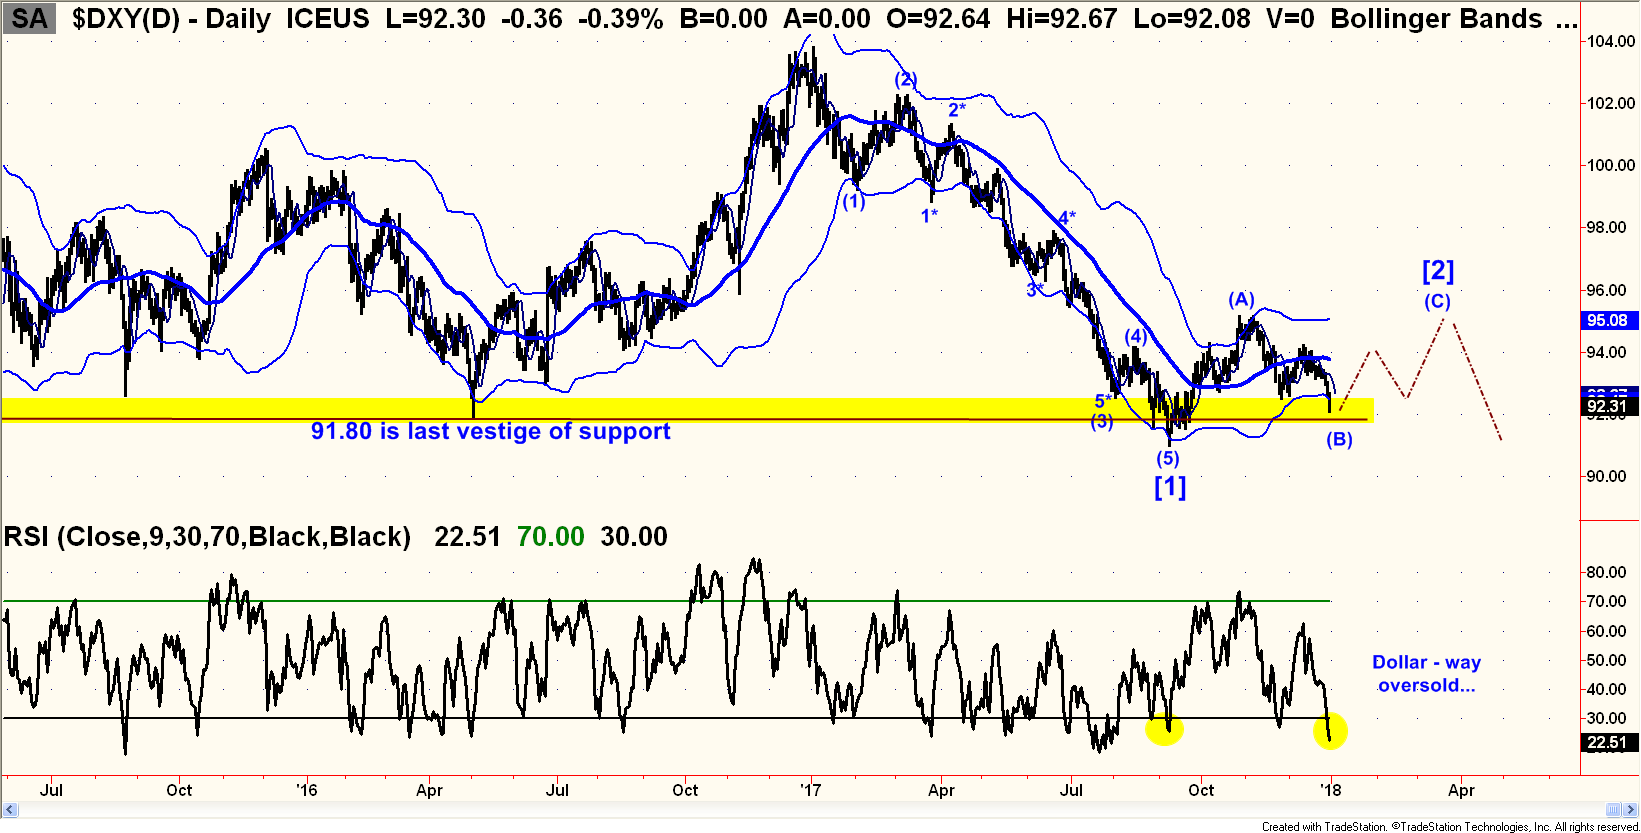
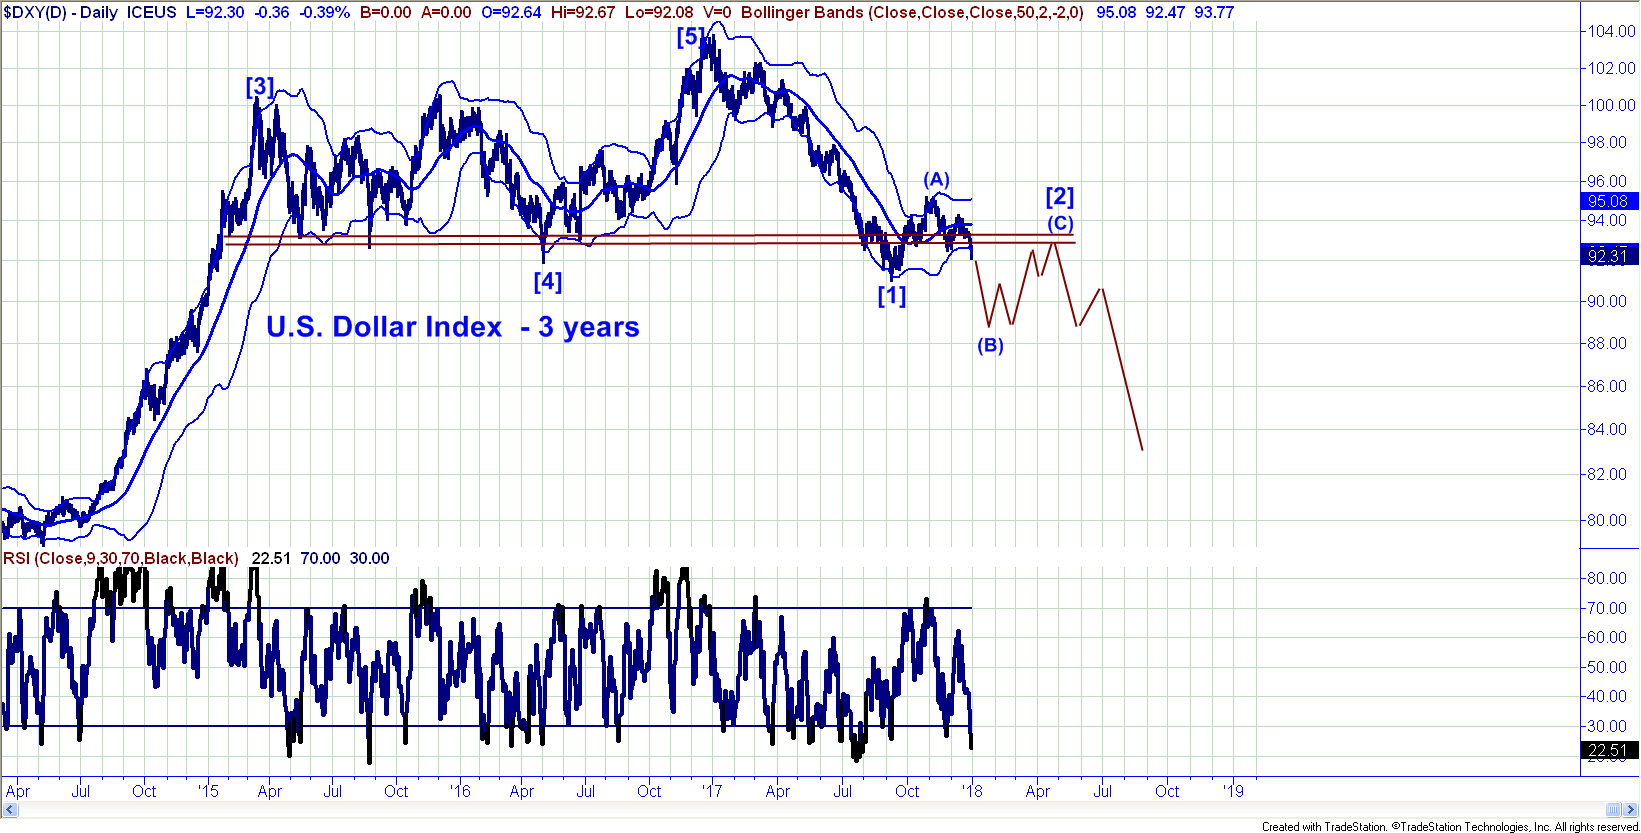
Looking at the overall structure of the U.S. Dollar, at least one reasonable interpretation here is that 2017 saw the Dollar record a primary Bear Market rally high on January 3rd at 103.82 and then begin a new bear market decline with Intermediate Wave [1] or [A] of that decline bottoming on September 8th 2017 at 91.01. For our managed accounts at my prior post, we made excellent money betting on a Dollar decline from the January highs and were holding Rydex 2X Short the Dollar most of the way down along with a bevy of International Unhedged Global Bond Funds (DIBCX, PFUIX, BEGBX, and others) all of which did very well . We exited those positions in late August as the Dollar approached its former lows and the area of very major support at 91.80 which goes back as horizontal support for two to three years.
The pattern since then in the Dollar has been a classic, weak A-B-C counter trend rally, where it now looks like Intermediate Wave (A) up peaked on Nov 7 at 95.15, and Wave (B) down is bottoming right now. Notice the very extreme 9 day RSI reading on the U.S. Dollar at a reading of just +22.51 on Friday. This is the 2nd most oversold daily cluster of readings of the past 18 months. The implication is that the Dollar could find support in here and could rally once again off the 91.80 area and bounce perhaps most of Q1 back up toward the 95.00 to 95.50 area on more time. While some might be tempted to jump to the quick conclusion that this is potentially very bearish for gold, we would resist that temptation. If, for example, war were to break out in North Korea, the Dollar could rally on a flight to quality and so could gold, so the two do not always move in opposite directions and I think in the present circumstance, not only could war drive both the Dollar and gold higher, but so could a potential risk off move in the stock market which will very likely see at least a 20% decline at some point in 2018. More on that latter in this report.
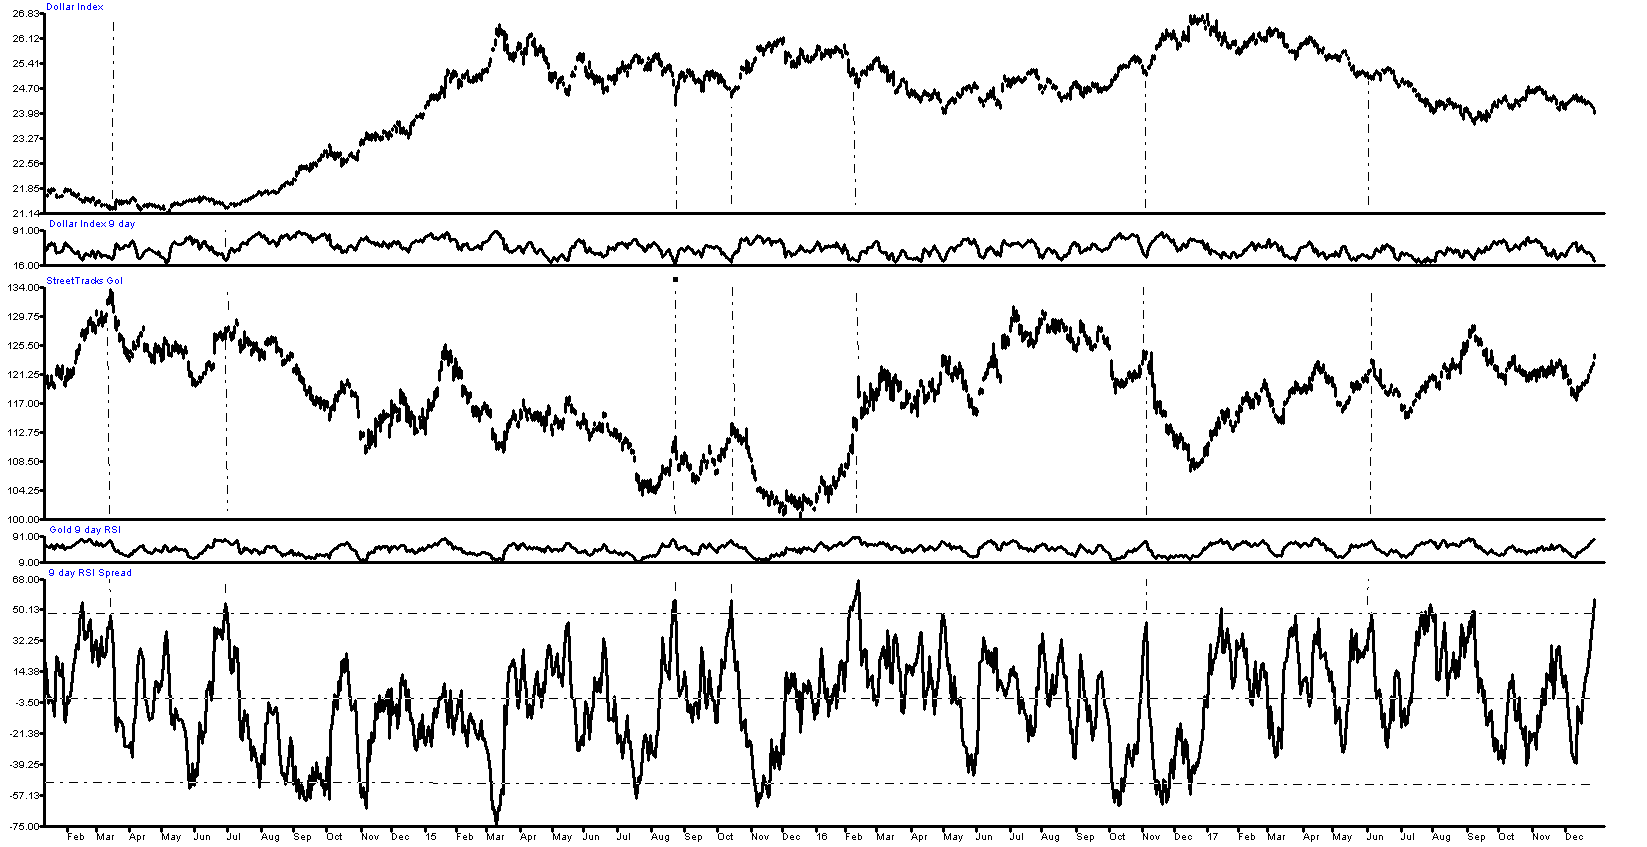
One nuance we want to note which again addresses really the short term situation in gold and the Dollar is the RSI spread between the UUP ETF (which is based on the Dollar Index Long) and the GLD ETF (which is long gold). Using a 9 day RSI, on Friday, the UUP 9 day RSI ended at a very oversold value of +23.96 while the 9 day RSI for GLD ended at a very overbought value of +80.20. If we subtract the UUP RSI from the gold RSI we get +80.26 less +23.96 leaves a spread value of +56.30. On the prior page, we have plotted the daily 9 day RSI values in very small graphs below the Dollar (upper clip) and below gold (lower clip). We have then plotted the spread between them at the very bottom, (larger clip). Note that it is rare when the spread on the two 9 day RSI’s is above +50. As one would suspect, most of the time, when this situation prevails, the Dollar has a solid bounce and gold rolls back into a decline. Importantly, in those situations where the Dollar fails to rally, and Gold fails to decline, looking at the weight of history on this it is invariably a good sign for gold.
In those bullish instances, the spread tends to mean revert toward zero, or -25 and at that point if the give back in gold has been minimal and the gain in the Dollar also minimal, then the pathway forward for gold to advance in steady fashion is cleared.
Bottomline: what this tells us is that we should expect some consolidation or giveback here early on in the yellow metal in 2018, and a rally in the Dollar. However, if the give back in gold over the next 5 to 8 days is only minor, and likewise the rally in the Dollar is poor quality, then we could be setting up for a very dramatic round of upside acceleration in gold and a full scale break down in the Dollar.
Above: the Weak Scenario for the U.S. Dollar Index featuring a near-term breakdown below 91.60
In our current thinking, we are going to place a lot of emphasis on precisely what happens over the next few days. The odds must be very high that the combination of a deep oversold reading and proximity to major support should produce a strong Dollar bounce almost immediately. If that fails to develop, and instead the Dollar starts to snowball downhill much below 91.60 we would take that as an indication that a full scale break down toward 89.00 could be in the works. In that scenario, the (A)-(B)-(C) correction for the Dollar would take on a downward skew and the upward (C) wave rally would be delayed until late January, and would then likely fail in the area at the underside of what had been major support, which would then role reverse and become major resistance at 91.80.
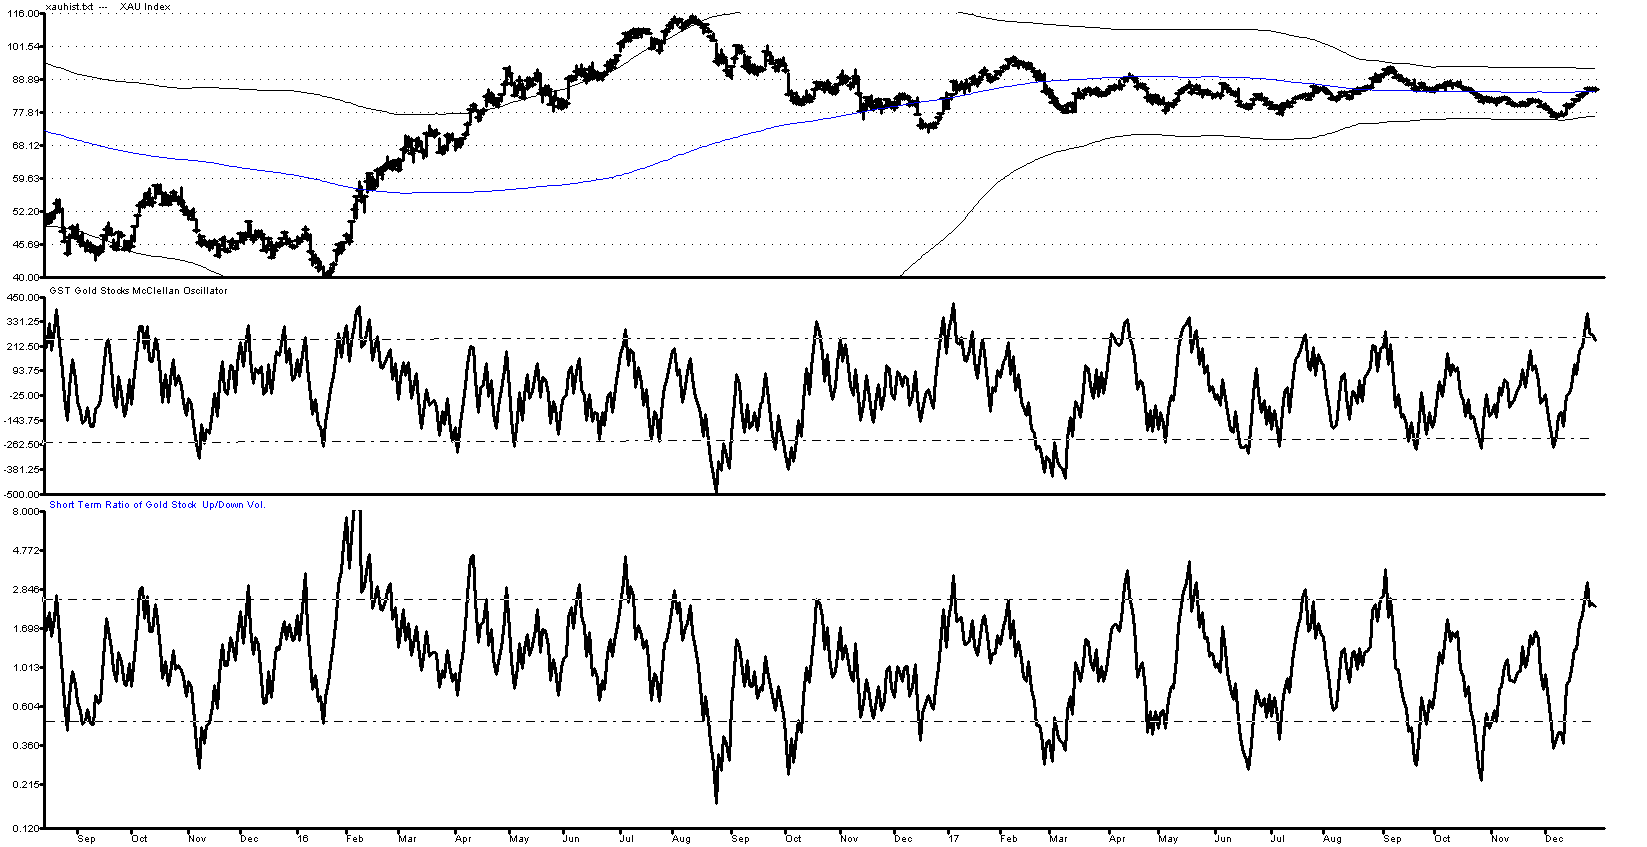
Above: upper clip the XAU Index, middle clip McClellan Oscillator for gold stocks, lower clip Short Term Ratio of Up to Down Volume for gold stocks
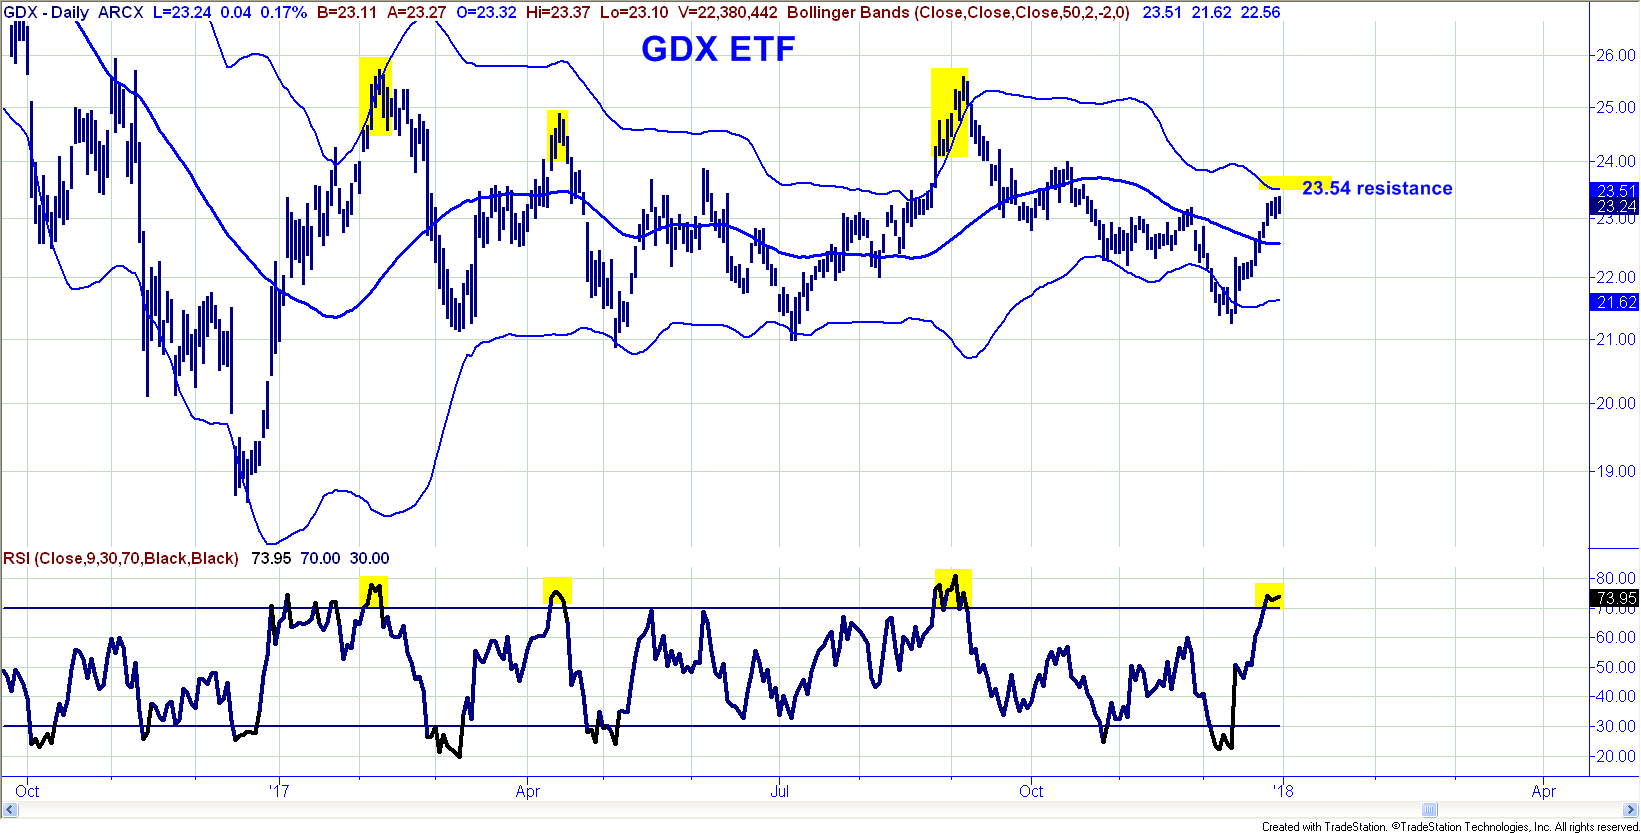
Other gauges for the Gold Stocks are also coming off short term overbought conditions. In the case of the short term McClellan Oscillator for gold stocks, the gauge peaked last Tuesday at +372, and has been easing down from that high with readings of +274 on Wed, +270 on Thursday and +239 on Friday. +250 is normally overbought on the McClellan Oscillator. For the Short Term Ratio of Up to Down Volume, readings this past week were 3.11 on 12/26, 2.26 on 12/27, 2.35 on 12/28 and 2.25 on Friday 12/29. The 9 day RSI for GDX ended at +73.95 which is also a fairly full overbought short term reading. A look at the chart atop of the next page shows that these readings have been near term tops for GDX over the last year, (see yellow highlights). Also, the 50 day upper Bollinger Band is just above current levels for XAU, HUI and GDX. Because the 50 day average still has a fairly descent down angle (just starting to flatten out), the upper band in this circumstance is usually pretty strong resistance. It is not uncommon to see prices tag the upper band and then pull back to the middle band moving average. For GDX, that would imply a potential dip toward $22.57. Any scenario that involves either a high level - latteral consolidation or behaviour that is hugging the upper band would be more bullish and imply a deepening degree of underlying strength. Again, the next few sessions should really tell us quite abit.
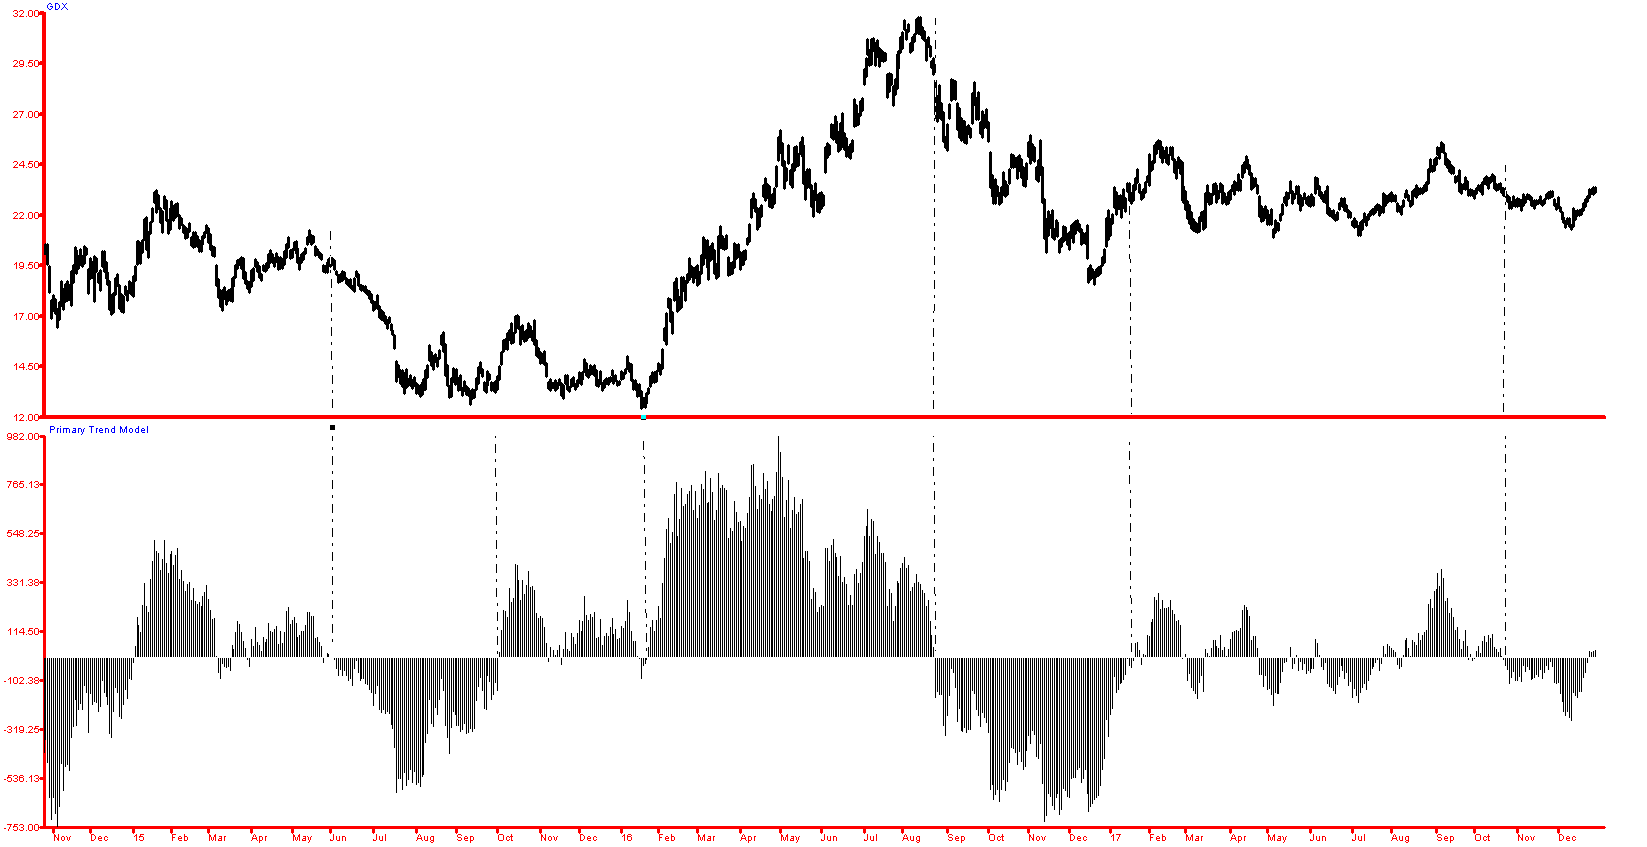
Above: Key component of GDX Primaryv Trend Model
Finally, we do want to note that when we review our primary trend following models, key components of these models are at present just starting to turn bullish. This is shown in the historgram at the bottom of page 6 which has just moved from below zero to above zero. While trading range markets like the one of the last few months can generate more frequent signals, we never discount these buy signals because we want to remain in gear with the primary trend. In our view, the most likely outcome over the next five to ten days is a mild sideways correction or consolidation in both gold and the gold stocks. At that point, we could see a low risk entry point if conditions look correct that would be good positioning to capture another leg up. We suspect that GDX will dip back to at least $22.80 if not $22.50, and physical gold will pull back toward $1285.
The Stock Market
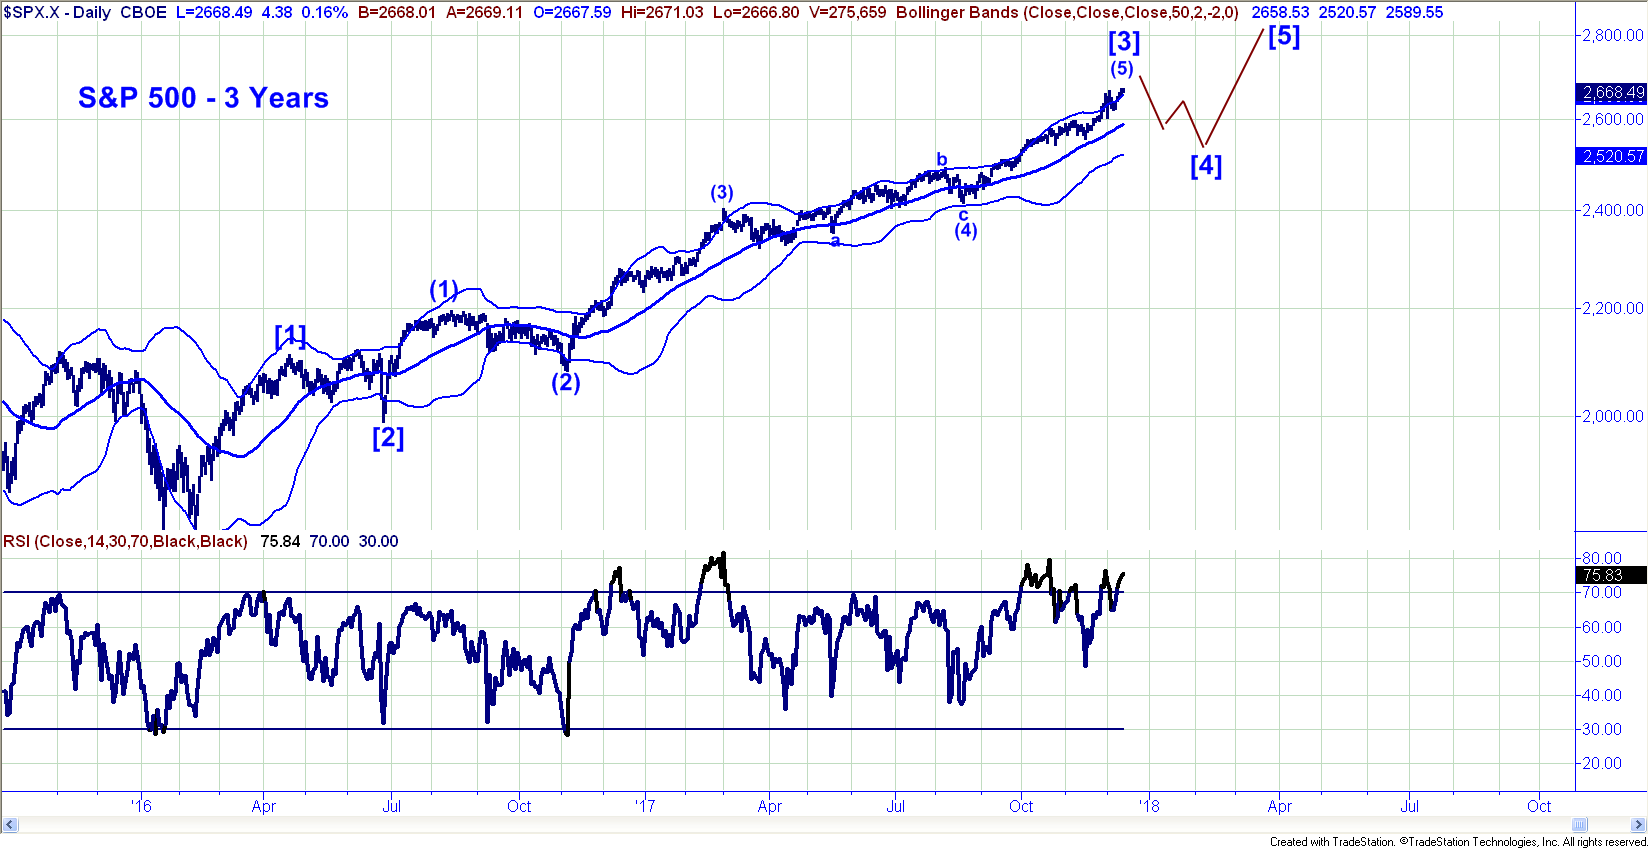
The stock market ended the year on a down note with the S&P falling just over 13 points on Friday. The session produced an outside reversal day down with a close on the low of the day. Over the last few weeks, the daily momentum pattern for the S&P has been deteriorating with a string of lower highs on RSI against higher highs on the S&P index. Friday’s action also snapped a well defiend short term rising trend line. So far, the price damage is not significant, but right now, we would lien toward the ideas that Intermediate Wave 3 has peaked and a Intermediate Wave 4 correction is just getting underway. We would not be surprised to see the S&P Index dip toward 2600-2628 over the next two weeks and check in with a few days of daily readings on the 9 day RSI below +30.

If the market is going to head lower, we should see downside follow thru in the early going this week. Alternatively, any upside reversal from here and movement back toward the highs would most likely indicate a sideways consolidation and over time that could set the market up for another run. For now, stocks look tired and somewhat vulnerable and we would not be surprised to see an over due pull back, possibly a sharp pull back in the early days of the New Year. It would take a meaningful break lasting more then two or three days below 2580 to start turning our primary trend gauges negative and at the moment, because long term momentum has been so high, we do not believe that will occur. The likelihood for the S&P in terms of 2018 is a pull back in the early phases of 2018, then another big rally to new all time highs possibly lingering into May-July and then a bigger reversal to the downside.In updating our view of the chart below, (first shown in the last newsletter), we think a fourth wave set back will hold in the 2580 zone and that a final fifth wave to new highs will likely be seen in the first few months of 2018.
Treasury Bonds
The Bond market has steadied up nicely over the last few days, as the price of TLT has rallied from a low of 123.95 on 12/20 to a year end close of 127.55. We believe there is still some potential near term downside risk possibly a retest of 124.00 that could develop, That said, the overall tone of the Bonds looks to be a horizontal traingle which is very likely an upside continuation pattern which will see rates fall.
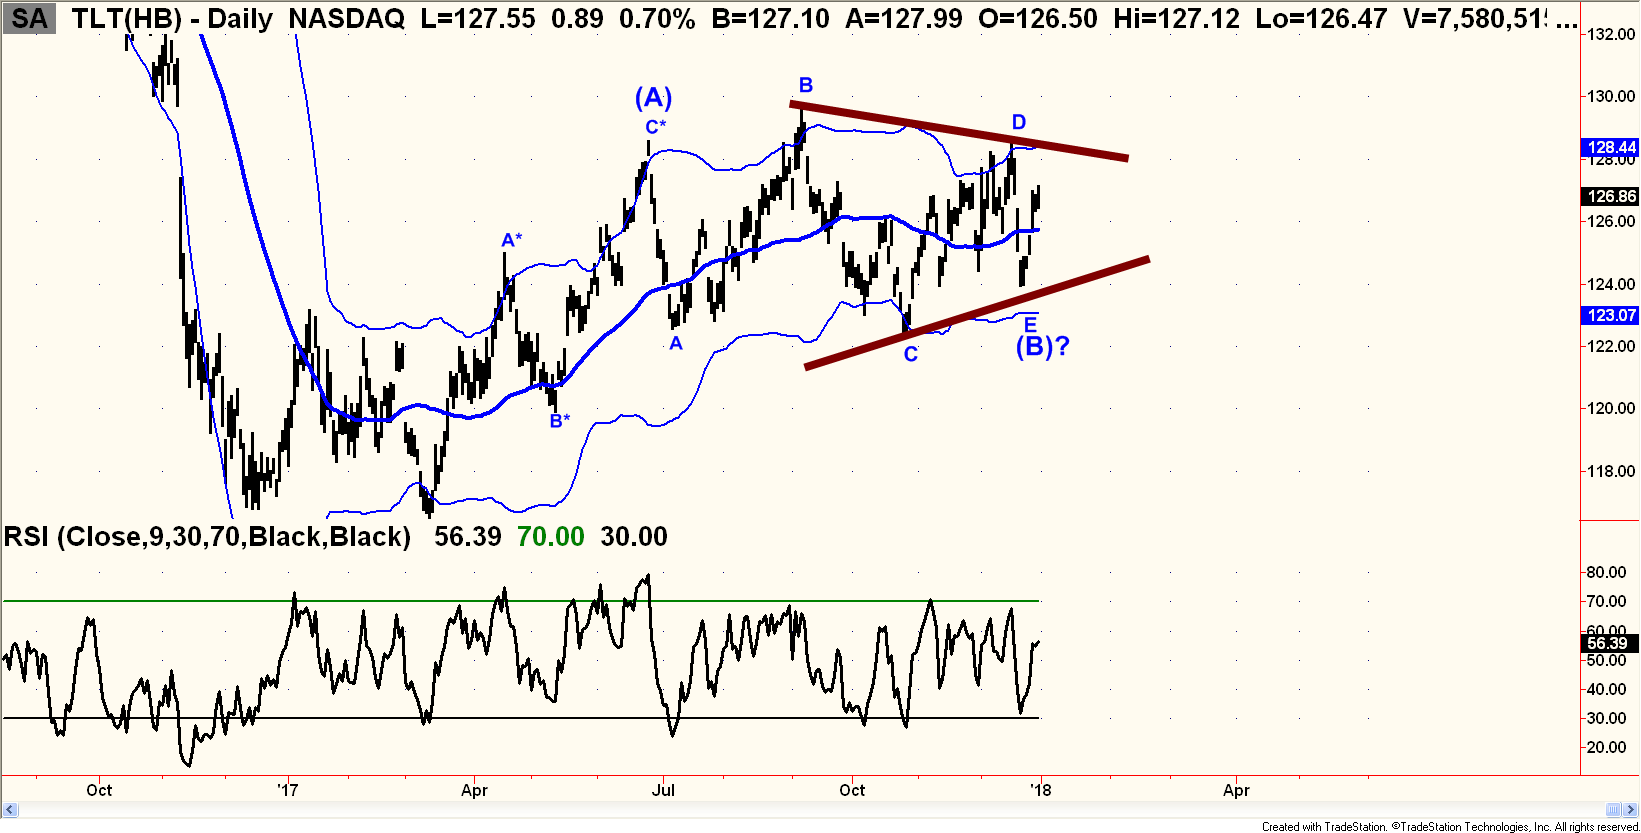
We are actually hoping that TLT and IEF can pull back for a few days early in the New Year as we believe that could lead to an excellent opportunity to position money in Bond funds. If prices strengthen much from here, it will likely suggest that the lows are in place for Bonds and that a new leg up in prices and down in yields is getting underway. Wage growth has been completely absent during this cycle and therefore there is very little in the way of true inflation pressure. While it is true that the tax cuts could boost growth for a sugar high quarter or two, we believe bonds have already likely priced most of that in. Again, a dip here back toward 124 in TLT would be most intriguing and could be one of the years best trades on the long side. We will have more on this soon especially if TLT weakens in the near term.
*********
Disclosures: The Gold Stock Technician (GST) by Frank Barbera is offered to individuals to share some of our views on current markets. Materials in this report are copyrighted and proprietary to Gold Stock Technician and may not be reproduced or distributed without our expressed written approval. All rights are reserved. Past performance is no guarantee of future results. All opinions expressed constitute GST’s judgment as of the date of this report and are subject to change without notice. This information should not be used as the primary basis for investment decisions. It should not be assumed that any security transactions, strategies, holdings or sectors discussed were or will be profitable, or that future recommendations will be profitable or will equal the investment performance discussed herein. Investing in equities and other securities involves risk to your principal. Individual client account performance will vary and no guarantee of any kind is made as to the results that may be obtained from using these reports. These reports are impersonal and do not provide, nor are they intended to provide, individualized advice or recommendations for any specific audience or portfolio. To the maximum extent permitted by law, Gold Stock Technician, Frank Barbera disclaim any and all liability in the event that any information, commentary, analysis, opinions or advice contained in these reports proves to be inaccurate, incomplete or unreliable, or result in losses on any investment. The information provided in these reports is obtained from sources which the author believes to be reliable. However, the author has not independently verified or otherwise investigated all such information. Neither the author, nor GST guarantees the accuracy of any such information.

Frank A. Barbera, Jr. CMT joined Salem Partners Wealth Management in 2015 and has over 28 years of experience in the global capital markets. Prior to joining Salem, Mr. Barbera was an Executive Vice President and Co-Portfolio Manager for the Sierra group of mutual funds including the Sierra Core Retirement Fund (SIRIX) and the Sierra Strategic Income Fund (SSIIX) where he helped managed more than $2 Billion in assets. Prior to Sierra, Mr. Barbera worked with Caruso Affiliated Holdings where he successfully managed the Caruso USA Hedge Fund LLC navigating successfully through both the 2001-2002 and 2007-2008 bear markets. In 2007, Mr. Barbera penned a long series of weekly articles on Financial Sense.com, which remain archived online, forecasting in advance many of the major corporate failures that were seen in 2008, along with much of the breadth and scope of the 2008 global financial crisis.
In 2003, Mr. Barbera was featured in the popular book published by the New York Institute for Finance entitled “Master Traders: Strategies for Superior Returns from Today’s Top Traders” Over the last two decades, Mr. Barbera has functioned in the role of Investment Strategist, Global Macro Economist, Portfolio Manager and Market Technician. From 1994 to 2012, he edited the bi-monthly newsletter, “The Gold Stock Technician” which focused on the technical outlook for equity and metals markets with a special focus on mining stocks. Mr. Barbera specializes in rules based trend following systems for both high and low volatility securities.
From 1991 to 2000, Mr. Barbera hosted two daily live television shows on the Business Channel, “ChartWatch” and “Technically Speaking”. From 1998 to 2013, Mr. Barbera acted as a consultant to several large scale institutional trading desks including Bel Air Capital in Los Angeles as a trading advisor on their multi-billion dollar Core Equity portfolio.
A student of Austrian School Economics and Minsky Boom/Bust credit market dynamics, Mr. Barbera has been widely quoted in the media and on TV including Fox Business News, CNBC, The Wall Street Journal, Investor’s Business Daily, Money Magazine, the Washington Post and Barron’s, Mr. Barbera is a frequent guest speaker at Investment Conferences across the United States, where he remains in high demand.


