Charting The Crash - How Far Will The Bounce Reach?


The purpose of this update is to define exactly where we are on the market clock, because if we know where we are, broadly speaking we will know where we are going.
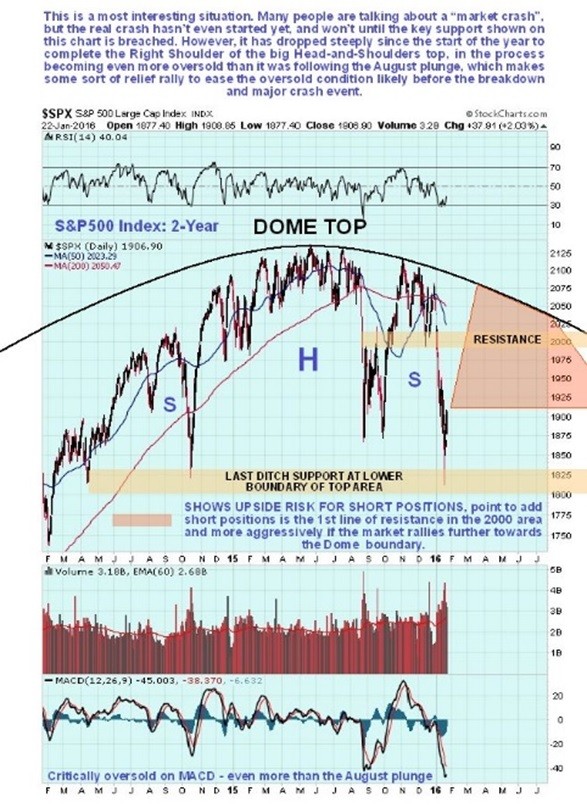
Last week the market plunged to arrive at the last ditch support level in the 1800 – 1850 zone on the S&P500 index that we had earlier defined as marking the lower boundary of the giant Head-and-Shoulders top. Once this level is breached, the full-on crash starts. Because it arrived at this support level in an even more oversold state than it was at the depths of the plunge last August, and because Smart Money has become bullish, it made it unlikely that it would break down and crash just yet, and sure enough the market has started to bounce, which means that the danger has probably abated, for now. The stabilization of the market here is expected to generate a short covering bounce, regardless of the rotten fundamentals, and as it unfolds the “reasons” for it will be presented in the mainstream financial media as “Market responds to stimulus talk” etc. The big question now is how far this bounce is likely to get, and that is what we are going to attempt to determine here, because it is crucial for the purpose of piling on short positions at the optimum juncture at the best prices in the future.
Smart Money is looking for a bounce…
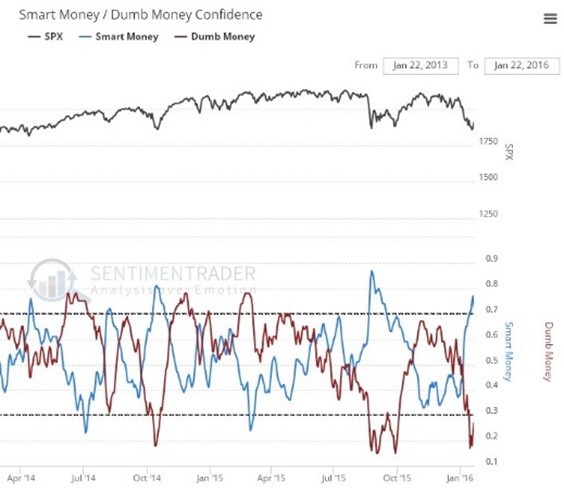
Chart courtesy of www.sentimentrader.com
Whilst no-one can be sure how far this bounce will get, possibilities vary from it being over already to it making it all the way back up to the Dome boundary shown on our charts, as it did after the August plunge, it will likely be sufficient to substantially alleviate the current extremely oversold condition and so create the conditions for the full-on crash phase, which means that it is likely to rally at least to the resistance in the 1980 – 2000 area shown on the 2-year chart for the S&P500 index, and it could even make it all the way back up to the Dome boundary again, although this is considered highly unlikely, the reason being that we are not looking for symmetry on the way down - since markets drop on average twice as fast in bearmarkets as they rise in bull markets, the market should not keep rising up to the Dome boundary on rallies, certainly not after it breaks down from the Head-and-Shoulders top.
So, the relief rally should take the S&P500 index somewhere into the red box shown on our chart, probably to the resistance level, but perhaps a little higher or lower. We will be watching in an effort to gauge where it is going to stop, which is where we will ditch any short-term long trades and pile on the shorts again.
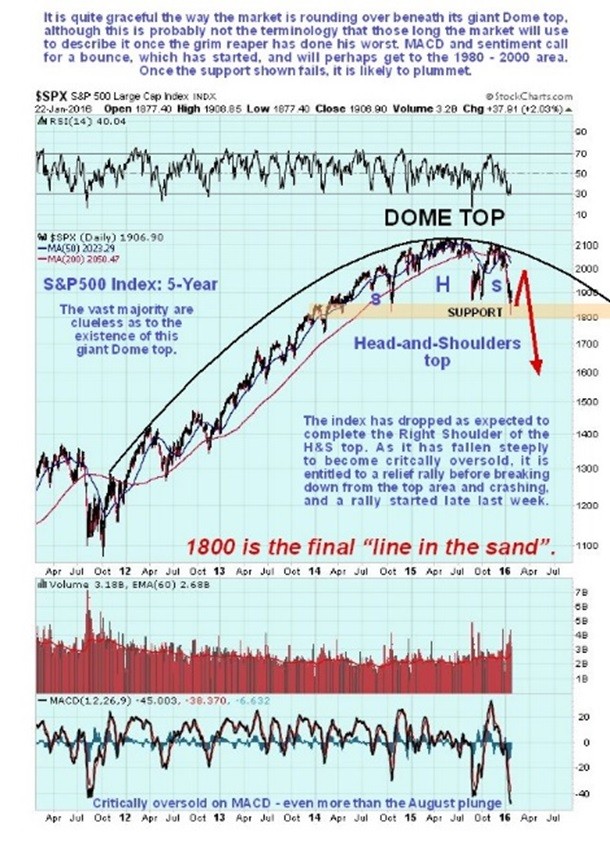
The longer-term 5-year chart provides more perspective and enables us to see the origin point of the Dome top and better appreciate the downside risk should the support at the lower boundary of the Head-and-Shoulders fail in due course as expected. Actually, you need to go back a lot further than this to understand just how far this market can drop, which is better understood on the long-term chart for the Dow Jones Industrials shown below which goes back to 1980. This chart gives a downside target in the 5,500 area (it’s now at almost 17,000), achievable within a year or so, which might seem incredible to many, but is certainly well within the bounds of possibility, as this chart makes plain, and if ever the conditions existed for such a devastating decline, it’s now. This means that the market should lose two-thirds of its value. Note that the Dow Jones Industrials are used in preference to our normal S&P500 index here because they fit the Bullhorn pattern better.
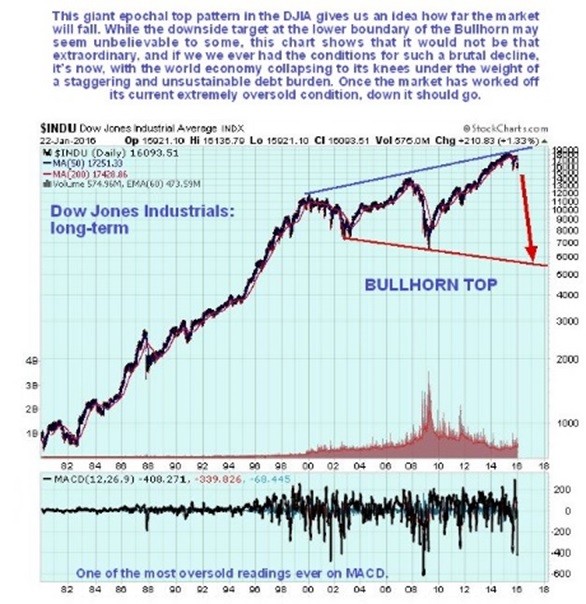
Remember that we are at the end of an era, with the entire debt-wracked Ponzi scheme that the world economy has now become set to go down in a ball of flames like the Hindenburg, a reset that will involve unprecedented devastation including wars and revolutions, yet from an evolutionary standpoint is an absolute necessity. Fiscal restraint and discipline, having been abandoned for decades now, will be imposed by force, the force of the markets, and discredited Keynesian economics will be consigned to the garbage can of history where it belongs, and some sort of gold standard re-introduced.
********
Courtesy of Courtesy of http://www.clivemaund.com

Clive P. Maund’s interest in markets started when, as an aimless youth searching for direction in his mid-20’s, he inherited some money. Unfortunately it was not enough to live a utopian lifestyle as a playboy or retire very young. Therefore on the advice of his brother, he bought a load of British Petroleum stock, which promptly went up 20% in the space of a few weeks. Clive sold them at the top…which really fired his imagination. The prospect of being able to buy securities and sell them later at a higher price, and make money for doing little or no work was most attractive – and so the quest began, especially as he had been further stoked up by watching from the sidelines with a mixture of fascination and envy as fortunes were made in the roaring gold and silver bull market of the late 70’s.
Clive furthered his education in Technical Analysis or charting by ordering various good books from the US and by applying what he learned at work on an everyday basis. He also obtained the UK Society of Technical Analysts’ Diploma.
The years following 2005 saw the boom phase of the Gold and Silver bull market, until they peaked in late 2011. While there is ongoing debate about whether that was the final high, it is not believed to be because of the continuing global debasement of fiat currency. The bear market since 2011 is viewed as being very similar to the 2-year reaction in the mid-70’s, which was preceded by a powerful advance and was followed by a gigantic parabolic price ramp. Moreover, Precious Metals should come back into their own when the various asset bubbles elsewhere burst, which looks set to happen anytime soon.
Visit Clive at his website: CliveMaund.com


