The Coming Stock Market Crash


Let’s zone in on the pattern shown below. The entire purpose of the study of technical analysis is to read what the market is telling us about its future. The stock market is the accumulation of all knowledge by everyone on the planet. In addition to this knowledge, buy and sell action is determined by the group psychology of investors at any given point in time. What will the collective next bet be for stock prices? Are investors fearful? Are they greedy? The incredible reality is, bizarrely, that the stock market knows where the next collective bet will be, and not only knows it, but communicates this knowledge to those who understand the language of the market. This is where pattern studies come into play, more so than Elliott Waves, momentum measures, contrarian indicators, or other bodies of technical or fundamental economic analysis.

Patterns are pure market language, in pictorial form, telling us what is coming in the future, not only the direction of prices, but the extent of that coming move. What is particularly useful is when patterns identify an inflection point, a place where a key reversal is likely, and not only that, but tell us how far that reversal in trend will take prices. One such pattern, which in my opinion is one of the most accurate and reliable of patterns, one of the clearest communication statements from the markets, is the Megaphone Top pattern, which is also known as the Broadening Wedge, or what I dub the “Jaws of Death” pattern because it looks like the open jaws of a shark about to devour its prey.
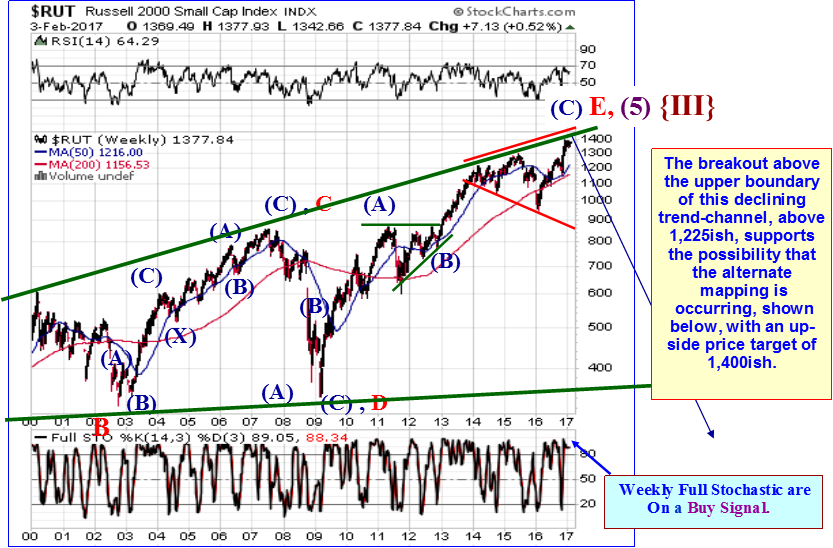
So with this introduction and reminder to many, let us take a good look at the pattern shown above for the small cap Russell 2000. There is not a more perfect topping pattern than what the real-time pricing for small caps has formed over the past four years. This megaphone top belongs in a textbook. If you decide to write a tome on technical analysis, this belongs in it. The rising and declining trend-lines that connect tops and bottoms have the precise same slope. Precise. Wow. The upward boundary line has three perfect touches, the first two that were reversal points, and the bottom declining boundary line for the pattern has two perfect touches, which also were reversal points. This pattern has the required precise five subwaves, each consisting of three waves, also as required.
What is the market telling us with this perfect price pattern? What does the collective group of investors do after this pattern completes? What do prices do after the fifth and final touch point reaches the upper boundary? What is the collective psyche of investors in small cap stocks at this moment in history? The stock market is telling us what is coming next to small caps. It is telling us several things:
First, that the pattern is nearly complete or is complete, as there has been a fifth wave touch of the rising upper boundary. Prices can rise one more time to that boundary line or crawl along it for a short while, but this pattern is just about finished.
Second, the rally from early 2016 is toast. It is just about over or is over. Maybe the top hangs around another few months, but here in 2017 there is going to be a trend reversal in small cap prices to the downside.
Third, the coming trend reversal down is going to be very significant. A crash is coming to small caps. This patterns predicts that once it finishes, the collective psyche of investors is to dump stocks with both hands. Now, worse for the present case, this is a very large price pattern, and that means the spread between the upper and lower boundaries, because they are expanding, has become huge. Typically, the reversal decline takes prices from the top boundary to the bottom boundary. In the present case, the stock market is telling us small caps are going to decline from 1,400ish to 700ish.
Fourth, if the length of time for the coming decline is similar to the time each component wave of the pattern took, it means small caps could drop 700 points over a one year period of time.
Fifth, even worse, should prices drop below the bottom boundary, below 700, the odds increase that after a corrective bounce, they will head far below 700, far below.
Now, continuing with our pattern analysis for the Russell 2000, if we look at a different pattern for small caps, shown below, we see that this Megaphone top pattern is a small concluding pattern within a much larger Ascending Expanding Wedge pattern that is two decades old. This big picture pattern for the Russell 2000 small cap index is also finishing its fifth and final wave now! It is also a textbook perfect pattern. It is warning that small caps could be headed below 400 from their present 1400ish level.
Look, I am not making this up, I am not dreaming up these patterns, I did not invent technical analysis. These are highly reliable, time-tested, documented patterns expressing the future for stock prices by the market itself. Now, if small caps are about to experience this sort of carnage, do we really think blue chips and techs are going to skate? Don’t think so. The proof?
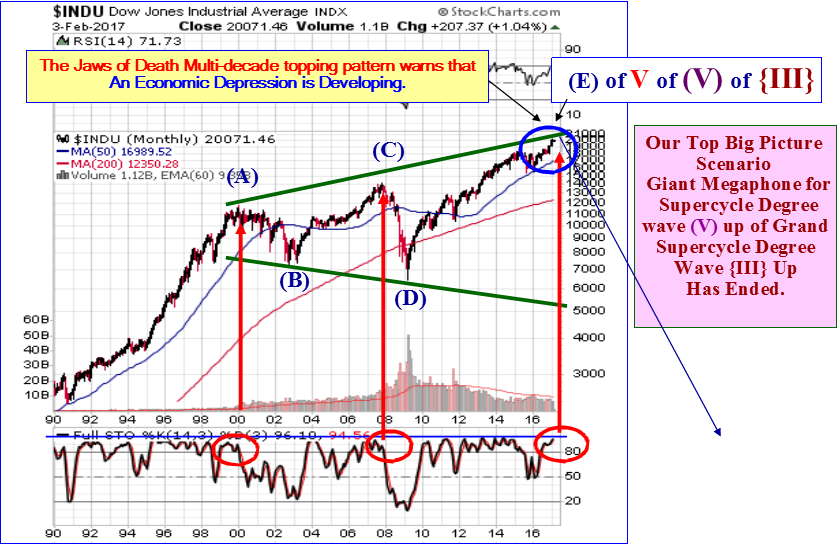
Take a look at this next chart. This is not noise, this pattern has not failed, it is a multi-decade pattern for blue chip stocks, a huge Megaphone top pattern, also picture perfect, textbook, and concluding. Because this pattern has developed over such a long period of time, its finality, its coming reversal down, is hard to pinpoint precisely from the pattern. Prices have chosen to crawl a bit to their final top, but this pattern is the stock market offering a similar forecast for prices as the small cap pattern is. A massive trend turn down is coming. Precisely when is not being told, but it could be any minute or start within months or possibly a year. But this reversal that is forecast will be catastrophic and is coming according to the stock market itself. The concluding Megaphone Top pattern in small caps gives us insight that the stock market reversal is very likely to begin this year, in 2017.
What in the world could cause this sort of catastrophic plunge in the stock market? And of course, with such a collapse will come a devastating hit to U.S. and world economies. What could cause this?
We don’t know, it is all speculation, but any such speculation must answer the question, what events will be so fearful that markets plunge? War comes to mind, but maybe something else, maybe a series of unfortunate events cascading like a pandemic. There certainly is a major values war going on right now between nationalist capitalists and global socialists. This could get worse perhaps.
I truly wish I could say we should ignore these patterns, that they are fiction, not real, and everything is going to be just fine, but these awful patterns are sitting there, hidden in plain view so to speak.
********
At www.technicalindicatorindex.com we have developed proprietary key trend-finder indicators and also track and identify high probability starts and conclusions of trends for our subscribers. Any trading program is only as good as the entry and exit indicators used.
Get a FREE 30 Day Trial Subscription to receive our Daily and Weekend U.S. and International Market Forecast Reports at www.technicalindicatorindex.com Simply click on the button at the upper right of the home page. We cover stock markets and Gold daily and have Buy / Sell signals. We also offer a Platinum Trading service. Email us at [email protected] for information on that program.
When did Noah build the ark? Before it rained. Well, it is starting to rain. We believe it is now time to make sure our arks are built and can float. We can help you at www.technicalindicatorindex.com with our daily and weekend market updates, or conservative portfolio model, and Platinum educational Trading program.
Do not be satisfied hearing what the market did; learn how to predict what the market is going to do. Join us at www.technicalindicatorindex.com as we study the language of the markets. Markets tell where they are headed. Technical Analysis is the science where we learn and apply the forecasting language of the markets.
Dr. McHugh’s book, “The Coming Economic Ice Age, Five Steps to Survive and Prosper,” is available at amazon.com at http://tinyurl.com/lypv47v
Robert McHugh Ph.D. is President and CEO of Main Line Investors, Inc., a registered investment advisor in the Commonwealth of Pennsylvania, and can be reached at www.technicalindicatorindex.com. The statements, opinions, buy and sell signals, and analyses presented in this newsletter are provided as a general information and education service only. Opinions, estimates, buy and sell signals, and probabilities expressed herein constitute the judgment of the author as of the date indicated and are subject to change without notice. Nothing contained in this newsletter is intended to be, nor shall it be construed as, investment advice, nor is it to be relied upon in making any investment or other decision. Prior to making any investment decision, you are advised to consult with your broker, investment advisor or other appropriate tax or financial professional to determine the suitability of any investment. Neither Main Line Investors, Inc. nor Robert D. McHugh, Jr., Ph.D. Editor shall be responsible or have any liability for investment decisions based upon, or the results obtained from, the information provided. Copyright 2017, Main Line Investors, Inc. All Rights Reserved.


