Comparing the Barron’s Gold Mining Index with the Dow Jones / 1920 to 2023


Last week ended with a very strong advance on Friday. I was hoping there would be some follow through this week on last Friday’s advance, but that wasn’t to be. Still, the Dow Jones gained 114 points (0.34%) from last week, and that is better than a big decline.
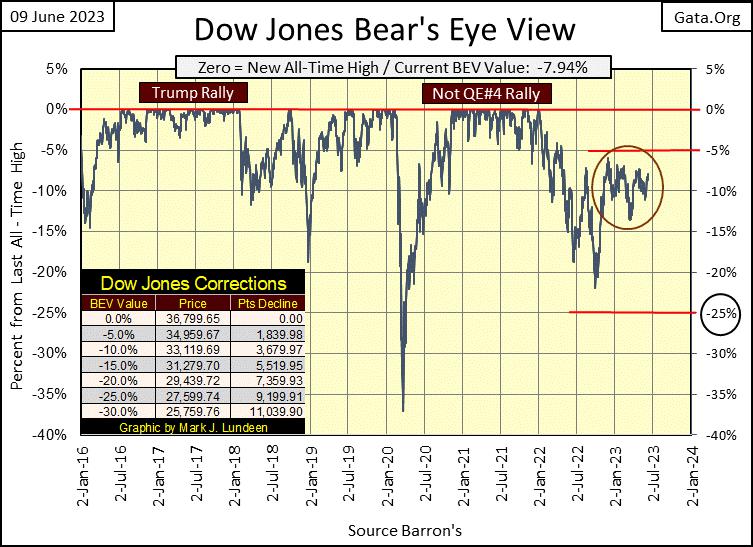
The problem the bulls are having can be seen in the BEV chart below; since last October, the Dow Jones has traded within the circle. This is now seven months with the Dow Jones refusing to break below its BEV -15% line, but lacking the ability to break above its BEV -5% line, and so advance into scoring position. The longer this goes on, the more likely it is the Dow Jones next move will be to the downside, below its BEV -15% line.
So goes my opinion on the Dow Jones at the close of this week. But my opinions are not written on stone, and so can change very quickly. In the chart below, a close of -4.99%, or better in scoring position, and I’ll once again be willing to think of the Dow Jones in terms of new all-time highs. But the bulls have been waiting for seven months now. What is the problem?
I can think of three problems; 1) the yield curve since last November has been inverted, 2) the idiots at the FOMC continue with their QT, 3) and bond yields continue creeping ever higher. These are not small obstacles the bulls must overcome before the Dow Jones once again is generating new BEV Zeros in the chart above.
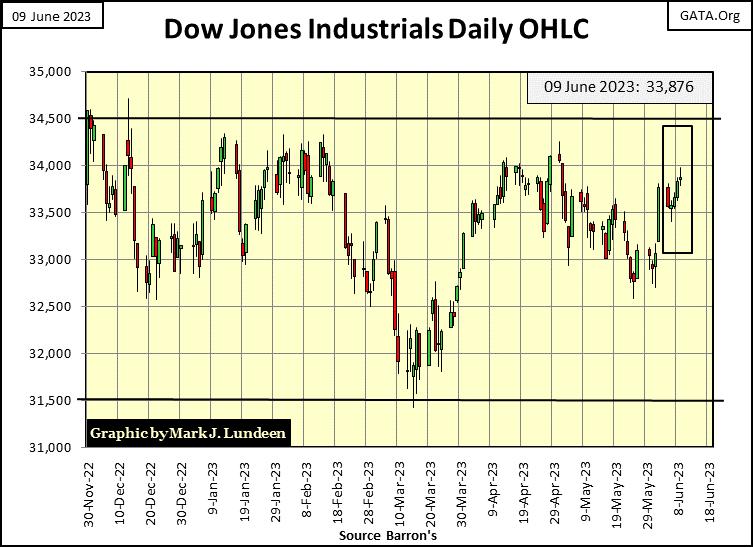
Here is the Dow Jones in daily bars, going back to last November, the beginning of our current stagnation in the market. For the bulls to get something done, first they must get the Dow Jones to close above 34,500, then second, they must keep it there. Since last November they’ve come close to doing that a few times, but something happens to pull the Dow Jones back below this critical level.
Here is my table listing the BEV values for the major market indexes I follow. At week’s close, once again none of them are in scoring position, a BEV of -4.99% or less, and it’s been that way for many months now. Like the Dow Jones above, each has been trading within a trading range, just further from their last all-time high than the Dow Jones has.
The NASDAQ Banks (#20) is attempting to close above its BEV -40% line. In the weeks to come it may just do that. No matter, the banks in this country have problems that will not be easy to fix. Their reserves of bonds have greatly deflated as bond yields began rising in January 2020, and they’ve lent lots of money to people, and companies that will have problems paying them back should the economy enter a recession.
What about the XAU closing the week with a BEV of -45.89%? The big difference between the XAU and the NASDAQ Banks, is the NASDAQ Banks saw their BEV of something over -40% by deflating from their last all-time high of November 2021. In other words; the NASDAQ Banks lost over 40% of their market valuation.
It’s totally different for the XAU’s BEV of something over -40%. It’s trading with a BEV of -40% by advancing off a BEV -85% seen in January 2016.
Unlike the banks, the XAU doesn’t have much, if any hot-money in it from hedge funds, or investments from widows and orphans, money that will exit from the sector faster than it came in, with the next major sell off in the market. For the next sell off, I expect the gold and silver miners will prove to be the place be.
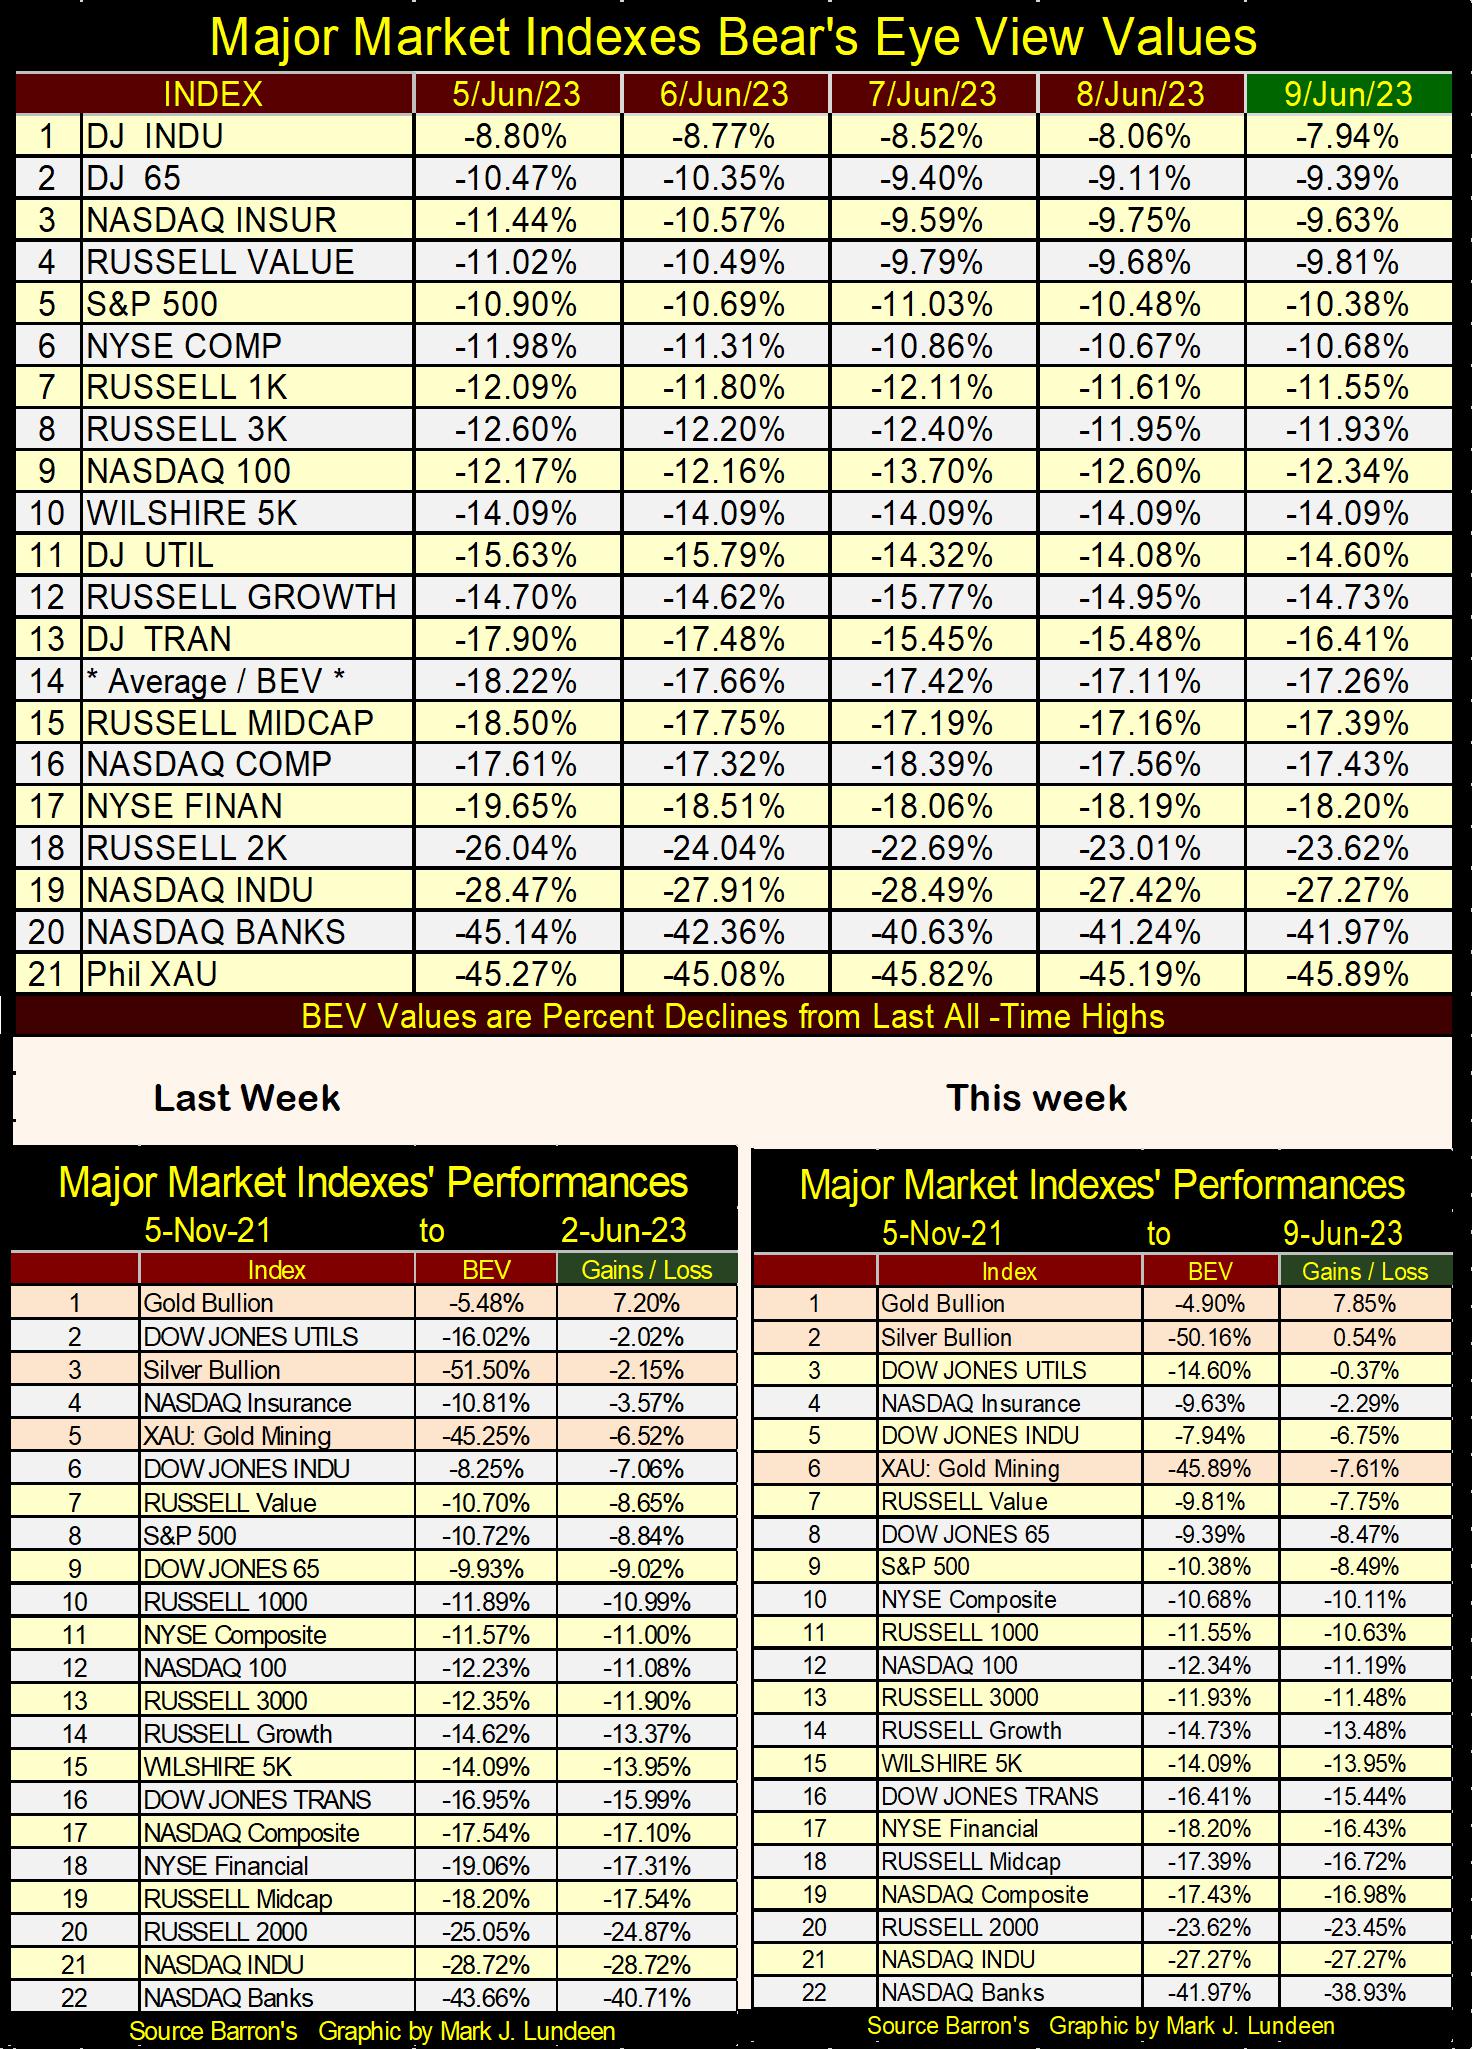
In the performance tables above, this week gold and silver took the top two spots, but the XAU dropped from #5 to #6 from last week. When looking at these major stock indexes only in BEV terms, as in the top table in the above graphic, the NASDAQ Banks are doing better than the XAU. But these performance tables are based on the first week of November 2021, when most of these indexes were making new all-time highs.
That is why I picked this week in November 2021; it was a market top for these indexes as a group. And since that top from a year and a half ago, we’ve seen how the mighty have fallen. The NASDAQ Banks is the top loser, at weeks close it was down by 39.93% from November 2021, while the XAU is down by only 7.61% from a year and a half ago. Much better than the glamor issues from yesteryear found trading today at the NASDAQ.
Let’s look at the gold miners from a historical perspective. Below are two Bear’s Eye View (BEV) charts, one for the BGMI, the other for the Dow Jones. As the Bear’s Eye View compresses price data within a scale of only 100 possible percentage points, with each 0.0% a new all-time high, and -100.0% a total wipeout in valuation, it’s possible to directly compare the last 102 years of weekly performance data for the BGMI with the Dow Jones.
First the BGMI; in 1925 it deflated to its BEV -60% line, which proved to be bottom for the next thirteen years, as these two gold mining companies in the BGMI (Homestake Mining & Alaska Juneau Gold), totally ignored the Great Depression Crash.
Like everything else in the stock market, the BGMI saw a bottom in the first half of 1942, then began an advance that terminated in early 1968. After a few years, and two corrections (60% & 70%) in valuation later, the BGMI went on to its bull market highs of October 1980 (1285). Unfortunately, for the past forty-three years, the BGMI has seen more action to the down, than to the upside. Its last all-time high was in Barron’s 11 April 2011 issue (1635), only 27.2% above its highs of October 1980.
Visually, Barron’s Gold Mining Index’s BEV chart is divided by the August 1971 dollar’s decoupling from the $35 gold peg. Since August 1971, it’s made very few new BEV Zeros (0.0% / new all-time highs), but has endured massive declines from those all-time highs. The deepest decline in the past 103 years was seen at the bottom of the 2011-2016 bear market (Red Circle), where the BGMI, like the XAU, deflated below its BEV -85% line in the chart below.
As I see it, because the current rebound is off a massive 85% bottom, the BGMI is on solid ground, as there is little speculative money to be found in the gold and silver mining sector following such a massive decline in valuation. That is how it will stay until the BGMI once again is making regular BEV Zeros, as it did before August 1971. But will it? I’m thinking it will.
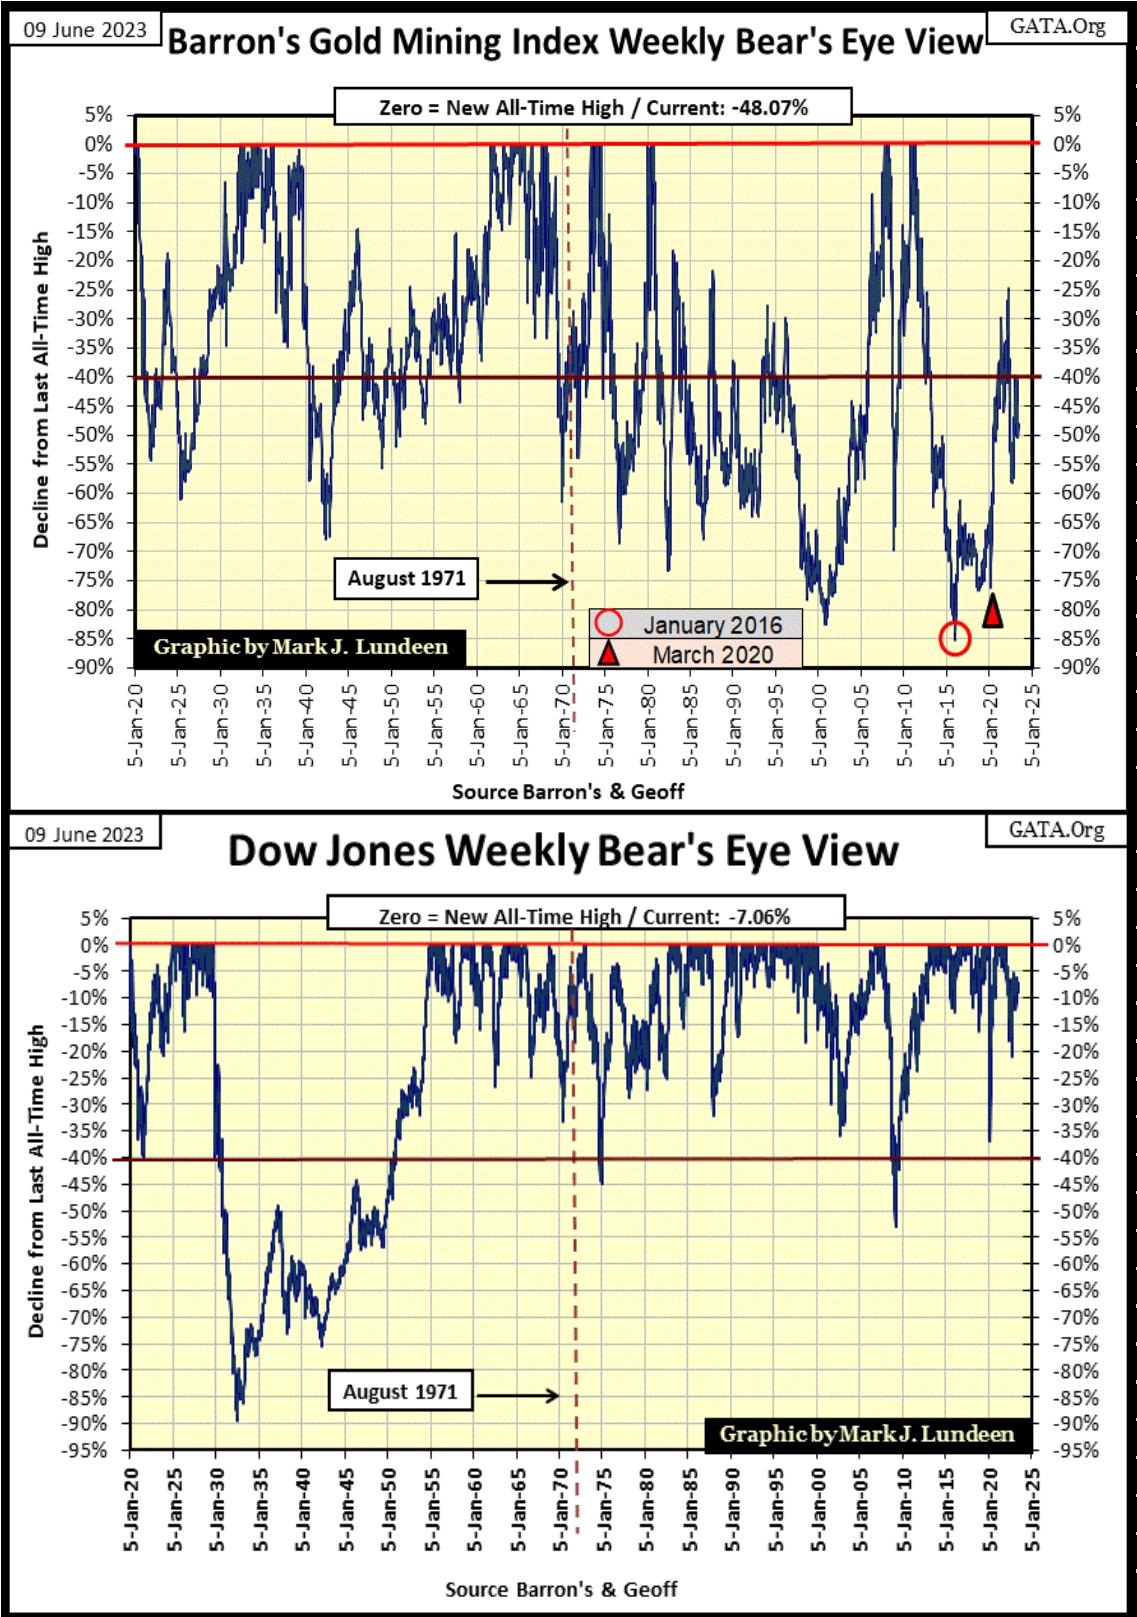
The Dow Jones’ BEV chart above is a completely different story. Except for the Great Depression 89% market crash, it has corrected below its BEV -40% line only twice since 1950, as it provided investors with hundreds of new BEV Zeros.
Using the weekly closing data seen plotted in the BEV charts above, here are two frequency distribution tables for these two market-series. Since 1920, there have been 5,397 weekly closes, with the Dow Jones seeing 551 weekly closes at new all-time highs, while the BGMI has seen only 157 new all-time highs during this same period, with most of those occurring before August 1971.
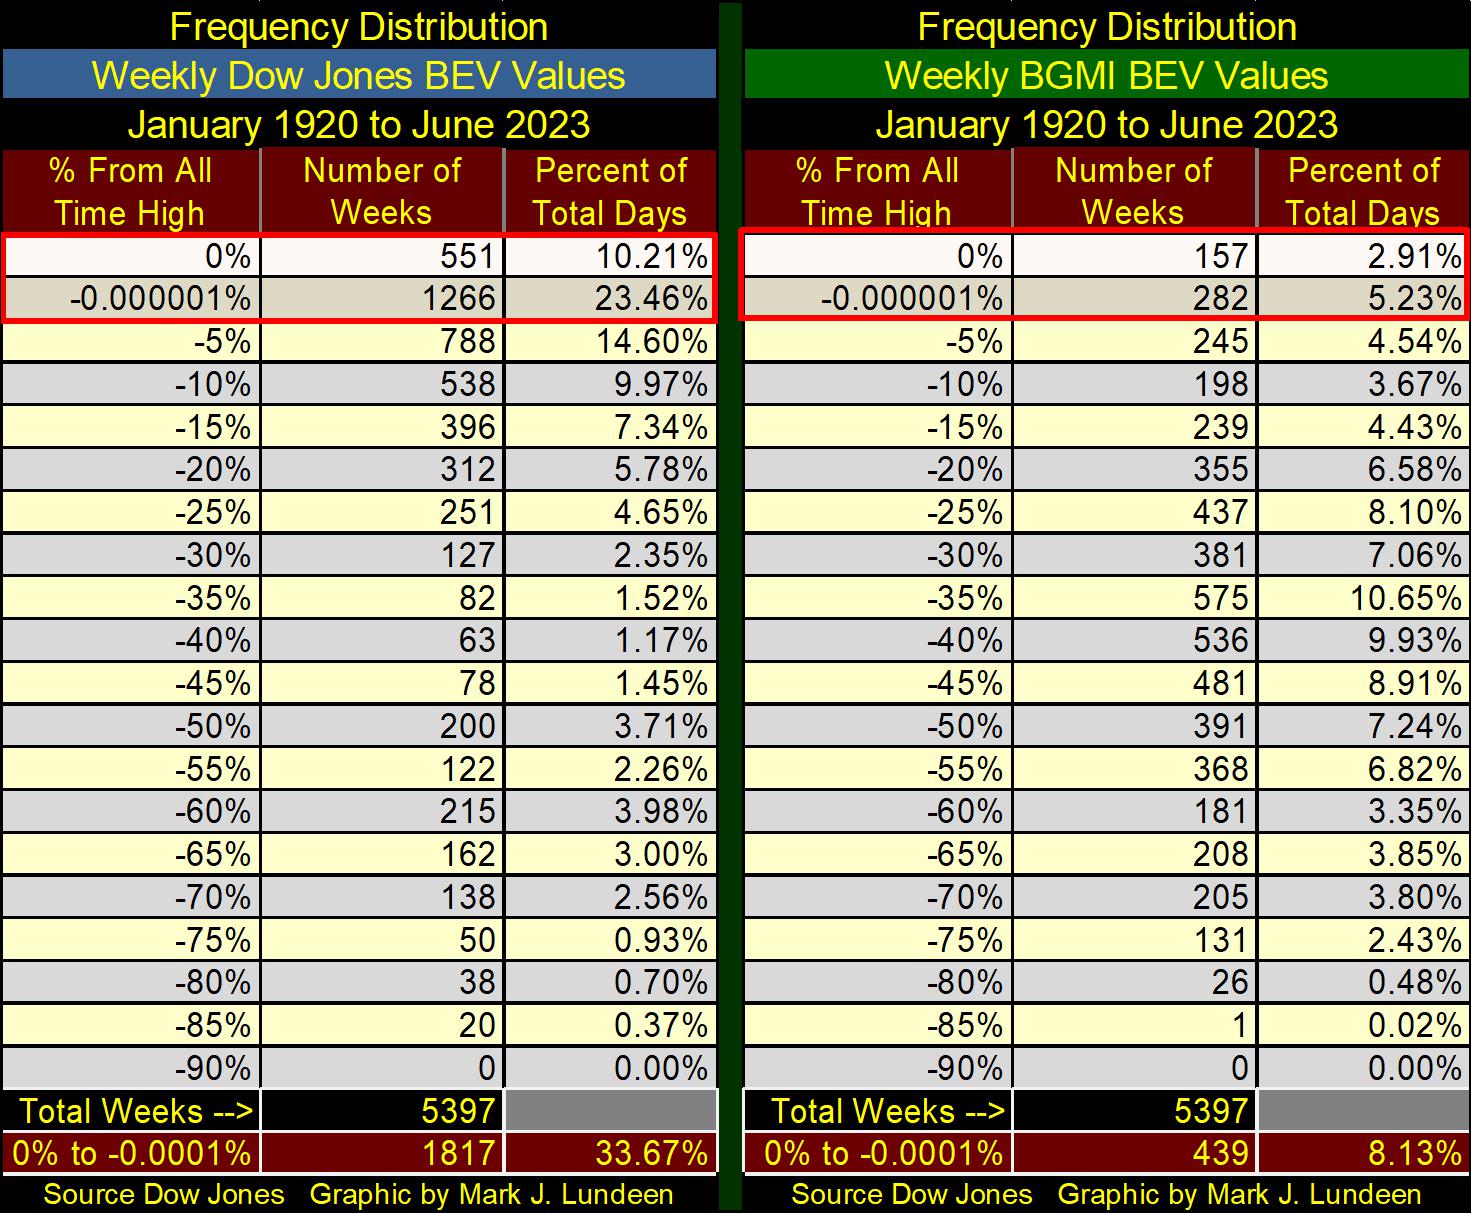
To best see the difference between these two market-series, we compare how many new all-time highs (BEV 0.0%) & weekly closes in scoring position (-0.00001%) they have seen since January 1920 (bottom of table). The Dow Jones has closed at a new all-time high, or BEVs between -0.01% to -4.99% (scoring position) for 33.67% of the 5397 weekly closes, or one week out of three for the past 103 years. The BGMI has closed at a new all-time high, or in scoring position for only 8.13% of its weekly closings since January 1920, about one week out of twelve.
That being the case, why should anyone risk their money gold mining? Because the superior performance of the Dow Jones over the BGMI is the result of decades of market manipulation, where the Federal Reserve has used the financial markets for a dumping ground for their inflation to contain CPI inflation.
In other words, the Dow Jones / the entire stock market is currently a huge bubble at risk of massive deflation in valuation, because with every boom comes a bust. During bust phase in the market cycle, ingrained habits from the boom phase are eventually abandoned, as capital seeks shelter from deflating market valuations. Historically, gold mining shares have served that function, a safe harbor in a storm, which I believe they will once again when Mr Bear once again makes his presents known on Wall Street.
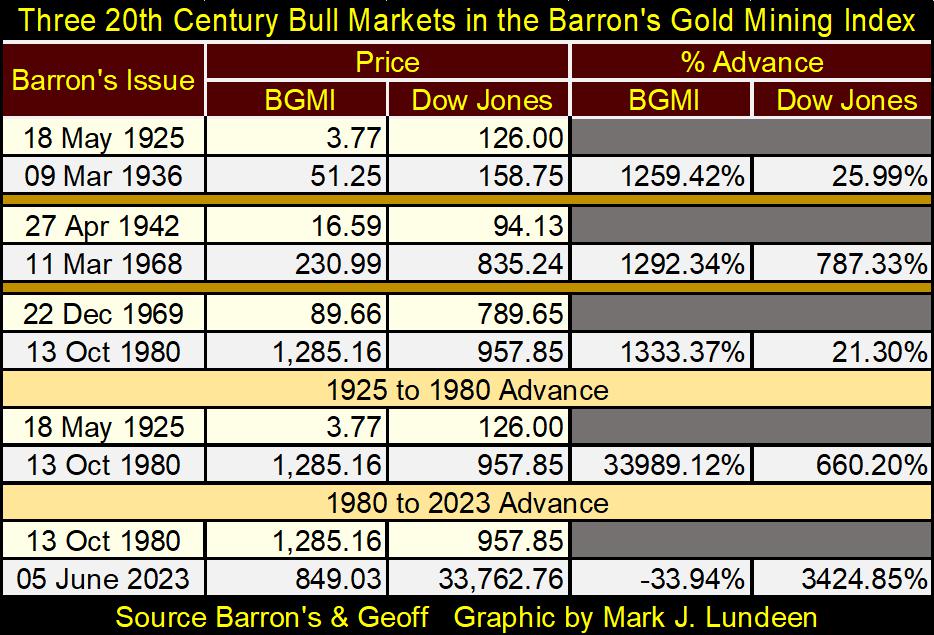
Since 1980, the BGMI hasn’t done much for investors. However before 1980, it saw three excellent bull markets, including one during the Great Depression Crash, the top bull market in the table below. I also included Dow Jones data from the selected issues of Barron’s.
Note; Barron’s didn’t begin publishing BGMI data until 1938. Data from 1920 to 1938 is from Geoff, who was nice enough to collect weekly price data for Homestake Mining from the New York Times from long ago, and sent it to me. Thanks Geoff!
It’s been a while since we’ve looked at earnings for the Dow Jones, so here they are below. Earnings peaked in April 2022 at $1799.96; we’ll call that $1800 over a year ago and have come down by $298.06. We’ll call that a $300 decline in the past thirteen months. That is a reduction in earnings for the Dow Jones by 16.6% in the past year, which by itself doesn’t tell me much about future trends in the market. What would tell us something about the market?
There is plenty of bear sign to be seen, if you’re willing to look for it, so I’m thinking another 21st century financial crisis is coming, #3. The Federal Reserve System has “injected” too much credit (debt) into the economy, creating a situation where everything from corporations to private individuals are only a bad quarter, or a paycheck away from defaulting on their debts.
What a different world we live in from the 1950s, a time where thrift was valued, and assuming debt was something to be avoided. My grandparents went through the Roaring 1920s and the Great Depression, and those twenty years left an impression on them – they avoided debt at all cost.
In the 1920s, credit creation by the Federal Reserve made the economy and stock market roar. The bursting of that credit bubble resulted in the Great Depression, and the depressing 1930s. I was just a kid at the time, the 1950s, a time when children were best seen and not heard. So, I never talked about personal finances with my grandparents, but I know they avoided debt like leprosy. If they couldn’t pay for something in cash, like a new car, they went without and didn’t complain.
My grandparents’ experiences during the great depression weren’t unique. Groucho Marx of the Marx Brothers once said on his TV Program; “You Bet Your Life,” that his children use to ask him why he walked around the house turning off lights. He told them that had they lived through the 1930s, they’d be walking around the house too, turning off lights.
What a different world we live in, one where people run their credit cards to their limits, without a sense of dread keeping the lights on in unoccupied rooms. It used to be said people don’t make the mistakes of their parents, but of their grandparents. I think that is true, so I’m anticipating another depressing decade is coming our way.
The pending crisis will most likely begin in the banking system before it spreads out to the rest of the economy. The last time we had a crisis in the banking system, one that spread out to the broad economy, was during the sub-prime mortgage crisis of 2007-09. Earnings for the Dow Jones went negative during this crisis for only the second time since Dow Jones began publishing statistics for its averages. Should we see Dow Jones earnings go negative for the third time in history below, and we might, that would tell us something about the market.
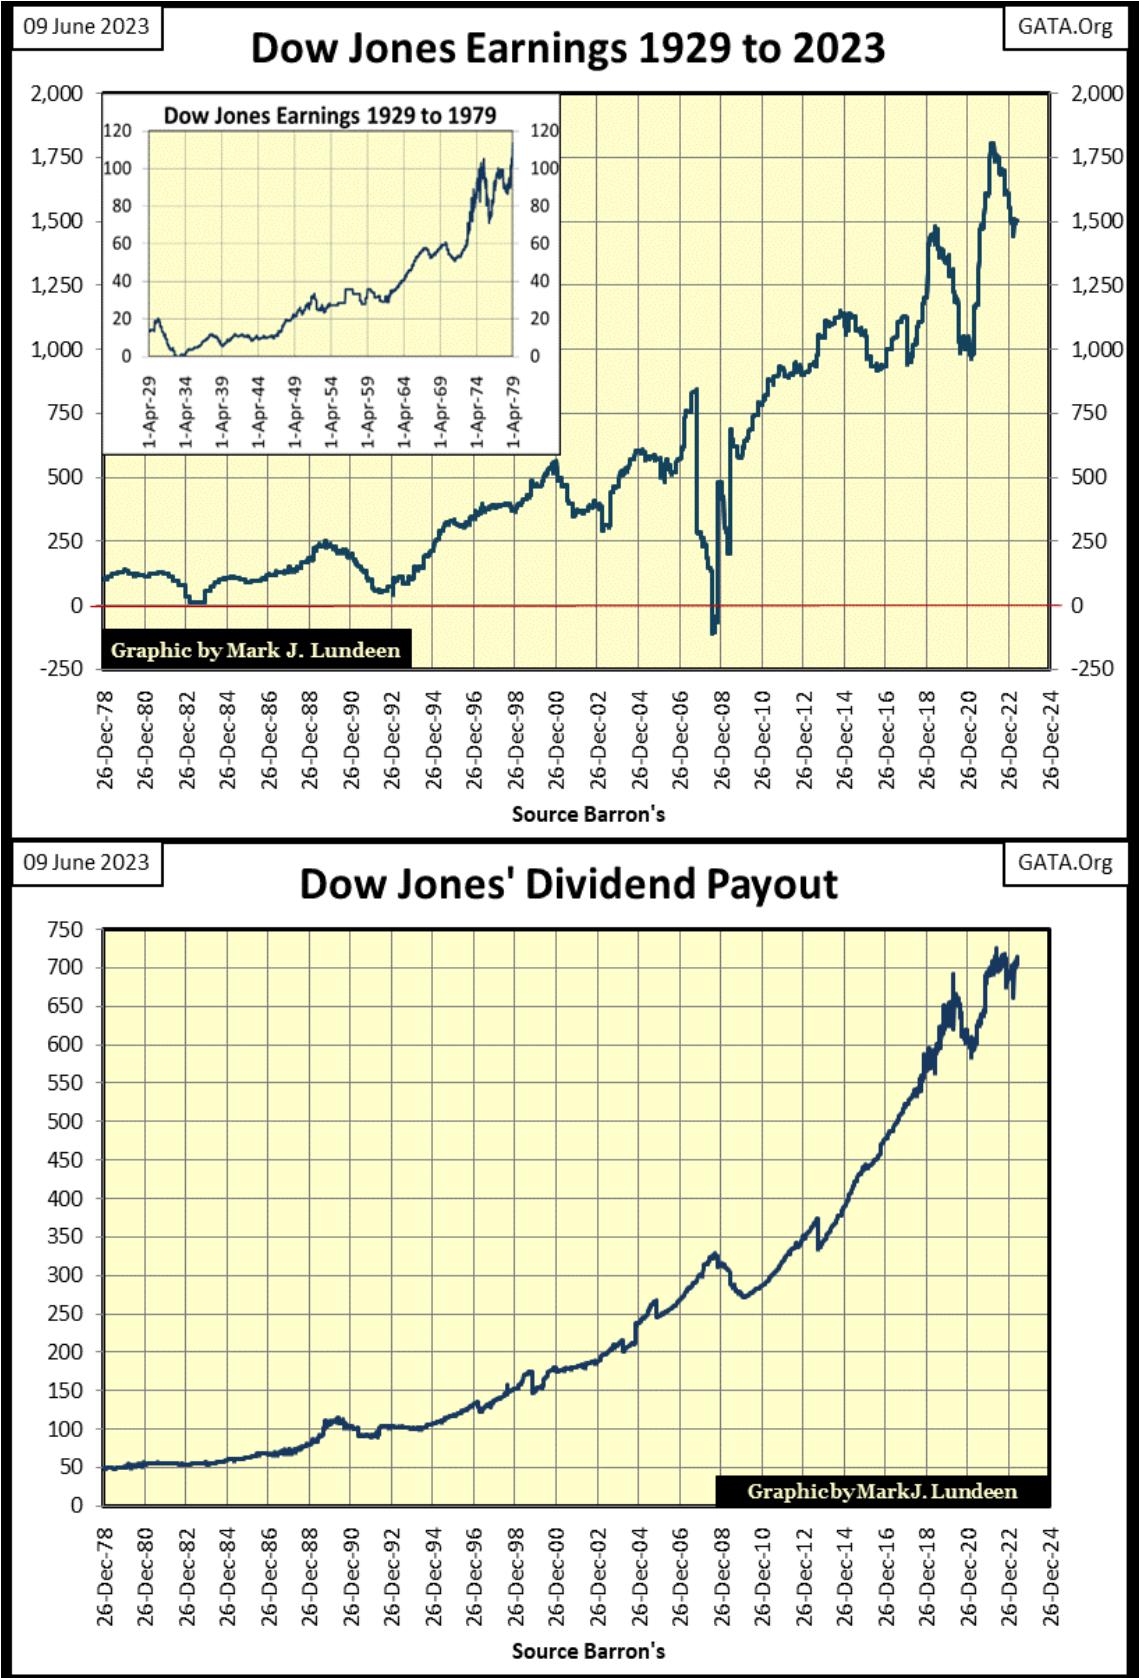
Dow Jones dividend payouts are plotted above. Earnings can be largely fictitious, as they were for Enron and WorldCom, giant frauds that once traded daily at the NYSE twenty years ago. But dividend payouts are different, cash companies send to their owners, the shareholders. That is something that can’t be faked, so I believe dividend payouts are a superior measurement of corporate wealth generation than are earnings.
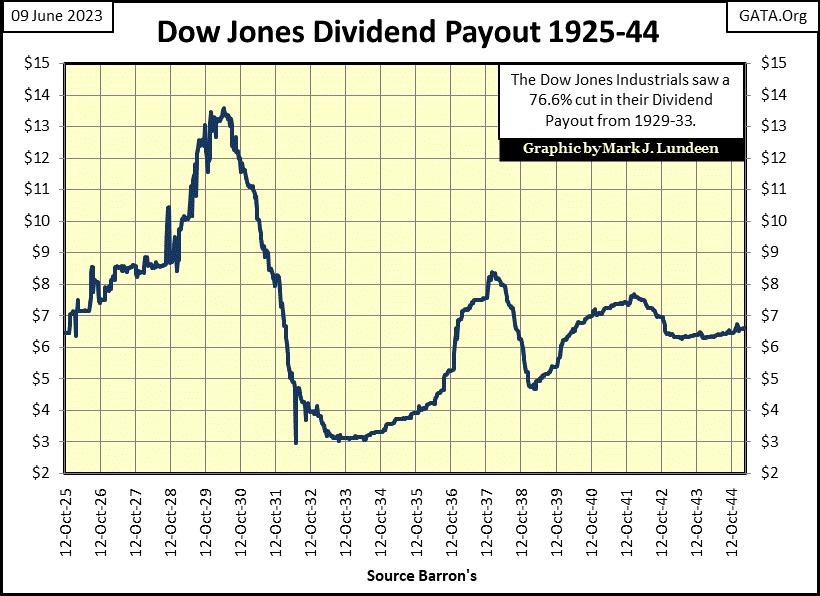
Dividend payouts can be impacted by the economy. During the Great Depression, Dow Jones dividend payouts were cut by 77%, as stressed corporations began cutting cash dividend payouts for lack of profitable business, and chose to use profits instead to service their debts to avoid bankruptcy in the early 1930s.
Unlike earnings, dividend payouts by corporations can’t go negative. They can go to ZERO, even for the Dow Jones, should the heavily indebted corporations in it have to shift cash from dividend payouts, to servicing their massive debt load taken on since the sub-prime mortgage crisis.
Should dividend payouts for the Dow Jones once again begin contracting, as they did in the early 1930s, you’ll know something seriously bad is happening in the stock market. I expect that is exactly what will happen in the next major market meltdown; a big decline in the dividend payout for the Dow Jones.
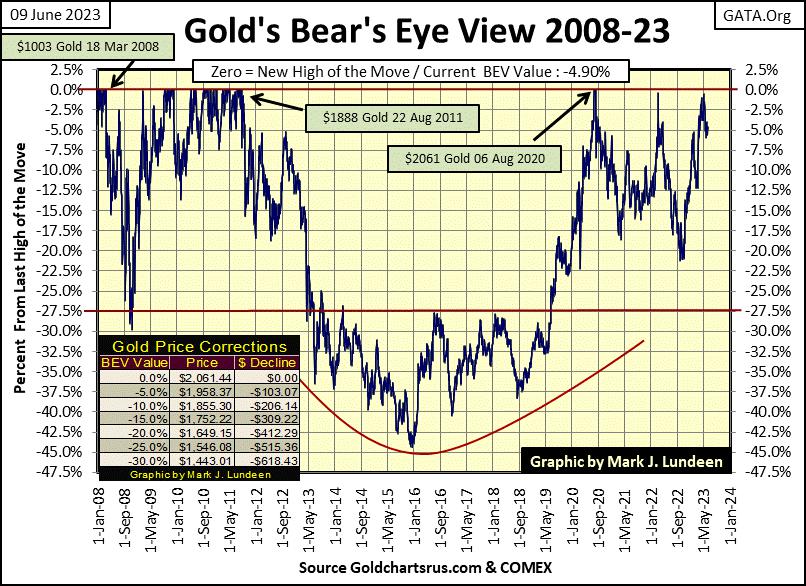
Gold closed the week in scoring position; with a BEV of less than -5.0% (chart below). I like that! Since August 2020, gold has made attempts to make a new all-time high. Gold’s problem is every time it sees a BEV of less than -1.0%, the “policy makers” keep letting the goons loose at the COMEX futures market, selling tons of phantom gold, gold that doesn’t exist to terminate the advance.
This too shall pass, but when? As I see things, we need higher bond yields and more bank defaults before anything is going to change in the gold and silver markets. Give it time, it will happen.
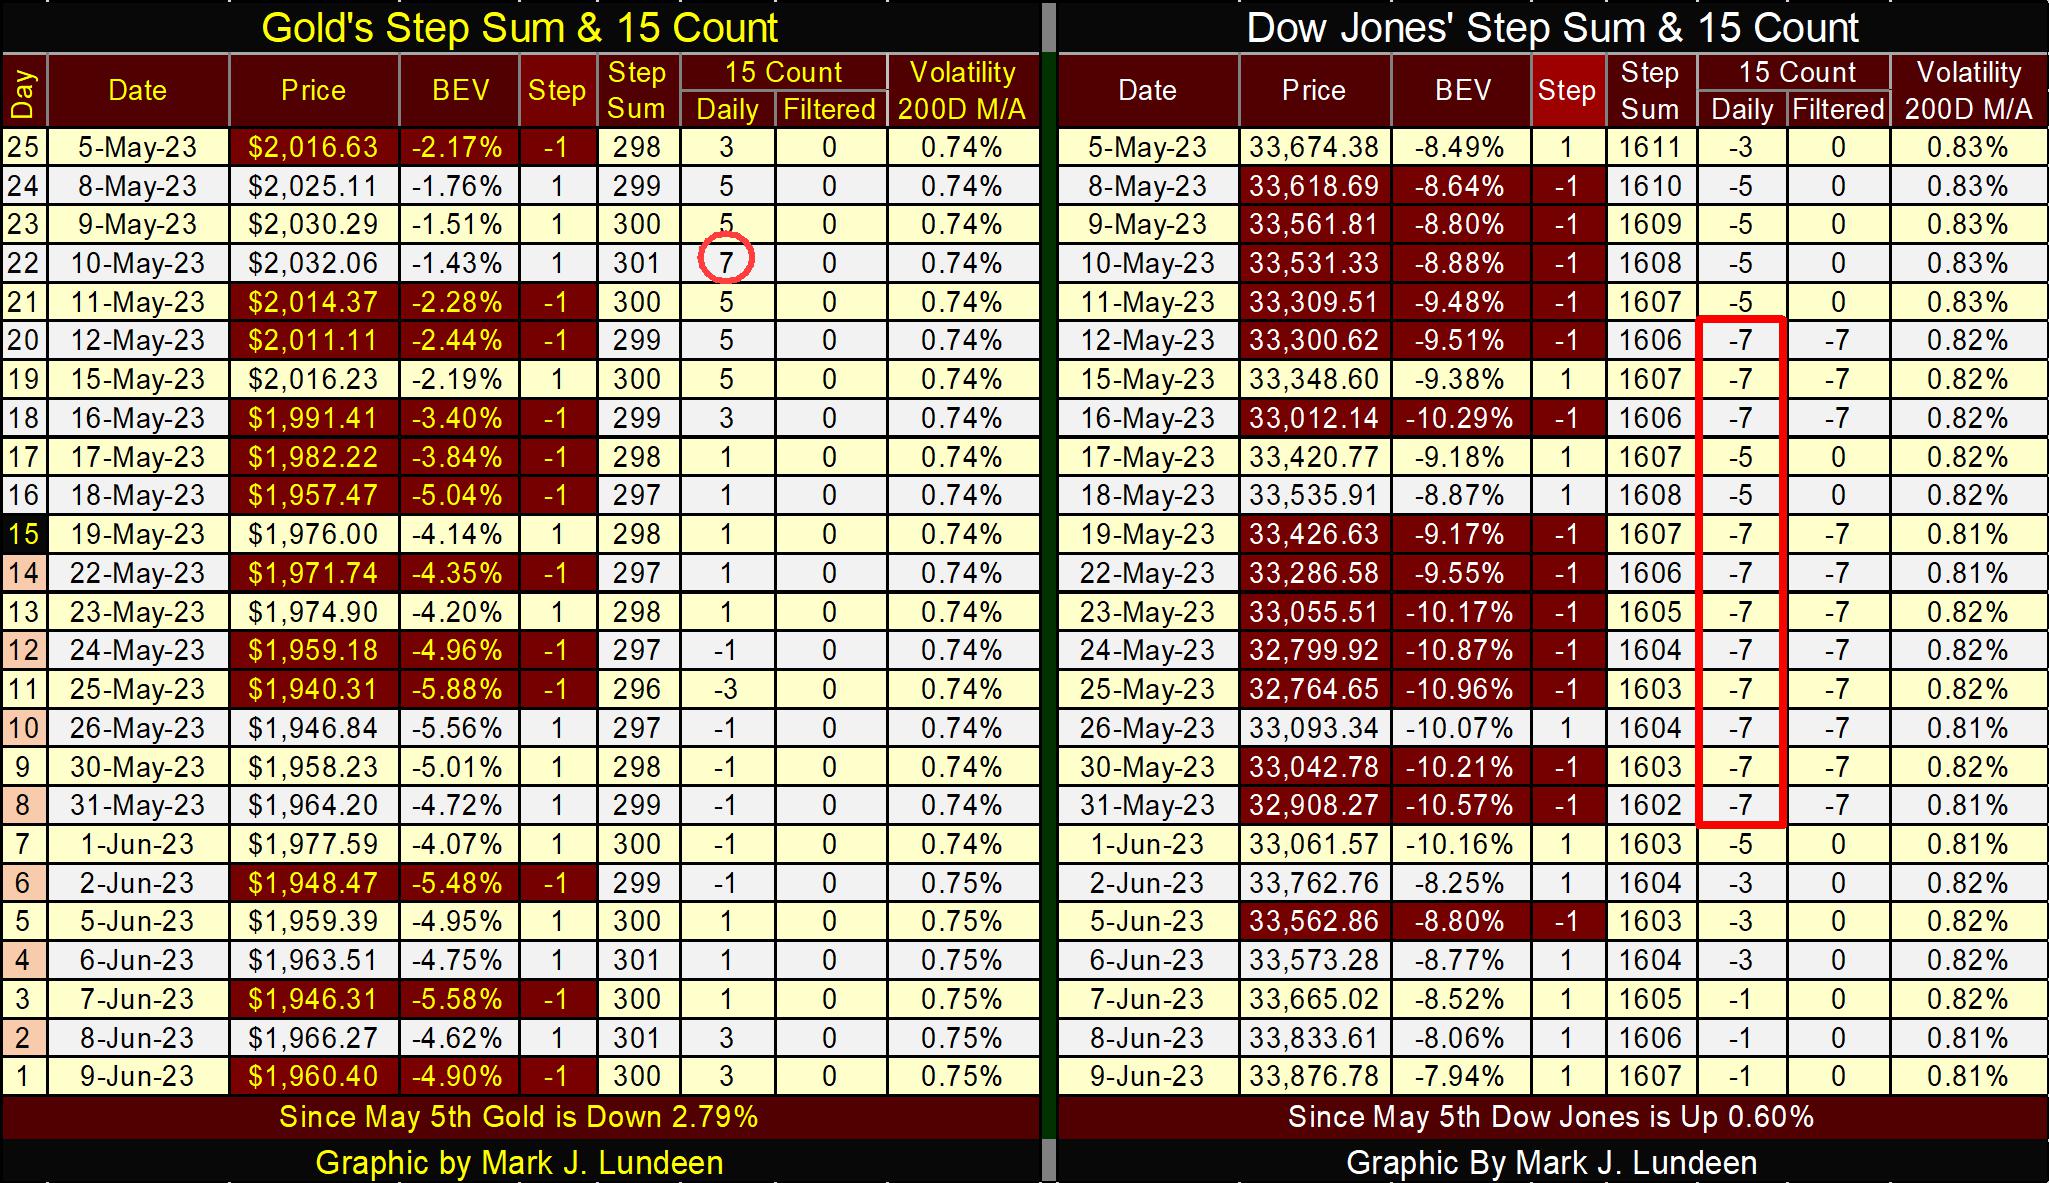
Sorry, but I have to wrap this week’s article up as I have things to do and people to meet that I can’t put off any longer. So, I’m going to post this week’s step sum tables for gold and the Dow Jones without much comment.
Mark J. Lundeen
********


