Confirming The Big Gold Wave Of 2016-2017
 share
share
 share
share
 share
share
 share
share
 share
share
 This article confirms that the current explosive rise of the gold and gold related stocks is in progress. The rise is an extension of the gold bull market that began in year 2000. The last four years are bull market corrections. This gold bull market will rise to unexpected heights in price…but with high volatility by 2020. This is the result of our technical analysis.
Our basic premise is that the market price over a long period of time will reflect all the external forces that affect the investor behavior as a group. Mathematically, the internal cycles of a time series in price allow us to project the future price trajectory in near term.
We show how the simple correlation of various markets can help the investors with asset allocation and unusual investment opportunity.
Next Gold Peak
BGMI Analysis (1940-2015)
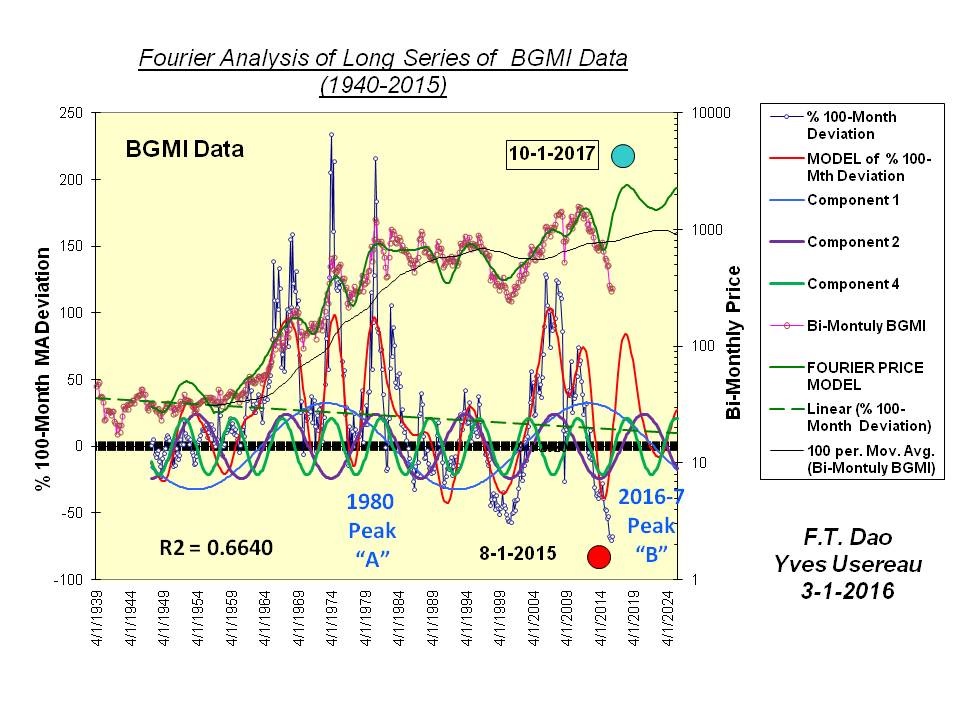
For this 75-year data analysis, we first compressed the weekly BGMI data to a bi-monthly series. The analysis is for illustration purpose.
- The next gold price peak is projected to occur in late October 2017.
- The rise of this peak has already started. The “compression” in 2015 implies that the launch of the next gold peak will be very dramatic.
- A series of validity checks on the timing of the peak were performed by scaling back part of the existing data. The timing of the next gold peak remains stable.
HUI Analysis (1970-2015) Revisited
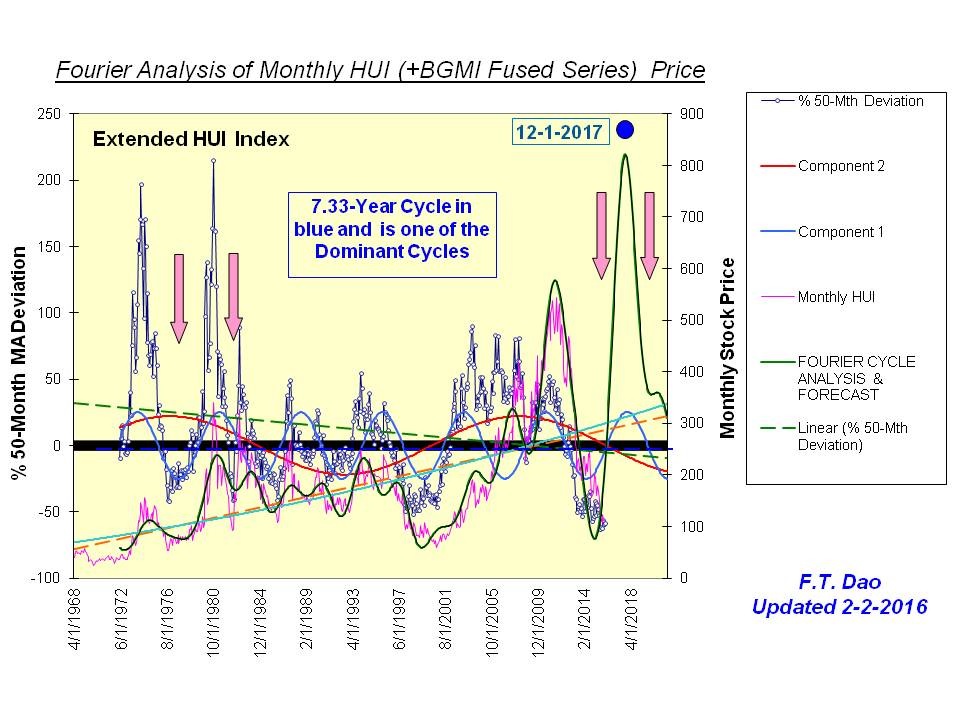
This is an earlier analysis of extended HUI index, which we had reported on this website. The time series data spans 45 years.
- The derived cycle structures for both data sets are very similar.
- For this shorter data set, the most dominant cycle is 7.33 years. For the long 75-year data set, the dominant cycle is 39 years.
Our conclusion is: the current 2016-2017 gold peak resembles the 1980 peak. However, the explosive rise will be more dramatic this time. We believe that both gold peaks are caused by inflation.
The Asset Allocation Syndrome
The concept of asset allocation is well established in portfolio management. In this section, we use simple covariance measurements to illustrate our points:
- The correlation based on covariant metrics of any two asset classes will depend on the time period (when?) and the time duration (how long?) one selects for analysis.
- High correlation of markets may provide special opportunity for big returns, given a multitude of ETF’s, mutual funds and other financial products, including physical gold.
For the following analysis, we used a 150-week interval for computing the covariance metrics.
Gold vs Dow Covariance
The correlation of gold price and Dow index fluctuates with time as shown in the chart. We note:
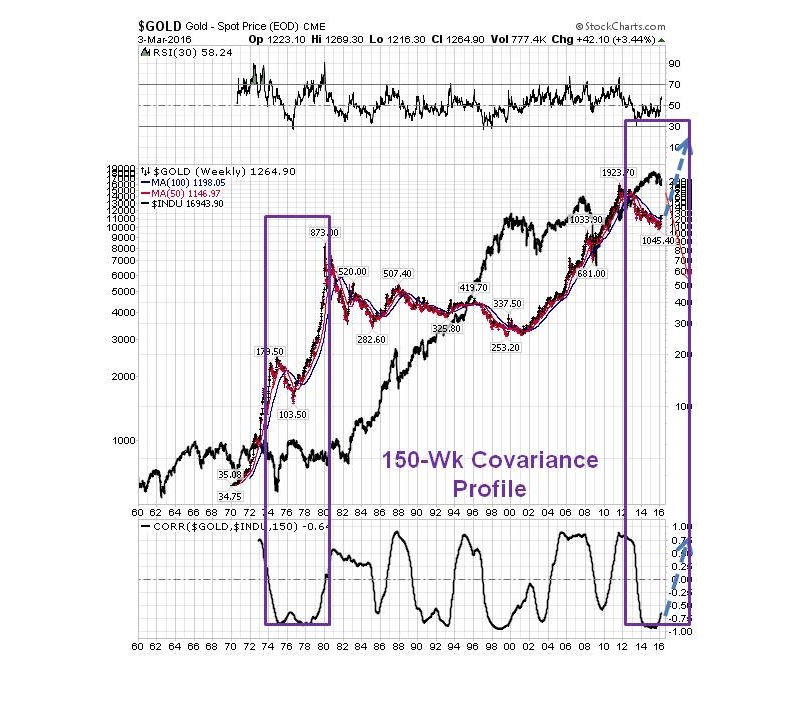
- Gold and Dow are neither correlated nor anti-correlated over time. The covariance metric oscillates with time. The average of the covariance measurements is close to zero. This implies careful selection and analysis needed for proper asset allocation in portfolio management.
- As in individual market prices, covariant metrics for cross markets can also be applied to cycle analysis. A quick analysis of the Gold-Dow covariance showed the projection that this metric will rise and reach its top in 2020. This is similar to the 1980 situation.
Gold And Silver As Twins
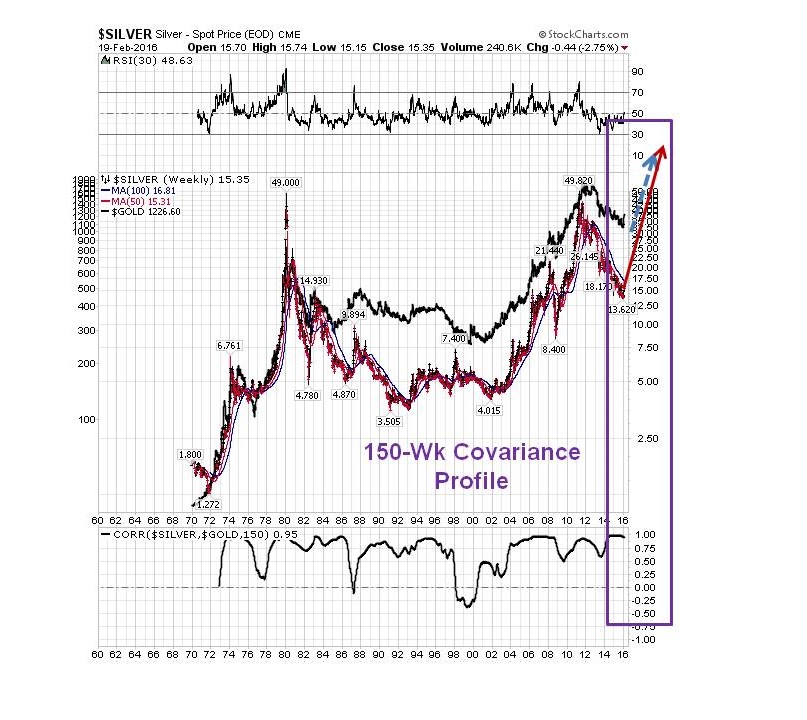
- By contrast gold and silver maintain high correlation throughout the period 1970-2015. The average of the covariance measurements is in high 0.60.
- While he silver bull market will rise together with gold, silver will outperform gold during this period that ends in 2020, and with a higher volatility than gold’s.
Likewise, we expect that silver stocks will outperform gold stocks till around year 2020.
Inflation Expectation
The following chart showed the sign of a potential tide of high inflation. The ratio of 30-year bond vs 10-year bond yields ($TYX vs $TNX) was used as a proxy. Note the recent rise in this ratio value in synchrony with the start of the gold rise. The investors demand higher long term bond yields to protect their investment, anticipating higher inflation to come.
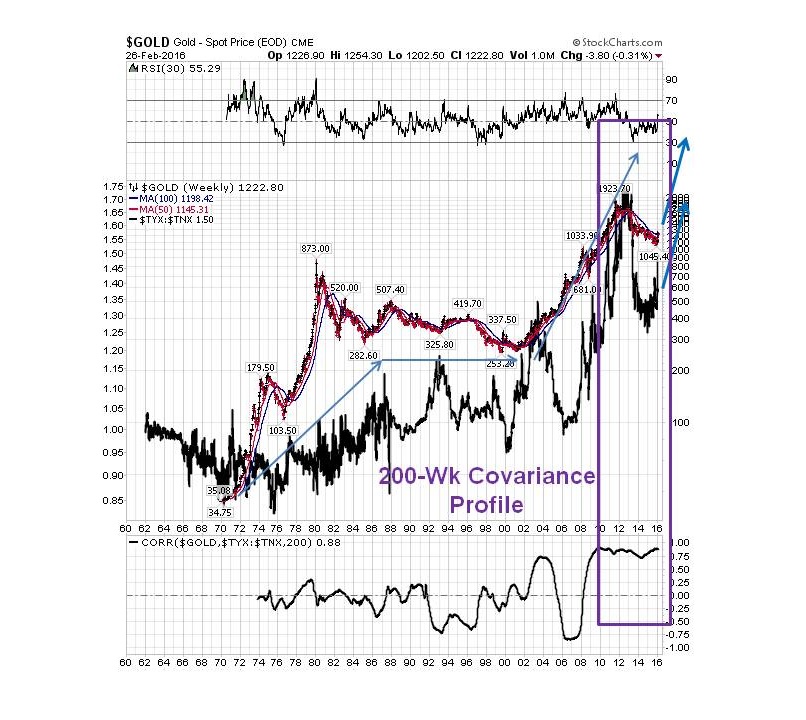
A general note on inflation versus deflation: the various markets shown in this article have risen and fallen over a long period of time. They have gone through and faced different external factors and forces, such deflation and inflation, as well as financial turmoil such manipulation and currency debasement. The investor behavior of greed and fear is captured fully in the market prices. The above chart favors a scenario of high inflation.
Conclusion
Our Fourier cycle analysis presented here has confirmed the development of a rapid rise in the price of gold bull market this year and at least in 2017. Fundamentally, we feel that the Fed’s massive printing press (series of QE’s) not only triggers the current gold price explosion, but also leads to high inflation in this country. One reaps what one has sown. This also applies to our approach to investment. Fresh thinking is needed in asset allocation and in incorporating accurate forecast of various asset classes to achieve optimal return for a given risk tolerance.
share
share
share
share
share


