Copper, Gold, Silver: Already Over the Cliff – Let’s Enjoy the Flight


And the profits that it might bring.
Peak Chaos Confirmed
Yesterday delivered the most spectacular validation of my Peak Chaos theory we've seen yet. While markets braced for maximum disruption from Trump's copper tariff ultimatum and the Fed's potentially dovish pivot, what unfolded instead was a masterclass in why chaos-driven market moves eventually exhaust themselves—and why the USD Index was destined to rally from here.
The copper market just experienced its most violent reversal in decades. Prices plunged over 20% in a single session—the largest daily drop on record—after Trump's supposedly "shocking" tariff announcement turned out to be far more bark than bite. Refined copper, the backbone of international trading, was completely exempted from the 50% tariffs, which will only apply to semi-finished products like pipes and wires.
This wasn't just any commodity selloff. This was the implosion of what Bloomberg called "one of the biggest trades of traders' lifetimes"—the massive rush to stockpile copper in US warehouses ahead of the tariff deadline. The Comex-London premium that had swelled to over 30% evaporated in hours, as the market suddenly realized that Trump's "nuclear option" was actually a precision strike that left the core copper trade flows untouched.
And… do you remember that technicals precede fundamentals? What we saw yesterday is in perfect tune with how copper formed major tops in the past – and in perfect tune with what I’ve been expecting it to do.
Every now and then, I get messages from people saying that the technical analysis no longer works or that situations from the past can’t provide us with analogies to what we currently see, because the world that we have right now is different. And I always reply that while this is true, it’s also true that the underlying emotional principles for price moves remain the same, and it is this that makes the technical rules work over and over again, regardless of what kind of news-based, fundamental, or sentiment-based trigger makes the market move.
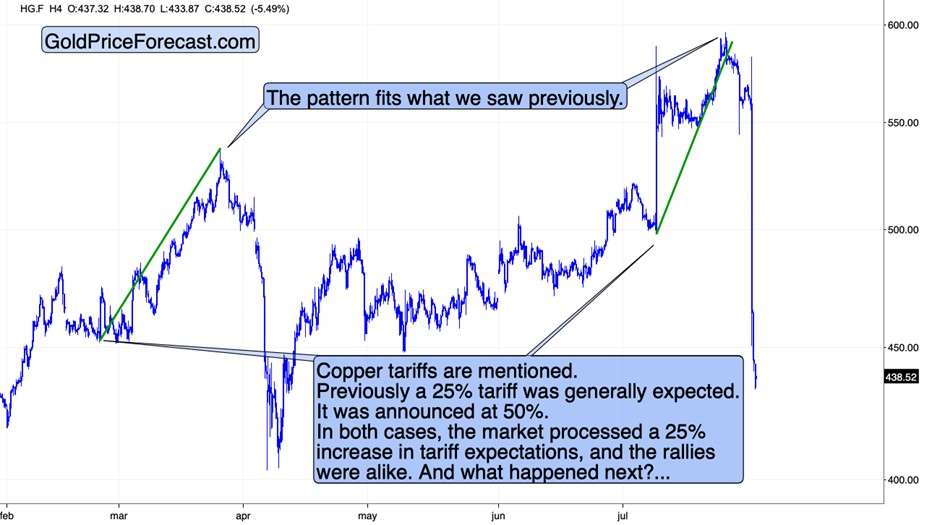
In this case, we have a remarkable analogy (I originally described to my subscribers several days ago) between the size of rallies in copper after increased expectations regarding copper tariffs. The green lines show that in both cases copper rallied by the same amount. And just like it plunged after the March top, it also plunged this month.
This time, we got the trigger in the form of Trump announcing that the key part of copper imports will be exempt from tariffs – but more on that later today. The key thing for now is that at the moment of writing these words, copper is trading below the levels at which it was trading before the tariffs were mentioned in February!
That’s one major breakdown. The chart below shows two more.
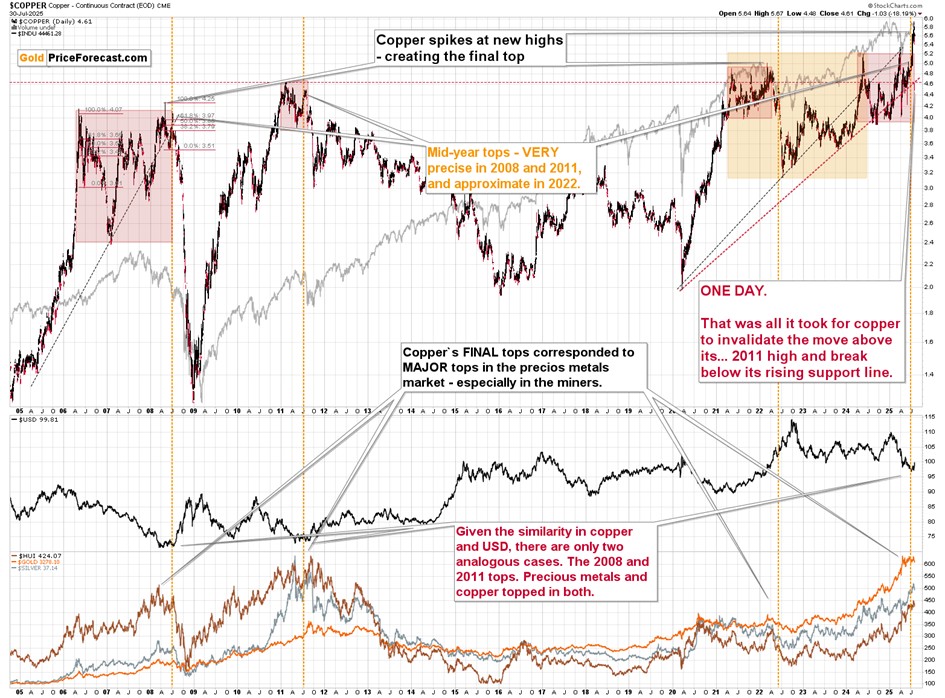
It took just a single day for copper to invalidate its move above its 2011 high and break below its rising support line.
Both are bearish developments, especially that they arrived very close to the middle of the year, and after price moves that are very similar to what we saw in 2008, 2011, and 2021-2022.
What did copper do next in all those previous cases? It declined. In a MAJOR way.
And the best (worst?) part? Gold, silver, and mining stocks declined along with it. Also in a MAJOR way.
USD’s Role in the Storm
When were the declines truly enormous? In two of those case – after the 2008 and 2011 tops. There is one thing that makes those stand out and it’s the performance of the USD Index, which you can also see on the above chart (the black line, second from the bottom). Namely, in both cases that was when the USD Index started to rally after multi-month declines.
This is exactly what we have right now!
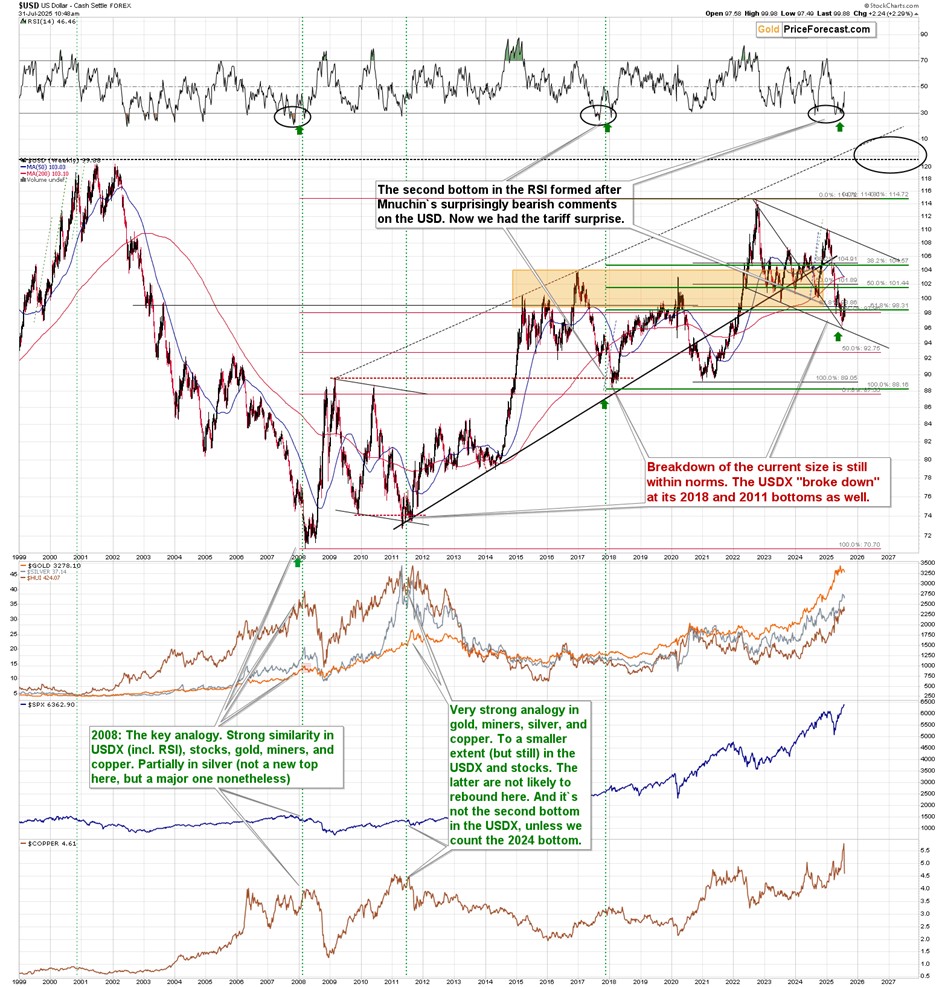
The week is not yet over, but this is (so far) the biggest weekly gain since the second half of 2022! That’s exactly how huge rallies started – slow at first (previous part of July), and then the weekly rallies were big and decisive.
The above chart shows that the rally is just getting started – the weekly RSI is still below 50, and the USD Index has only now invalidated the small (from the long-term point of view) breakdowns below the key Fibonacci retracement levels.
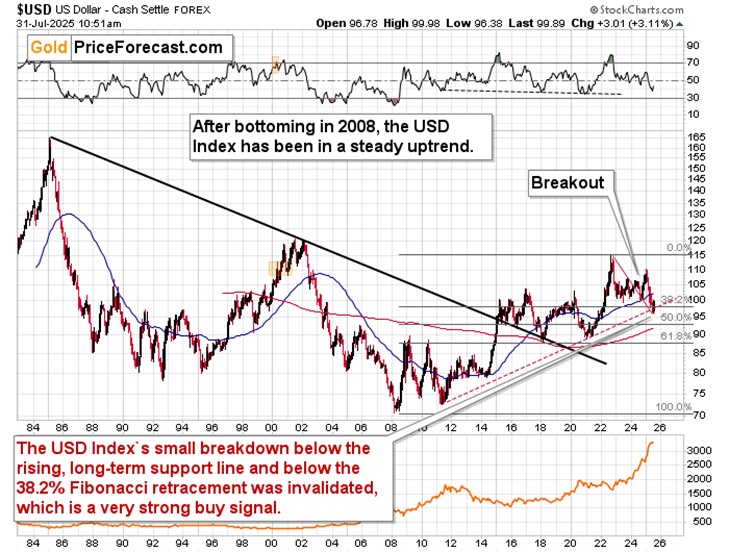
It also invalidated a small breakdown below its rising, long-term support line. This is a major, medium- or long-term buy signal for the USD Index. This is not the end of the rally – it’s its start.
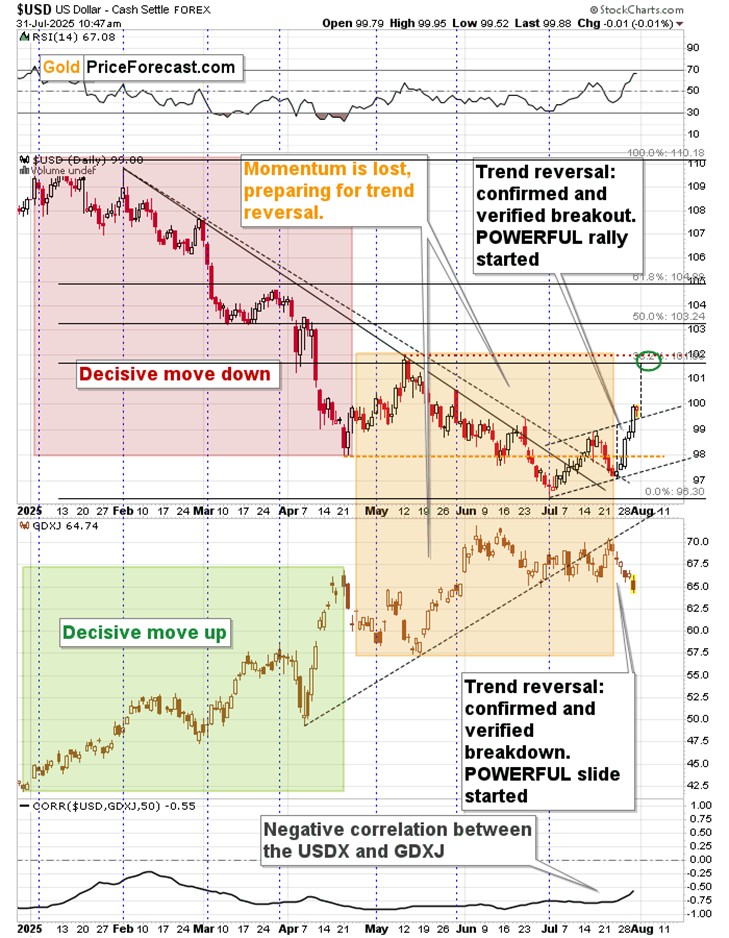
On a short-term basis, we even see a breakout above the short-term trading channel, which suggests a move up approximately equal to the width of the channel. This, along with the 38.2% Fibonacci retracement and the May high provide relatively strong short-term (and only short-term) resistance at about 101.65.
To put it simply, it looks like the USD Index could rally to its May high and consolidating slightly below it before soaring again.
This is particularly interesting given the recent strong (negative) link between USD and GDXJ.
With the USD Index at its May highs, we might see GDXJ close to its May lows in the near future.
This could trigger a rebound, especially if the move to the May lows is sharp, but it wouldn’t be anything more than that – a corrective upswing.
Will we want to catch that move higher? It’s somewhat probable. It will depend on the way GDXJ reaches this level and if the USD Index does indeed move to its May high (approximately) when the GDXJ approaches its May bottom.
Meanwhile, platinum plunged as well.
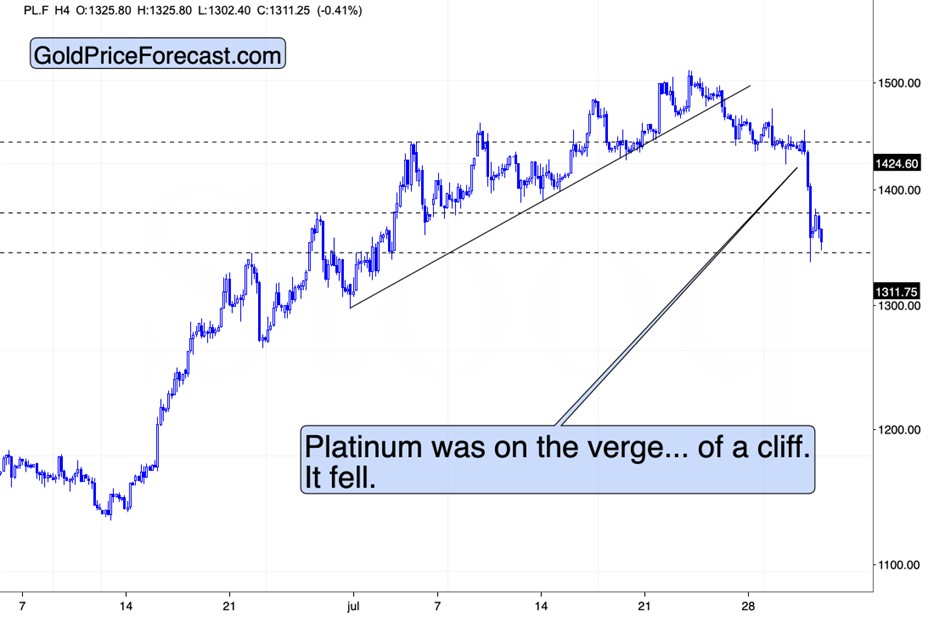
On July 18, I wrote that platinum was likely topping at $1,500, and yesterday, I wrote the following:
“Finally, platinum just failed to rally back above its June high, and it moved back below it. This pause likely means that platinum is getting ready to slide, but it’s waiting for the final push.
There are two events that could trigger further moves (up in the USD Index, and down in most other markets, including precious metals, commodities, and miners):
1. Today’s interest-rate decision from the Fed (almost everyone – including myself – is expecting Powell to keep the rates unchanged, but the key thing is what they will say during the press conference)
2. The August 1 tariff deadline / implementation. Even if key things are known upfront, this date could still trigger significant “but the rumor, sell the fact” price moves.”
It turned out that yesterday’s turmoil was enough to trigger the slide.
However, tomorrow’s tariff deadline could trigger another one – while it’s not something that I’d describe as certain, this outcome is on the table. As always, I will keep my subscribers informed.
Thank you for reading my today’s analysis – I appreciate that you took the time to dig deeper and that you read the entire piece. If you’d like to get more (and extra details not available to 99% investors), I invite you to stay updated with our free analyses - sign up for our free gold newsletter now.
********
 Przemyslaw Radomski, CFA, is the founder, owner and the main editor of SunshineProfits.com. You can reach Przemyslaw at: http://www.sunshineprofits.com/help/contact-us/.


