To Crash Or Not To CRASH . . .


…That is the question which Wall Street has to answer. Whether in the new week, next month or only by 2022 is not important; the direction the stock market will take is important for various reasons. The obvious one is the effect on investors in equities: will they make (more) profit or will they have to sell quickly to lock-in that which they have made so far before it disappears? But investors in equities are not the only parties interested in what the future holds for Wall Street.
The stock market is expected by some observers to rally steeply for the near to medium future because of higher inflation to come. They believe that the recent rising trend will not be transitory, but could reach double figures by early to mid 2022. That and a weaker dollar will combine to push prices higher, increase profits and send equities off on a new leg of their long-term bull market. On the other hand, if higher inflation is not going to be as transitory as promised, a time will come when fear of higher interest rates will subdue optimism about the economy and the stock market will go into a lasting decline.
We can turn to history to explore the links between inflation and the dollar and interest rates and their effects on the stock market. The last accepted period of high inflation in the US was from about mid-1960 to late 1970. That is, if we disregard the period since the late 1990s when the CPI did not reflect the increase in prices to the same extent as during the 60s and 70s.
The four charts below span this approximate period of high inflation to compare and to explore the trends in the charts, from top to bottom – the US CPI, the DJIA, the yield on the 10-year US Treasury note and the Dmark-dollar exchange rate, which were the primary forex pair after Nixon floated the dollar in 1971.
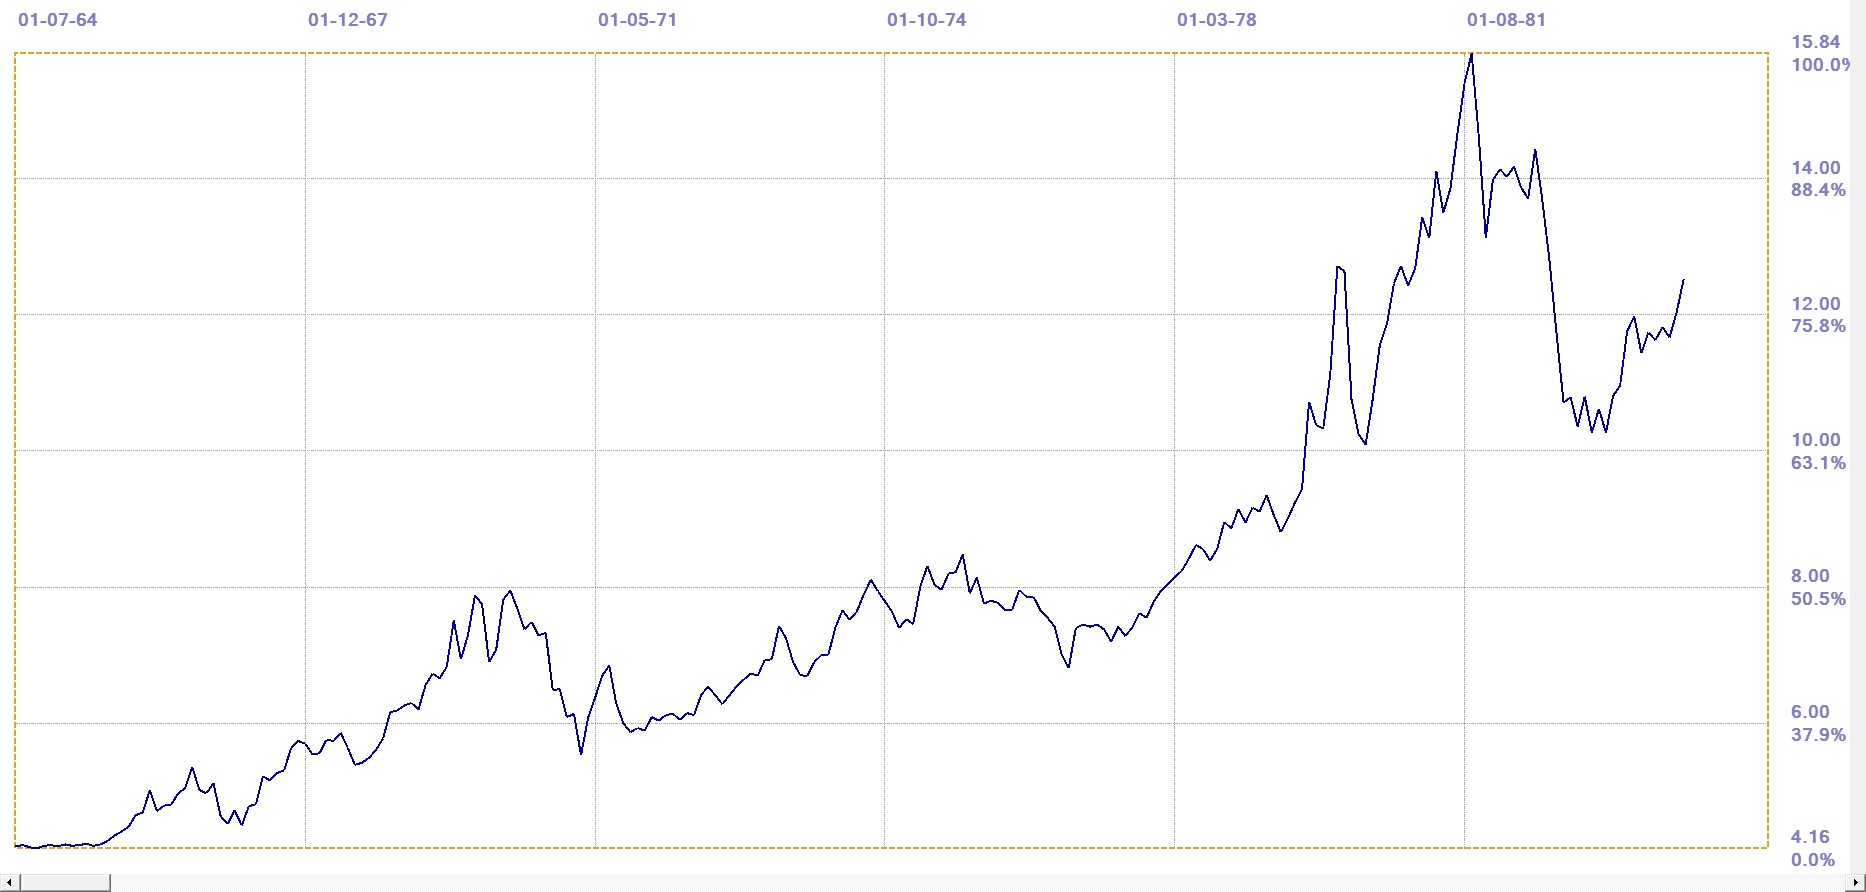
The CPI shows a steady rise in the inflation rate from the mid-1960s to hit two double-digit peaks, the first in 1975 and then one even higher in early 1981, After that one, the CPI returned to below 5% by 1985. The second chart shows the rising trend in the yield of the 10-year Treasury note that eventually peaked at 15.84% in August 1981. Volcker, then the new Fed Chairman, attended a conference of central bank chiefs in Eastern Europe in the late 1970s and was informed that if the US could not bring its inflation under control, other countries would dump their US Treasuries that they were holding in their reserves. Volcker took this to heart and increased rates until inflation was brought under control just in time to give Reagan a good start to his first term.
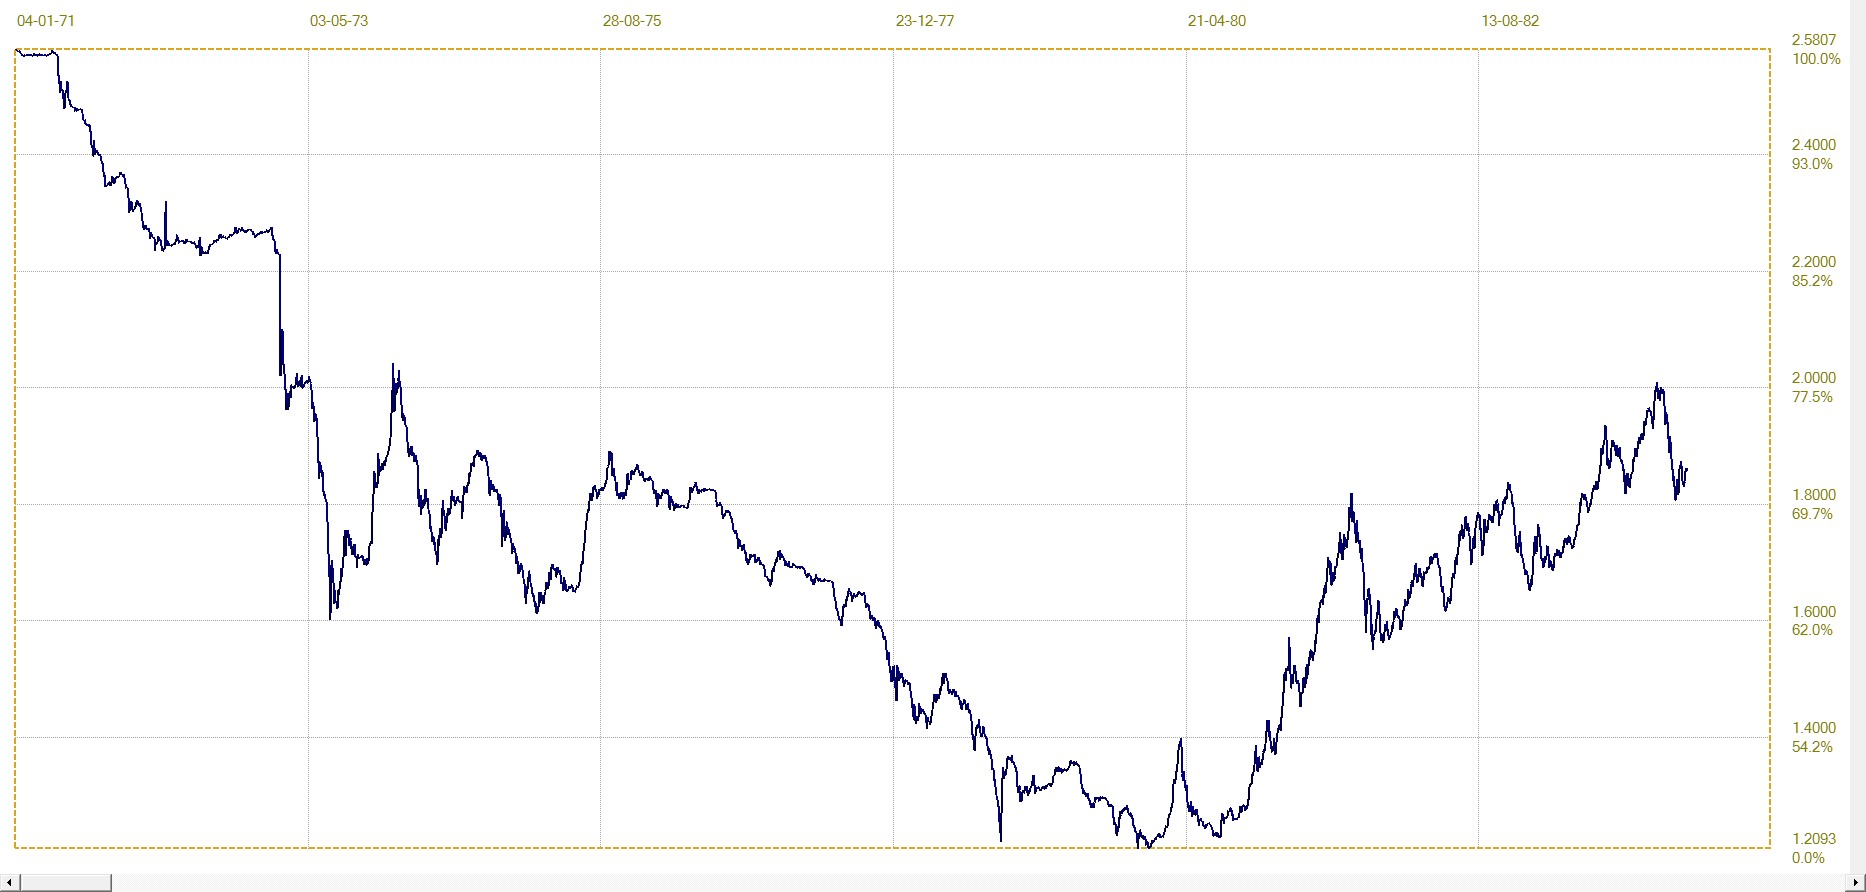
When Nixon took the dollar off the gold standard so that currencies were left to float against the dollar, the dollar started off at about $2.50 to the Dmark, which was the strong currency at the time, but almost immediately began to lose value – something other central banks holding Treasuries in reserve obviously did not appreciate. The dollar’s low value was reached in January 1981, at the time of Reagan’s inauguration. Clearly, Volcker’s high-interest rates were having an effect on the value of the dollar and were also starting to reduce the rate of inflation from that time onwards.

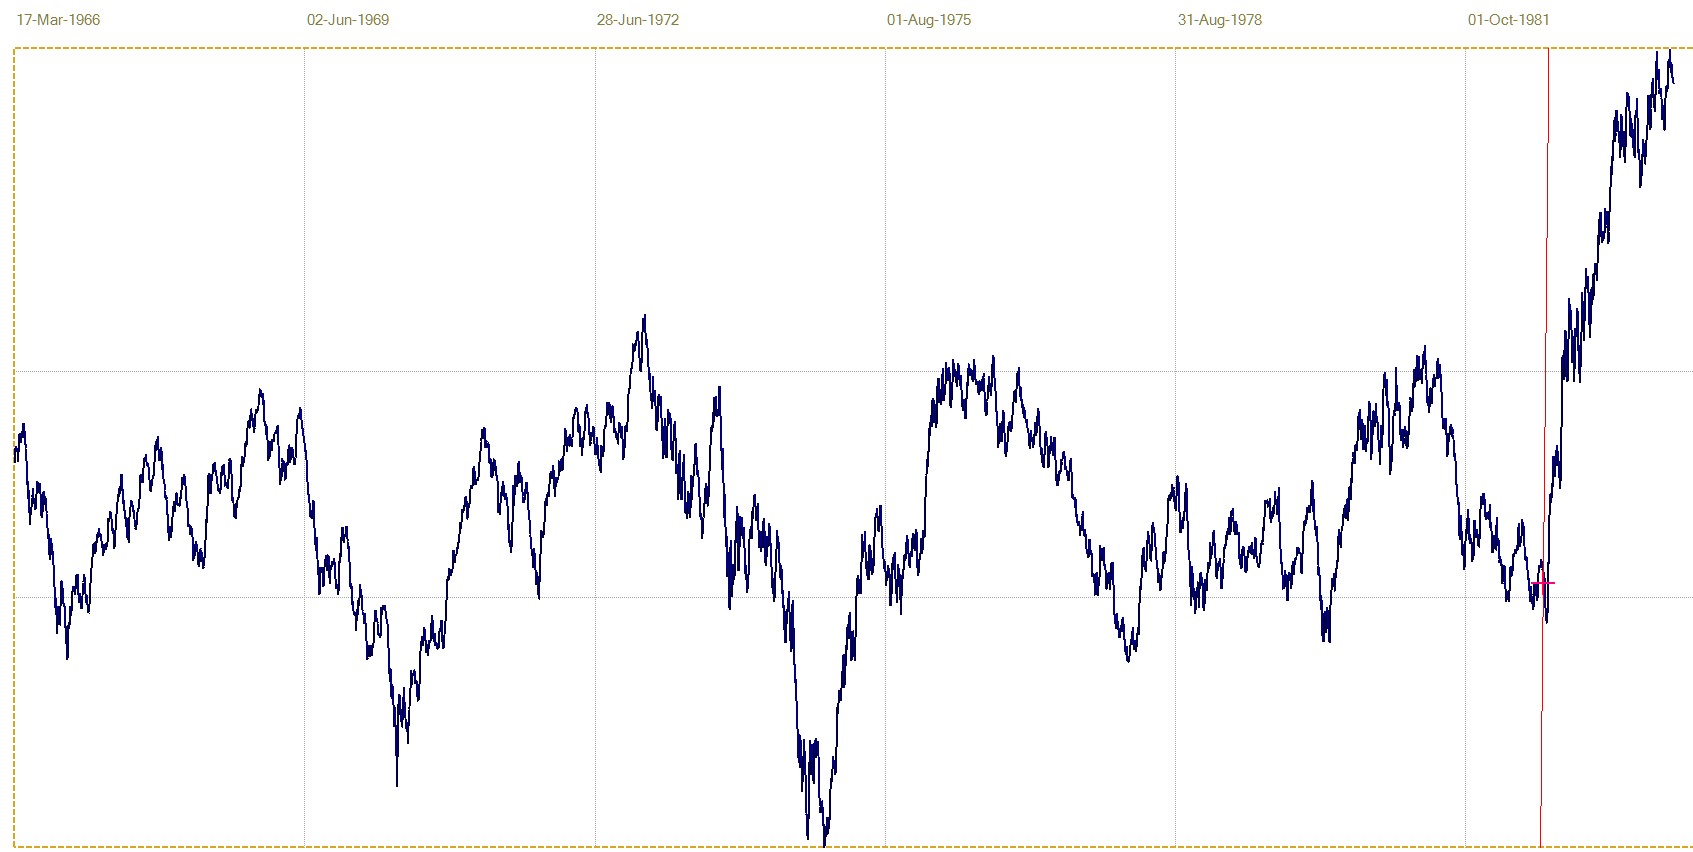
Against that backdrop with high inflation, how did Wall Street do? During all of these years from the early to mid-1960s to about 1980, the bottom chart shows that the DJIA moved mostly in sync with the CPI, declining when the CPI declined and increasing when inflation increased. However, the trend during the whole period was sideways, the DJIA holding in a band near 1000 points and mostly keeping above 800 points. The swings were, say, 25% from low to high, which today would calibrate to, say, 2800 to 3500. At that time they did so as steady up and down trends, not the sharp spikes lower followed by a rapid recovery, as the stock market has experienced since late 2018 during the sustained bull market.
Projecting on that basis, what the future holds is not easy and it cannot be merely a simple extrapolation of the past events. The situation today is radically different from that of the 1970s. At that time, the US was still the major manufacturing country in the world; a major exporter, except for being reliant on fossil fuel imports to feed the energy requirements of a busy economy. Oil was no longer as cheap as it used to be, following the oil shock of 1973 which effectively set the cycles of higher prices with runaway inflation on their way.
Today the US is no longer the manufacturing centre of the world economy, but is the biggest importer of consumer goods and much else in the world. The middle class was as wealthy as it had ever been during the late 60s and into the 70s, while now 80% of US households are in a spiral into impoverishment because their CPI related wage and salary increases do not keep pace with increases in the cost of living. Powell, therefore, is not in the fortunate position that Volcker was, who had a near-free hand to increase rates as far as was needed to interrupt the inflation cycle. An increase today of even as high as a low 3-4% would stifle the economy into a recession, if not worse.
The 1000 point ceiling for the DJIA that lasted for some 16 years in total, could not be breached during the decade of inflation. This would suggest that Wall Street, now at an all-time high, would reflect the brake on the economy should it prove necessary to increase rates to bring inflation under control. Fear of that happening undoubtedly will curb any interest rate hawks in the FOMC, which could release inflation to reach new highs during the next few years. The dollar could repeat the steep decline of the period from 1971 to 1980, this time having the effect of ramping up inflation when the cost of imports soars.
The conclusion seems predetermined; the US is not in the position it was in during the late 1970s and able to do the necessary to deal with and recover from rising inflation. How this potential future will play out is not easy to project, but it seems clear that it will not be a pleasant time. Given the ad hoc manner in which the administration has been making changes and dealing with problems since assuming control of the country a scant 7 months ago, the prospect of what they will do is daunting.
Meanwhile, we patiently have to wait to see what the prices of gold and silver will do now that evidence suggests that COMEX, where the official prices of the metals are determined, is being shunned more and more by investors who are giving up on using it as a means of investing. Perhaps the meme that one has to buy the physical is having effect until the gaps between COMEX’s artificial price and the price of the metals in the real world become so wide that the absurdity of using Comex and the LBMA fix as the official price of gold and silver becomes so laughable even the CFTC catches the joke.
Euro–Dollar
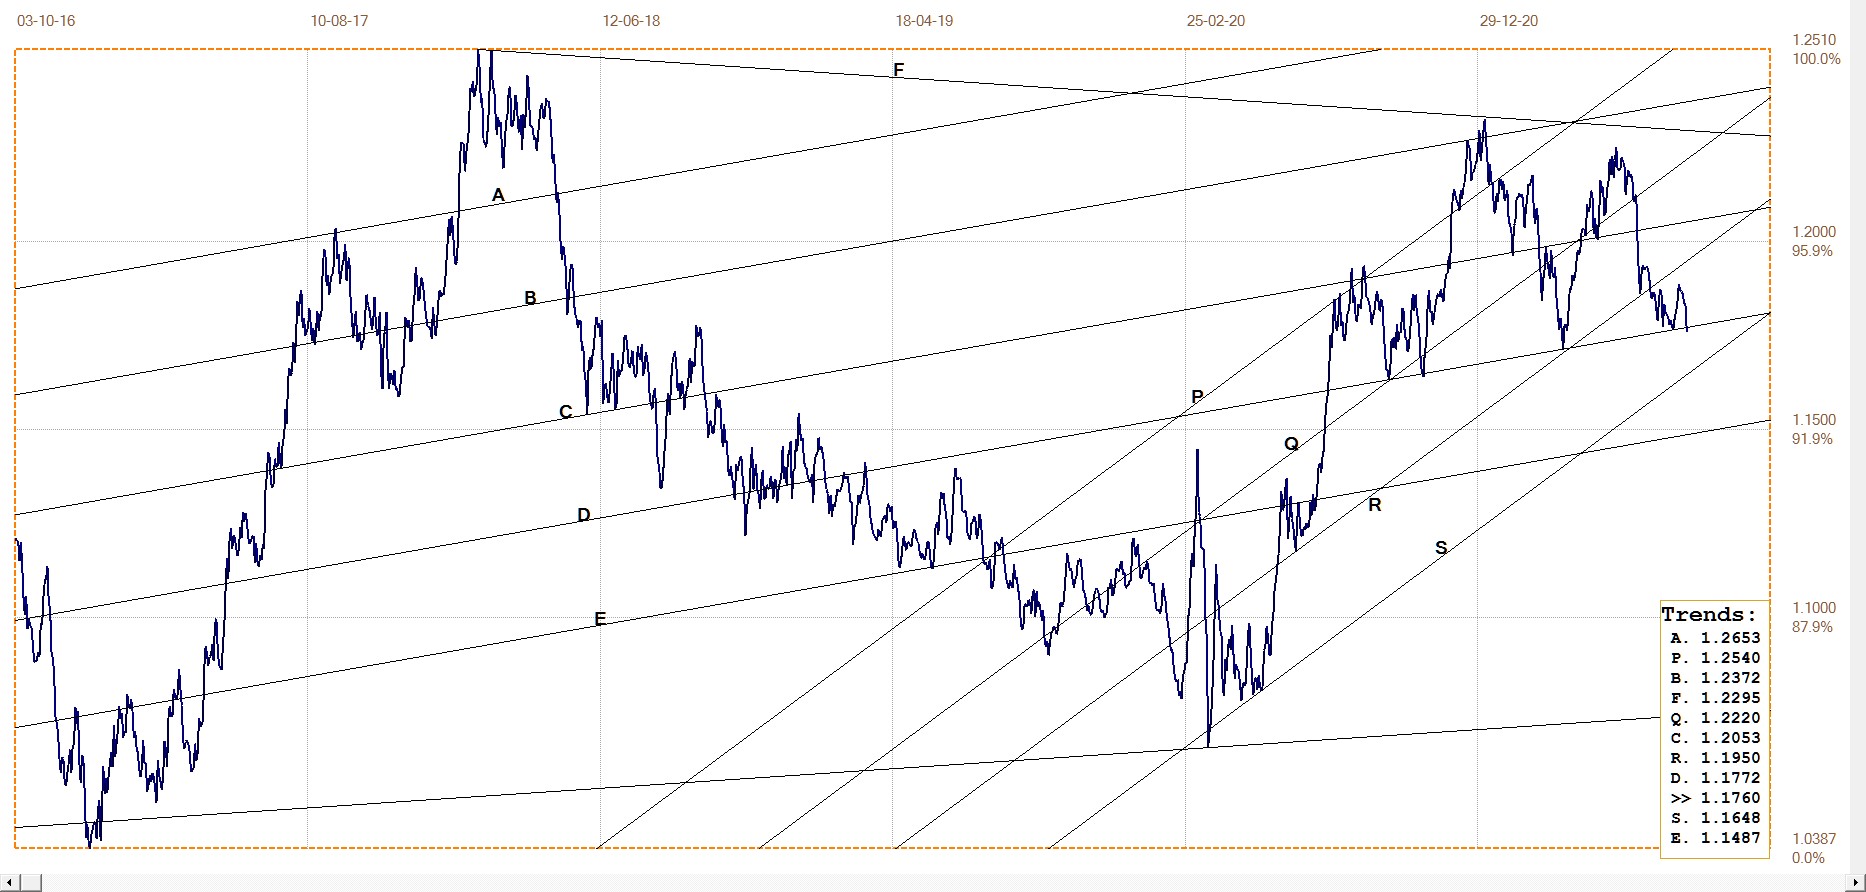
Euro–dollar, last = $1.1760 (www.investing.com)
The traditional pattern of a head and shoulders predicts an extended bear market as soon as the neckline is penetrated to the downside. The euro now is at risk after four tests of the support along line D. A definite break lower will put the widely expected bogeyman of a dollar decline at rest, while a new reversal higher, if sustained, will bring that bogeyman back into play. It might require all of August to resolve what the future holds for the dollar.
DJIA daily close
Another new all-time high for the DJIA last week goes to show that so far all the prophets are still holding their collective breaths while scrabbling to find cash for the margin calls on their short positions; at least those among them who are committed to keeping their cash where they believe the market is headed.
The earlier discussion suggests that where in the past the stock market was bullish as long as inflation increased and vice versa, this relationship might no longer hold under current circumstances. Perhaps as many as 40-50% of US households cannot increase spending on their own resources, unless they are assisted by government handouts. It is not a win-win situation for the economy and the stock market.
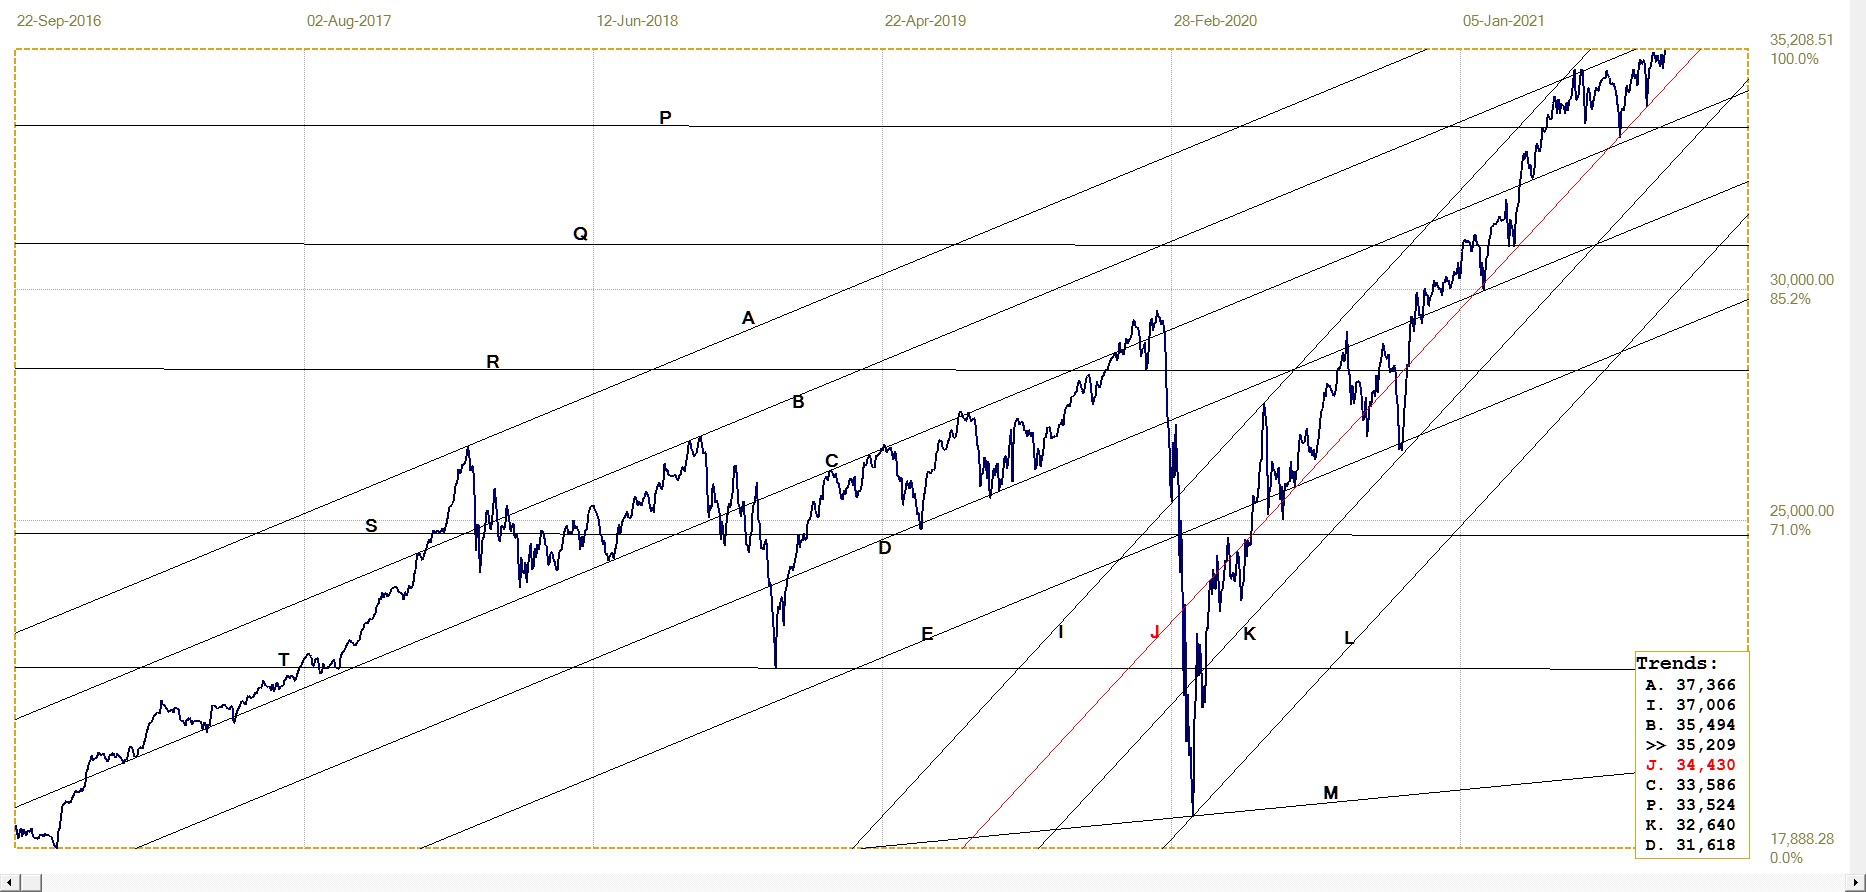
DJIA. last = 35208.51 (money.cnn.com)
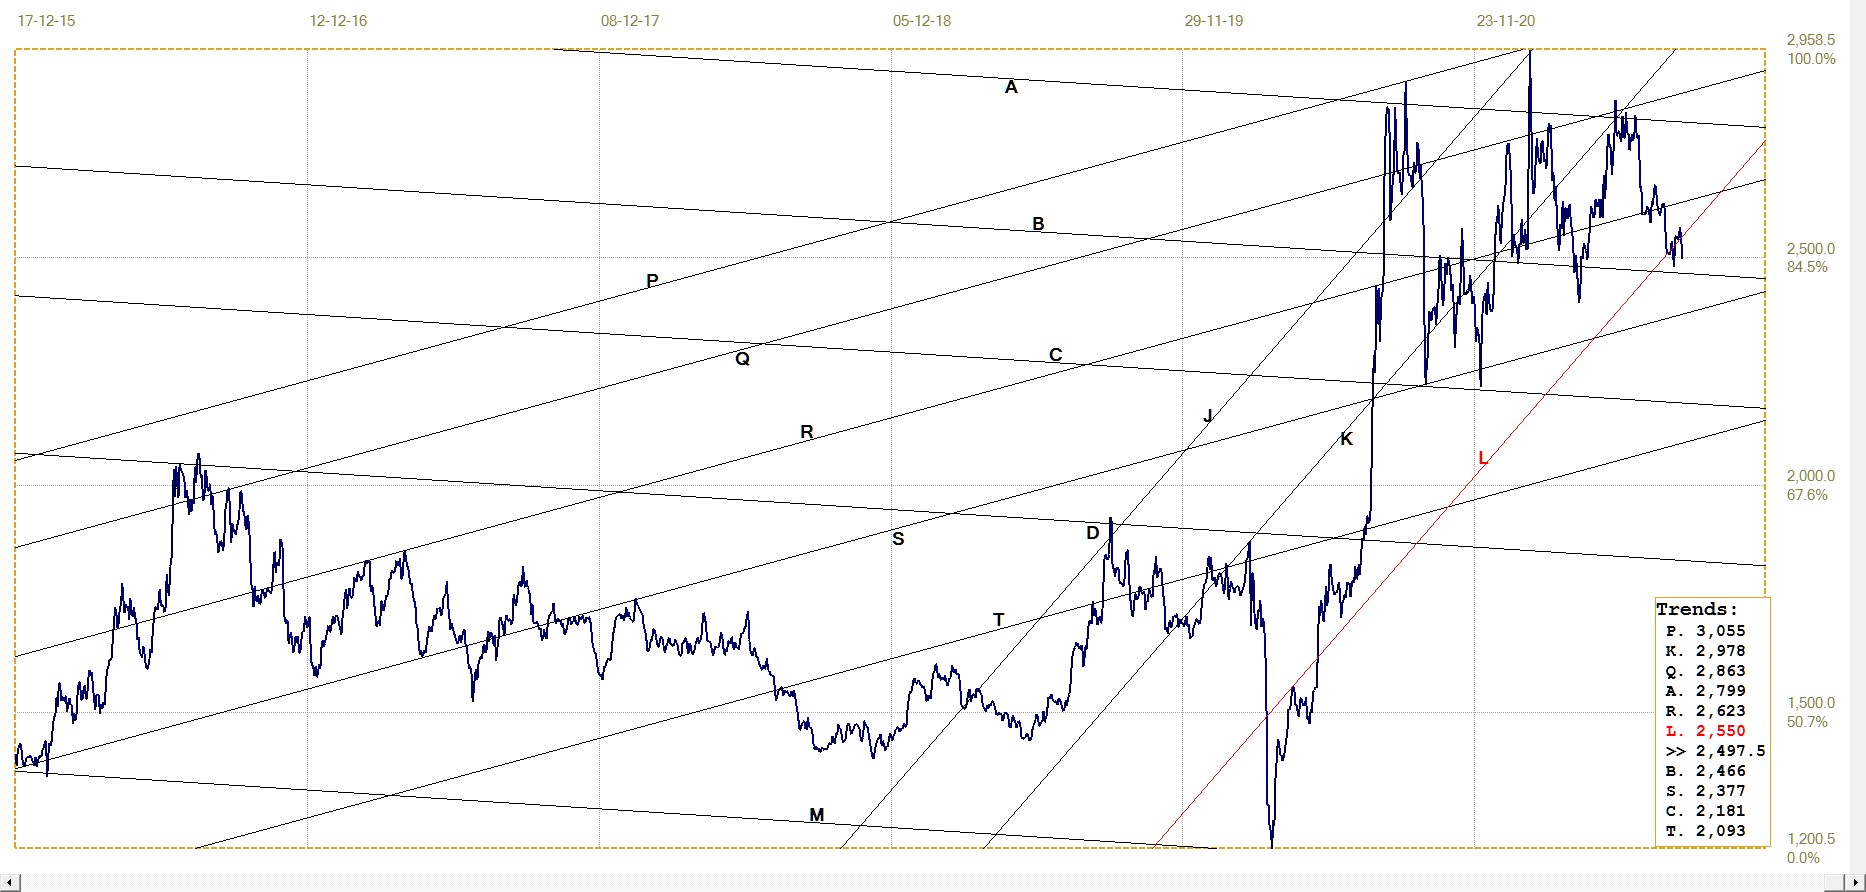
Gold London PM fix – Dollars
Gold price – London PM fix, last = $1762.90 (www.kitco.com)
Last week as July ran out, it looked as if the $1800 ceiling was being breached; that the price of gold could resume the bull market that was brought to a halt a year ago, to be followed by a period of severe price suppression.
Based on what happened last week, that was a wrong conclusion. The decrease of investor interest in Comex is giving the Cabal an opportunity to reduce their short positions in gold at prices more to their liking. Whether this is sustainable should the algos of the large specs switch from long positions to go more short, is a question that is not easy to answer. It could become another example of the old saying, ‘Be careful what you wish for.’
Euro–gold PM fix
Euro gold price – PM fix in Euro. Last = €1497.58 (www.kitco.com)
The weaker dollar price of gold meant that the euro price of the metal has failed to hold the break higher above line G and has also broken a second time below the rising support of channel KL. With prospects of a weaker euro (should the earlier head and shoulders pattern break lower, while dollar gold could also fail to hold at its support) it would not be a surprise to find long term support along line E to be tested again in the near future. That is, if that support can manage to hold, which would imply that dollar gold might continue higher in a longer term bull market.
Silver Daily London Fix
Last week, the recovery back into channel KL was seen as being still tentative and what happened bears that out. The lower price last week sees silver again below channel KL. Given the declining silver OI on Comex, it looks as if lack of investor interest could see the price even lower during August. A break to below line B would confirm that conclusion.
Silver daily London fix, last = $24.975 (www.kitco.com)
U.S. 10–year Treasury Note
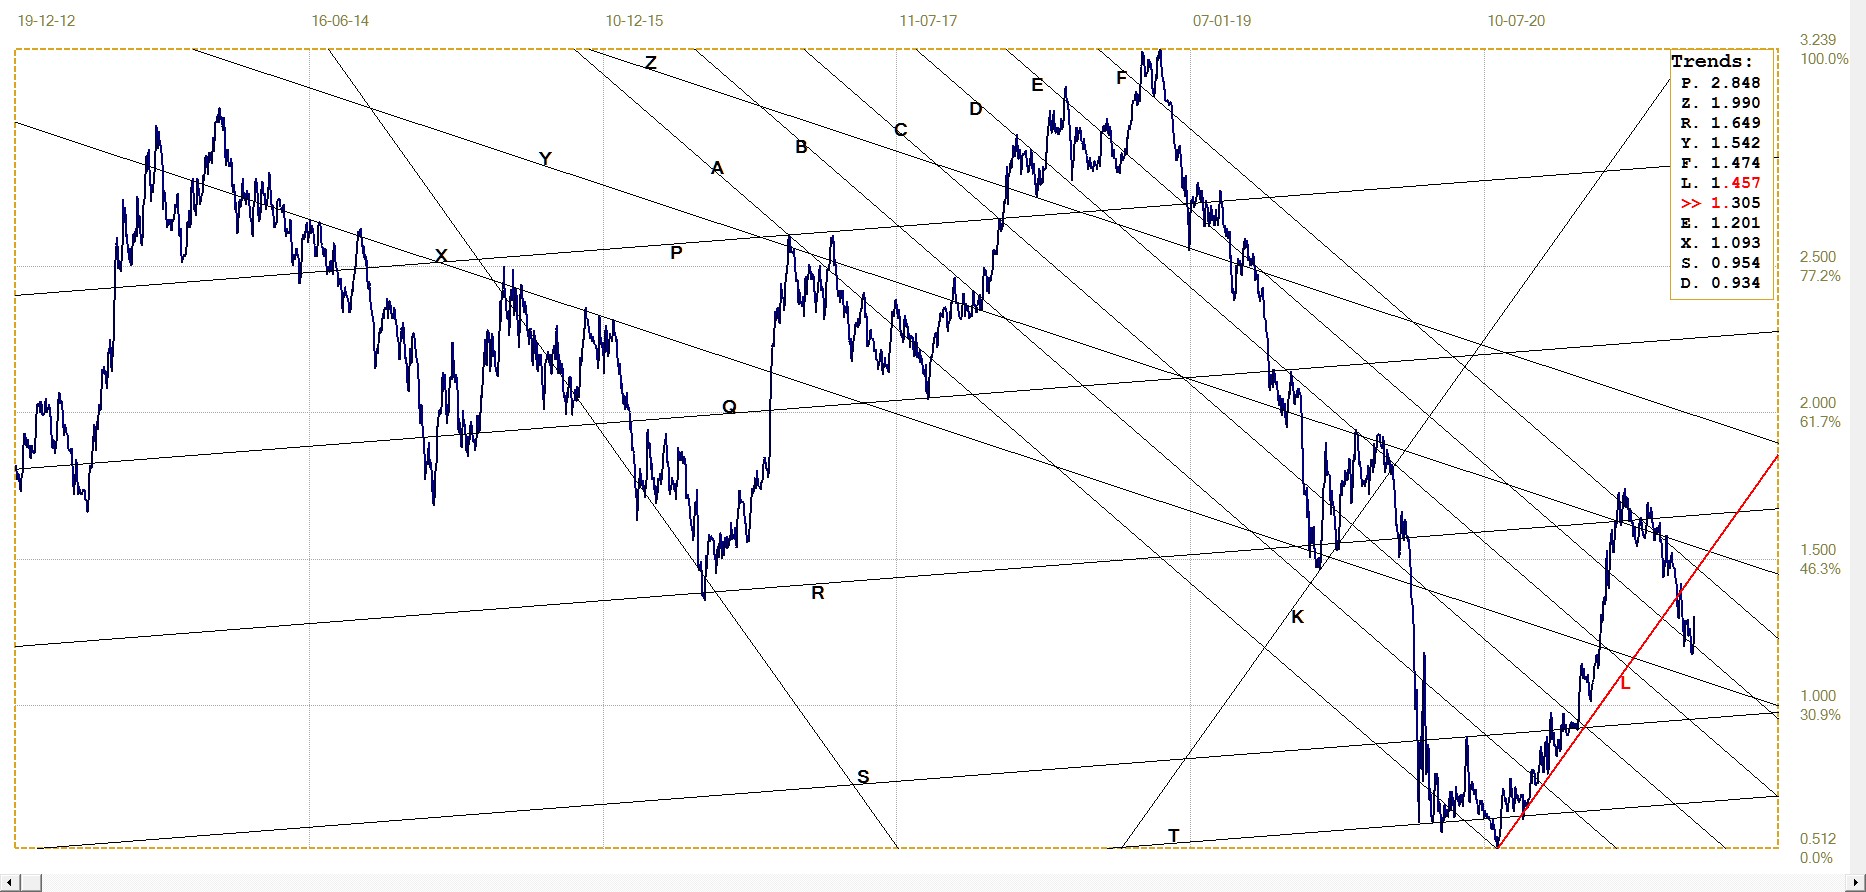
U.S. 10–year Treasury note, last = 1.305% (www.investing.com )
The trend towards lower yields on the 10-year US Treasury note now appears to have ended, or at least has entered a period of consolidation while the market ponders the question of how transitory the period of higher inflation will prove to be, if at all. The consensus opinion among market commentators appears to be that inflation is here to stay and grow. Consensus is often a herd phenomenon that bears little relationship to reality, but if it happens to be correct this time, the yield should reverse higher and in due course return to channel KL.
West Texas Intermediate crude. Daily close
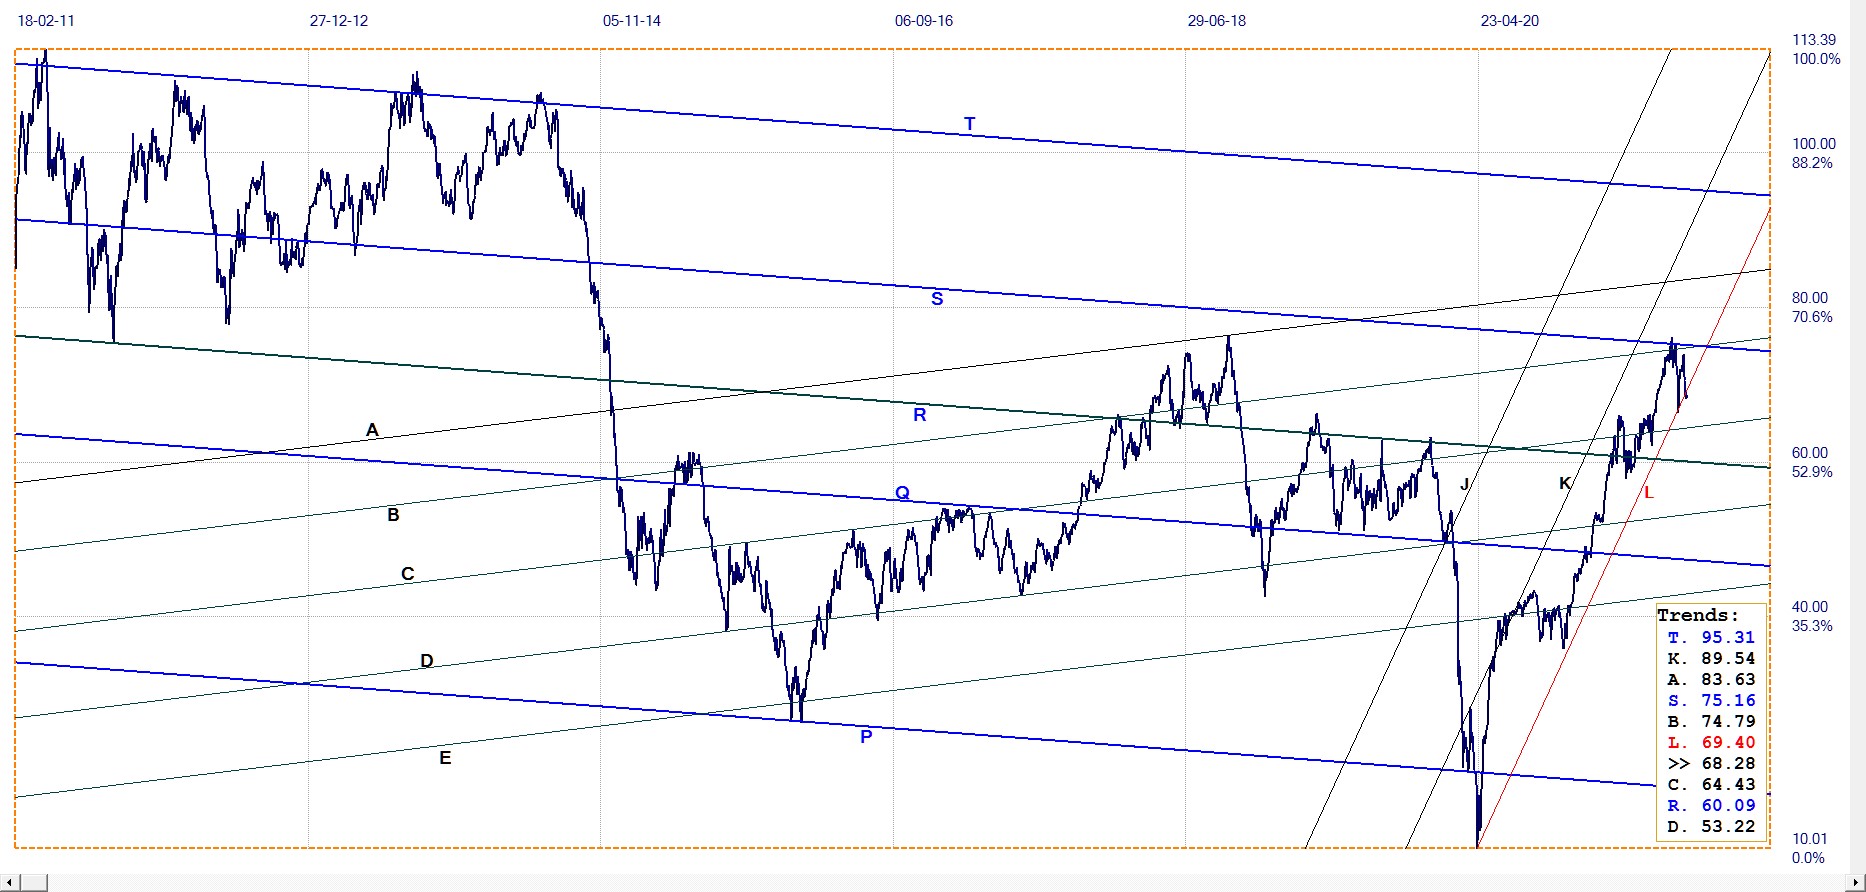
WTI crude – Daily close, last = $68.28 (www.investing.com )
Despite the increasing volatility, the price of crude continues to hold within bull channel KL. While the price of crude remains bullish, to be confirmed with a break above lines B and S in the not too distant future, higher inflation is on the cards. A definite break below channel KL and new lower trend is, however, unlikely for the near to medium future given the official emphasis on containment of global warming and reduced access to and presumably reliance on fossil fuel.
********


