Current Position Of The Market


SPX Long-term trend: The long-term trend continues unimpeded but could be challenged in early 2022.
SPX Intermediate trend: An intermediate correction has ended and given way to another intermediate uptrend which could continue into early 2022.
Analysis of the short-term trend is done daily with the help of hourly charts. They are important adjuncts to the analysis of daily and weekly charts which determine longer market trends., please let me know at [email protected]
Minor Cycle Correcting
Cycles: Looking ahead!
7-yr cycle – Last lows: 2009-2016. Next low: ~2023
Market Analysis (Charts, courtesy of StockCharts)
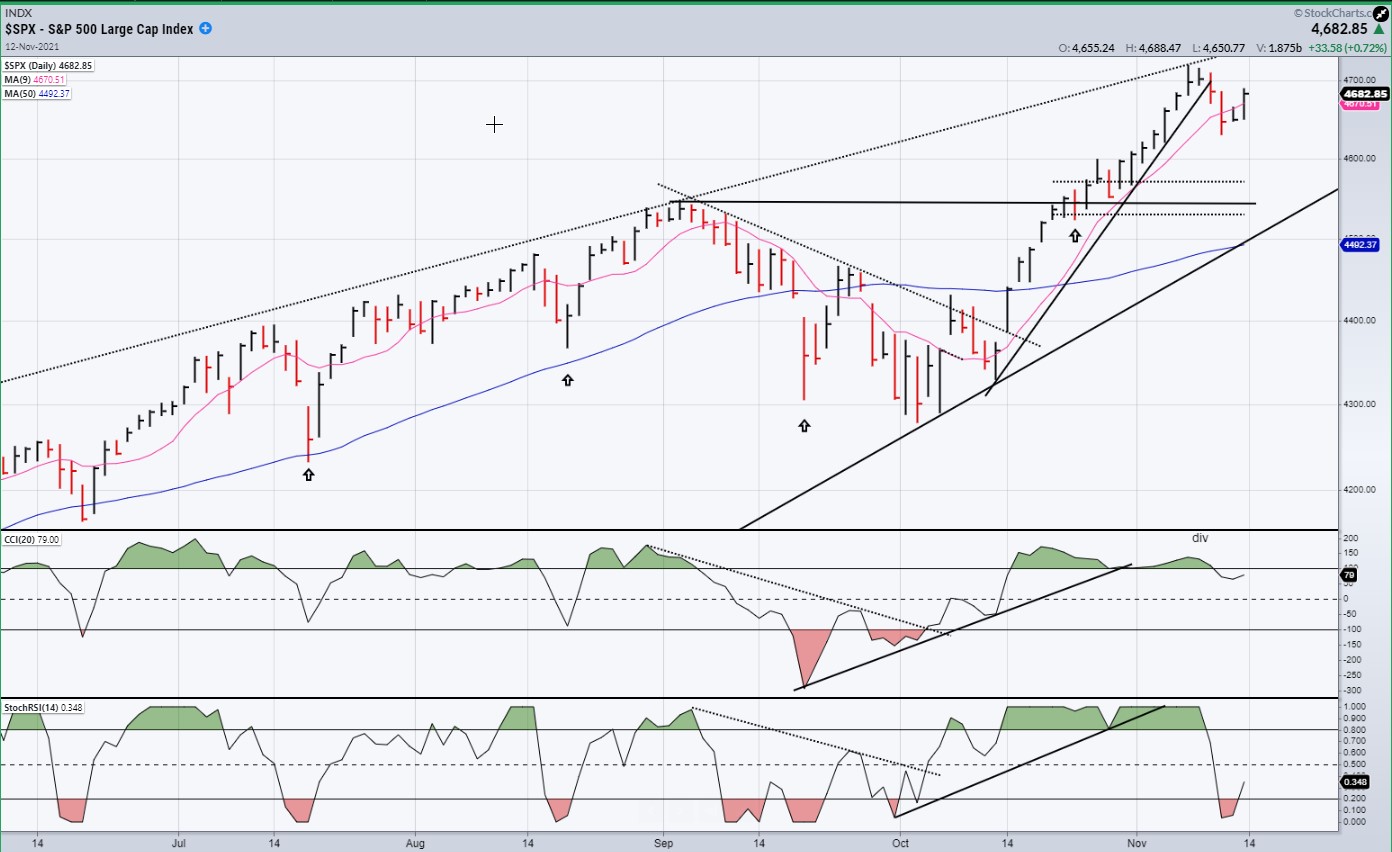
SPX daily chart
A couple of weeks ago some deceleration was beginning to take place in the index due to some technical and cyclical factors, and this was being reflected in the indicators as we approached the FOMC meeting suggesting that the market might react negatively to its report. Instead of correcting immediately, the index liked what it heard from the Fed and from the jobs report which followed a few days later, and it tacked on close to another 100 points before starting to pull back. Only then was it able to start the anticipated correction, shaving off about 90 points in the early part of last week before finding support and rallying into Friday’s close.
The decline which began at 4718 is likely to be a correction brought about by the current short-term cycle due to make its low on about 11/22. The rally which started from 4630 on Wednesday is probably a countertrend move which had an estimated projection to ~4685. This was achieved on Friday, but it could push a little higher.
The October low marked the beginning of another intermediate uptrend which is currently only experiencing an interim correction. Should SPX follow the proposed scenario, it will continue this pullback for another five or six more trading days into the next short-term Hurst cycle low; after which the market would be expected to continue its uptrend -- probably into early 2022 before the current intermediate trend comes to an end.
The correction into October created a base which is capable of higher projections than those already achieved. At a minimum, the index should be able to reach 4790 (and probably higher) before coming to the end of the intermediate trend.
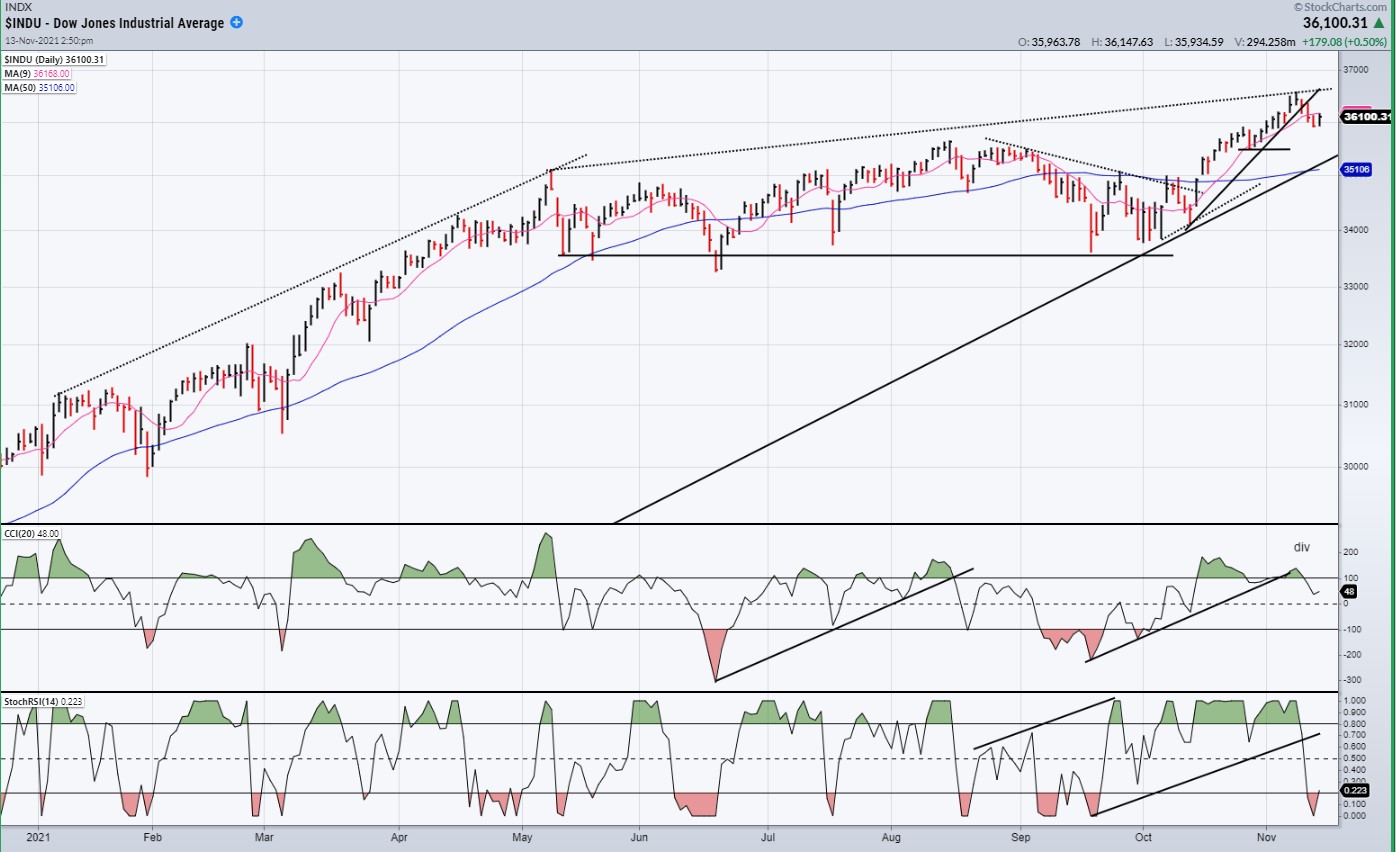
DJIA daily
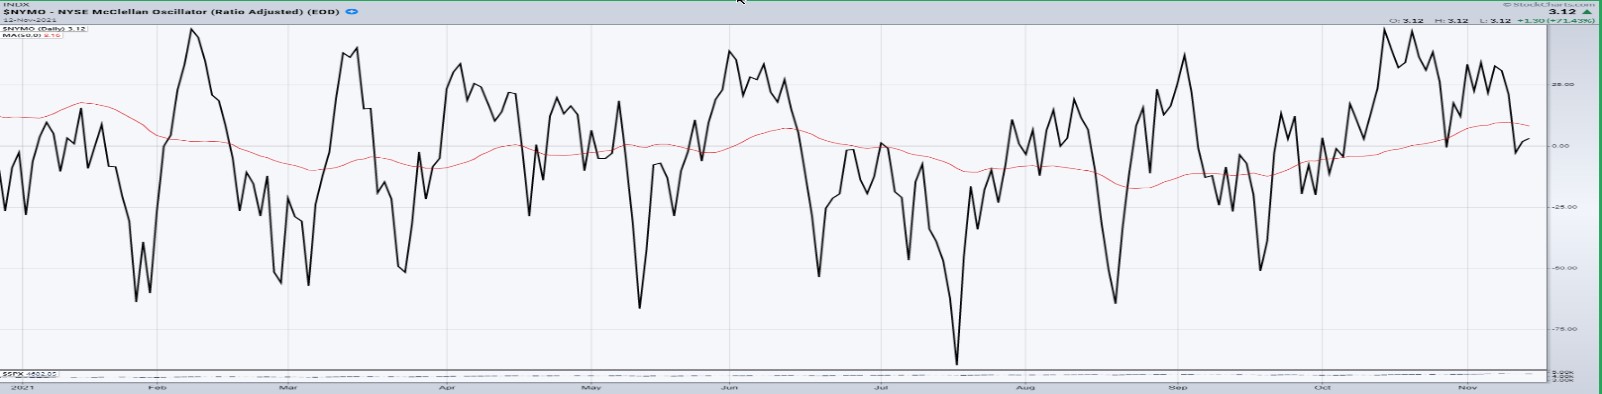
I have again posted the McClellan indicator underneath the daily DOW chart. Earlier this month, this breadth indicator gave a clear warning that the market was nearing a short-term top and, even with the strong push that followed the FOMC report, it only achieved a very limited recovery. With the current retracement, it has already made a slightly new low, enhancing its negative divergence with the DOW and projecting more weakness ahead.
The DOW itself is showing more weakness than either SPX or NDX in the current countertrend rally.
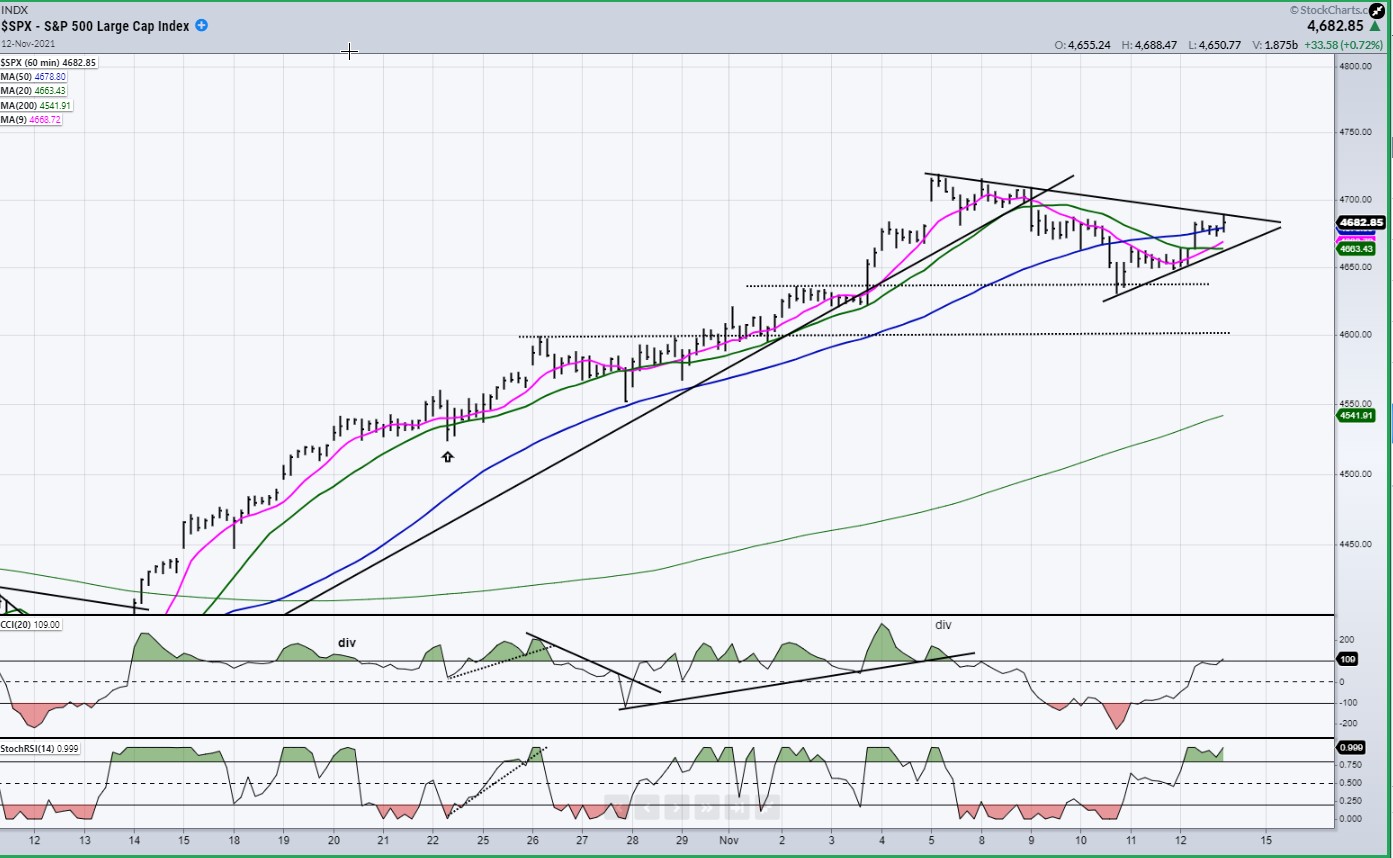
SPX hourly chart
The hourly SPX chart substantiated the warning issued by the daily chart indicators with negative divergence appearing in its own indicators. This signaled that, at a minimum, a consolidation lay ahead; but by Tuesday’s close it became apparent that we had probably already struck the high point of the current short-term cycle.
The index is now making a corrective a-b-c pattern with the first phase ending at 4630. From that level, the countertrend rally may have ended the second phase on Friday although, as stated earlier, we could see a little more before rolling over into the third phase of the short-term correction. Initial selling found support at the first price congestion level indicated by the upper dotted line. The next phase stands a good chance of progressing down to the second dotted line, at least, before ending. We’ll know better when we have confirmed the countertrend high and started down again.
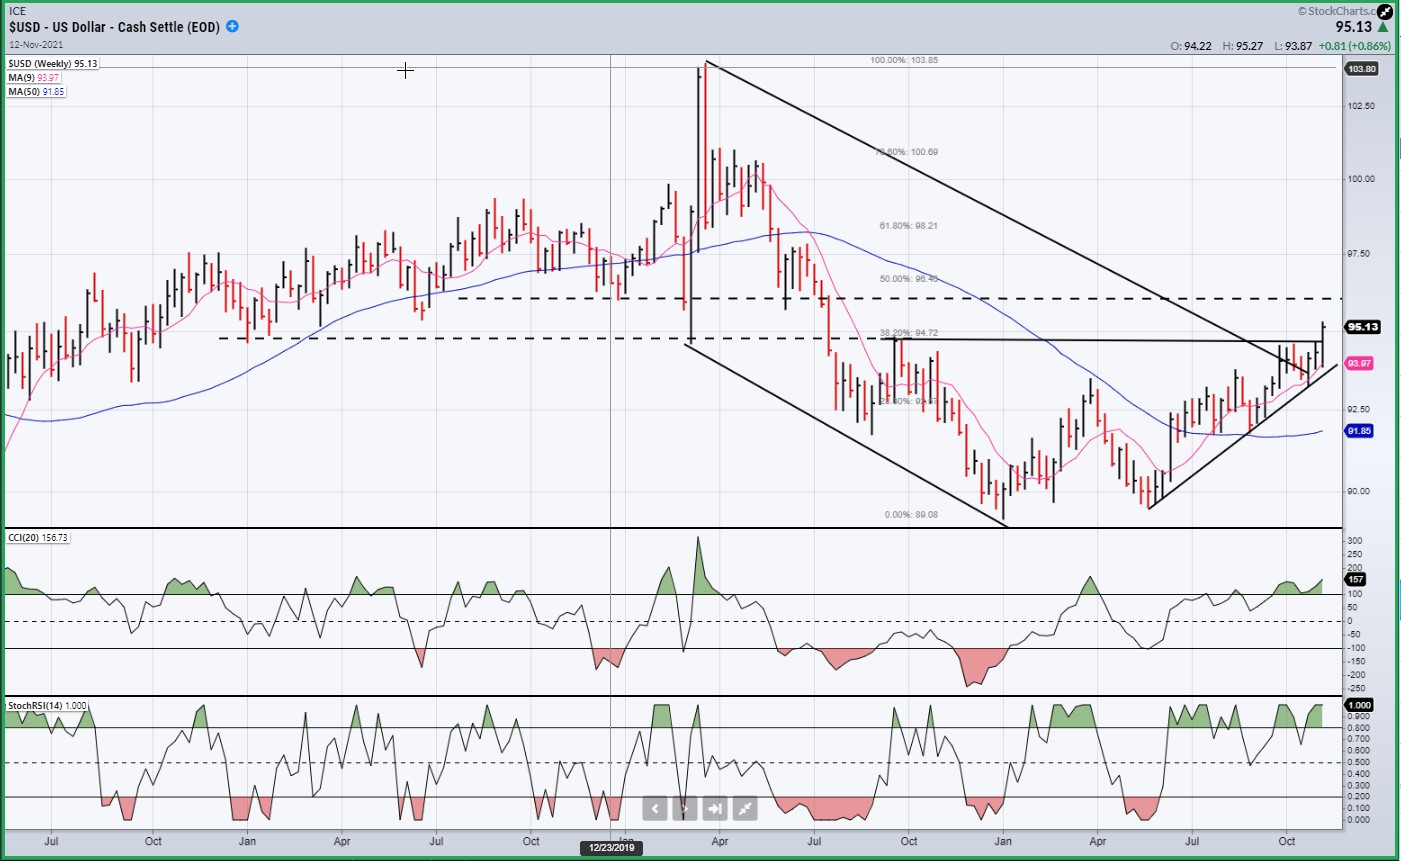
USD dollar daily
The dollar extended its move outside of the channel and above the lower resistance level. It should continue to move to the next resistance level and to its ~96 target before putting an end to the rally which started at 90.
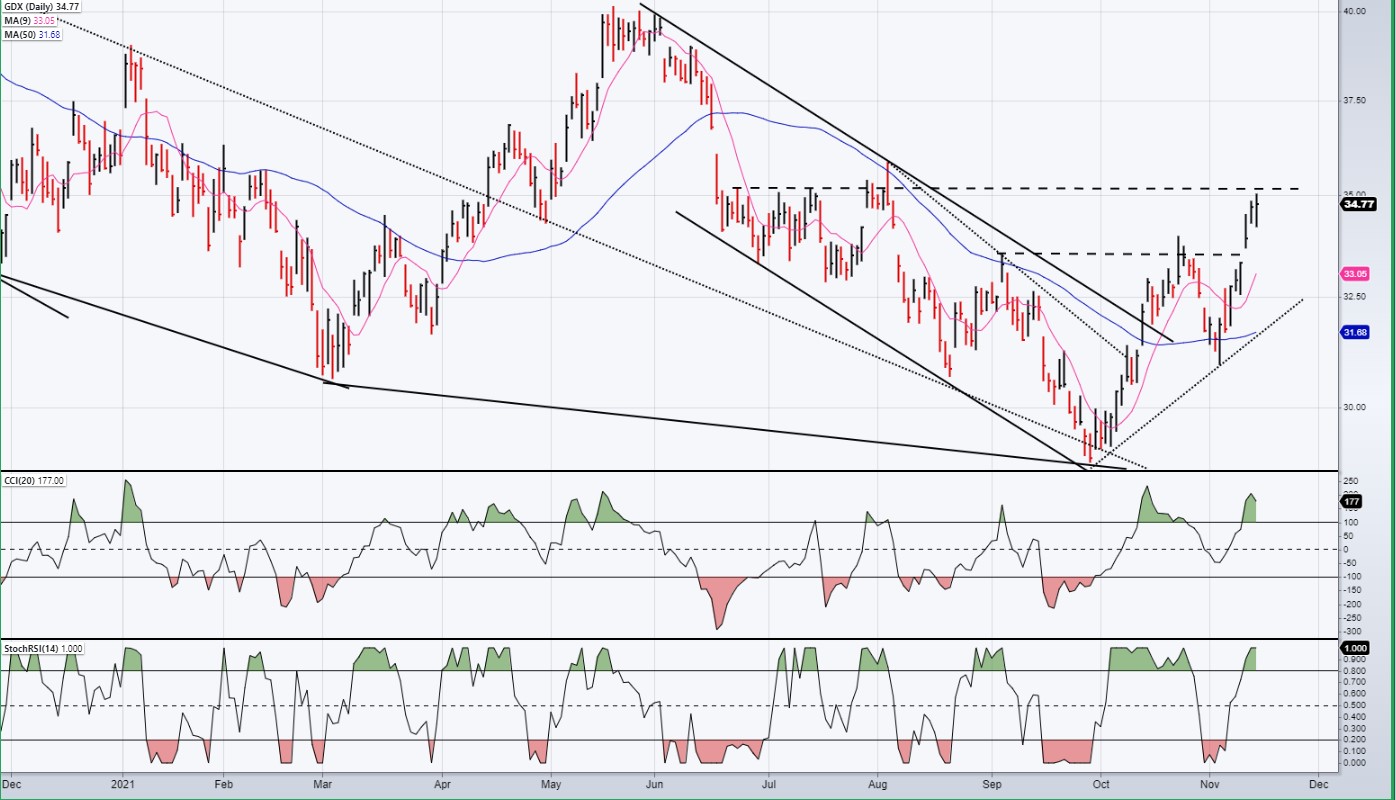
GDX gold miners - daily
GDX overcame its first resistance level and extended its rally in spite of the dollar strength. But that, combined with another band of resistance, could cause it to pause for a few days.
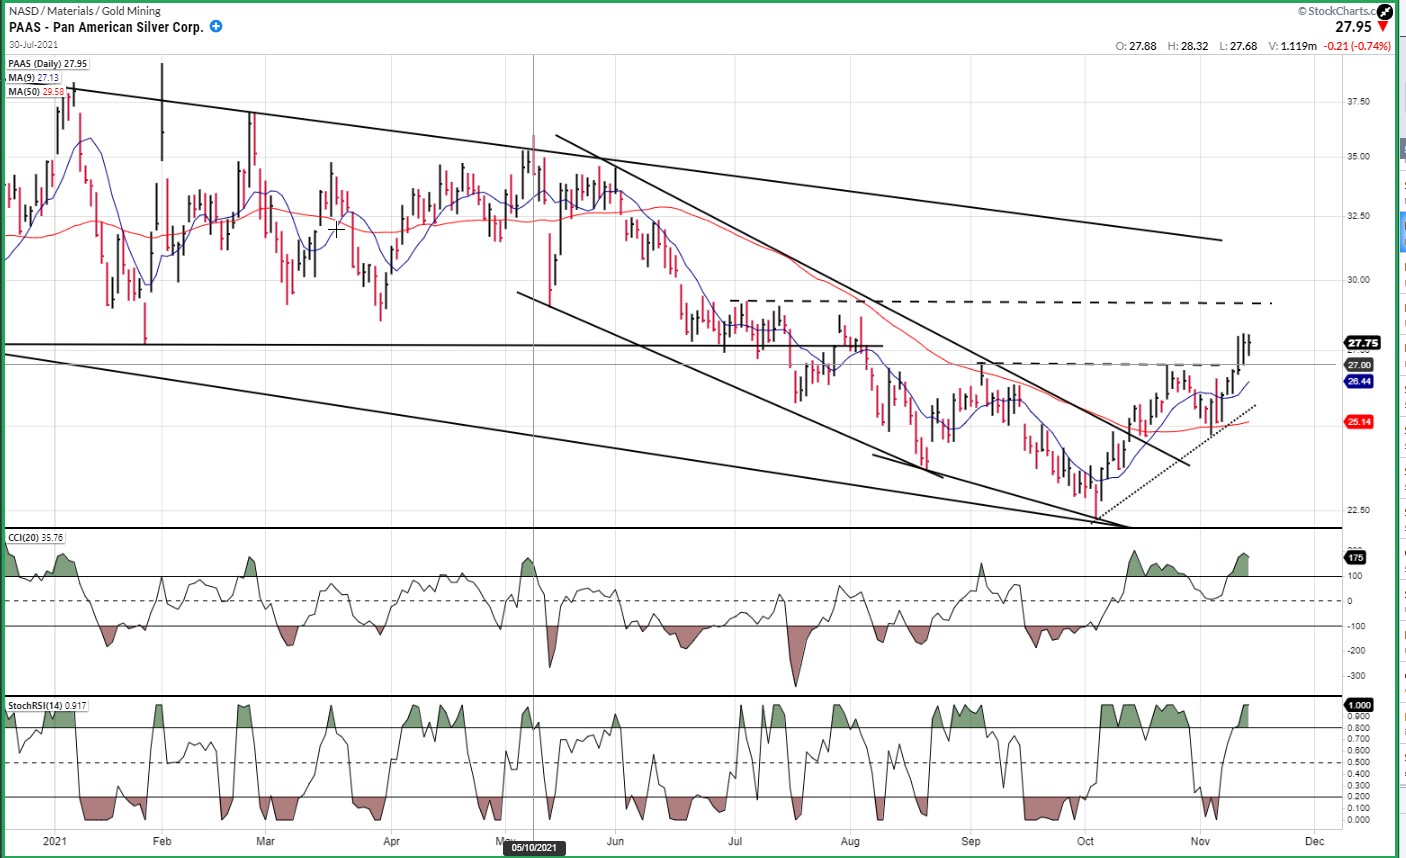
PAAS – daily
The pattern made by PAAS continues to duplicate that of GDX. Consequently, PAAS should also find temporary resistance at the next dashed trend line. If the dollar reverses its trend and starts to correct, it should help both charts to extend their current uptrends.
BNO Brent oil fund - daily
BNO retested its high and pulled back, indicating that some additional consolidation/correction lies ahead.

SUMMARY
It is likely that SPX made a short-term high at 4718 and that it will continue to correct into the current cycle low due ~11/22.
Free trial subscription
With a trial subscription, you will have access to the same information that is given to paid subscribers, but for a limited time-period. Over the years, I have developed an expertise in P&F charting (price projection), cycles (timing), EWT (structure), and general technical analysis which enables me to warn subscribers of pending reversals in market trends, and how far that trend can potentially carry. For a FREE 2-week trial, subscription options, and payment plans I encourage you to visit my website at.
The above comments and those made in the daily updates and the Market Summary about the financial markets are based purely on what I consider to be sound technical analysis principles. They represent my own opinion and are not meant to be construed as trading or investment advice but are offered as an analytical point of view which might be of interest to those who follow stock market cycles and technical analysis.
********

When Andre Gratian was a stock broker years ago, a friend introduced him to technical analysis of the market. Consequently, it is not an exaggeration to say that Andre fell in love with this approach! Ever since then, it has become an increasingly important part of his professional life. Gratian has studied the works of Wyckoff, Edwards & Magee, Edward J. Dewey (cycles) and many others. However, one of my most profitable undertaking has probably been to study Point & Figure charting, which he finds invaluable in analyzing stocks and indices. If he were restricted to one methodology, this is the one that he would choose. This well-rounded background has given him what he feels to be a special insight into the stock market, facilitating the recognition of meaningful patterns and the ‘turning points’ in all trends, whether they be short or long term. Andre feels very comfortable discussing the stock market and passing on meaningful information to others. His subscribers include individuals and money managers throughout the world. Moreover, his Newsletters are currently published on several financial sites, here and abroad.
More from Gold-Eagle


