Current Position Of The Markets


SPX: Long-term trend - Bull Market
Intermediate trend – SPX may have started an intermediate correction
Analysis of the short-term trend is done on a daily basis with the help of hourly charts. It is an important adjunct to the analysis of daily and weekly charts which discusses the course of longer market trends.
RALLY IN A DOWNTREND?
Market Overview
The Greek situation may continue to influence the market for the foreseeable future as traders wait for Sunday’s referendum results. Voters are so divided on the issue that even a “yes” vote may not put an end to the uncertainty about Greek’s future path.
From a technical standpoint, SPX held at a strong support level and has not yet confirmed that it has started an intermediate correction. But with cycles continuing to exert downward pressure on prices, even if Greece stops being a cause for concern, something else may pop up to take its place, perhaps China, or...?
In spite of the bounce, the trend remains down and we should wait to see if Monday’s trading has a material effect on the market’s positon.
Indicators survey
Weekly momentum indicators continue their downtrend with no sign of deceleration.
Daily momentum indicators had a slight bounce but not anywhere close enough to initiate a buy signal. The daily A/D indicator is showing some improvement and could even be said to display some positive divergence.
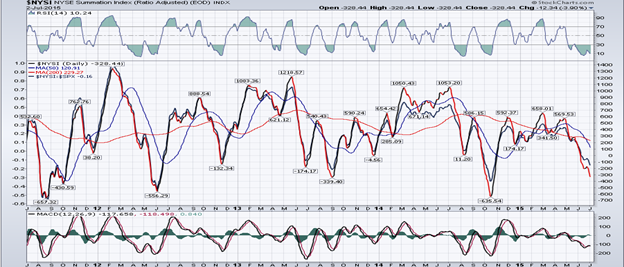
The NYSE Summation Index (courtesy of MarketCharts.com) continues on its downward course but, here also, traces of positive divergence are appearing in its indicators. The RSI is oversold and could turn at any time.
The 1X P&F came within 2 points of filling its downside projection. The rally has produced a pattern which could be additional distribution but needs clarification.
The 3X chart filled an initial projection and, by closing below 2070, may be projecting a bigger decline ahead. This would be more certain if it could close below 2040.
Chart Analysis
Last week’s call for additional weakness in the Daily SPX (chart courtesy of QCharts.com, including others below) was more than satisfied by a drop of 45 points which filled a P&F projection and was also arrested at the junction of several support lines which includes the 200-DMA. On the chart, it has been marked as “support”. I have also marked the resistance level which could stop the rally if it tries to extend beyond Friday’s high of 2085.
In last week’s letter, I had stated that a drop below 2070 would create a lower low and place the index in a short-term downtrend. For the bulls to regain control of the long-term trend, they will have to take the index past 2130, at a minimum. Until then, the index remains in a technical downtrend. So far, the counter-trend has retraced exactly .382 of its decline from 2130 but, since it has not yet given an hourly sell signal, it is possible that it could move higher. If the decline should resume but holds at the P&F count of 2052/2055 which was not fully filled in the decline, we could expect a better rally to take hold and challenge the resistance level.
A clean break below 2052 would most likely challenge the 2040 level next.
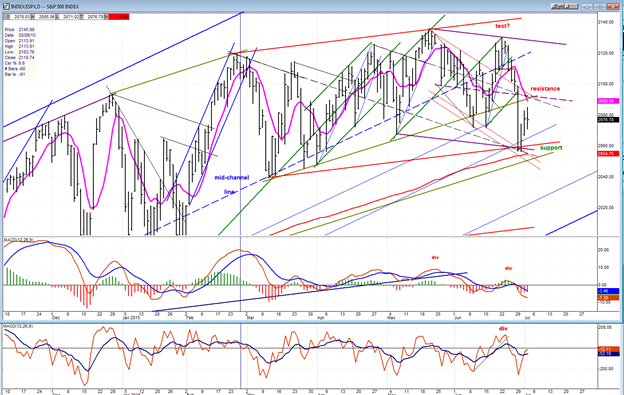
The A/D had a good bounce from an oversold level but must now extend into positive territory to
suggest that a reversal has taken place. Even so, this would still have to be confirmed by a bullish
cross in the MACD.
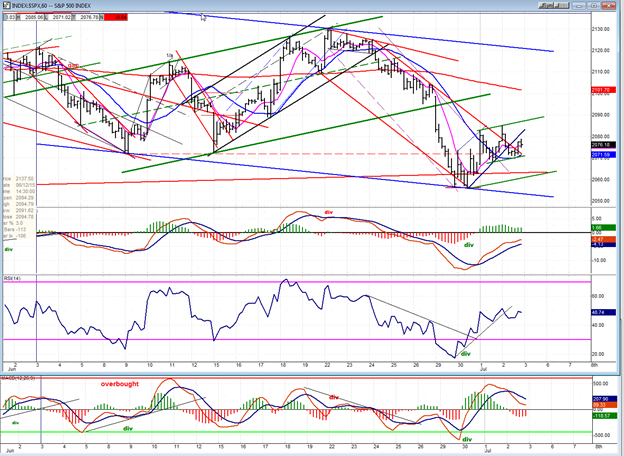
On the Hourly chart I have drawn a blue trend line across the lows and a parallel across the 2130 high in order to define the current downtrend channel which is almost flat. After what is presumed to be a rally in a downtrend is complete, this downtrend will have to accelerate if we are to convert the short-term into intermediate. Since we do not have a confirmation that the rally has ended, we’ll have to wait for one. In any case, the short-term will most likely be influenced by the results of the Greek referendum.
As of Friday’s close, none of the indicators have given a sell signal.
DOW Composite Index
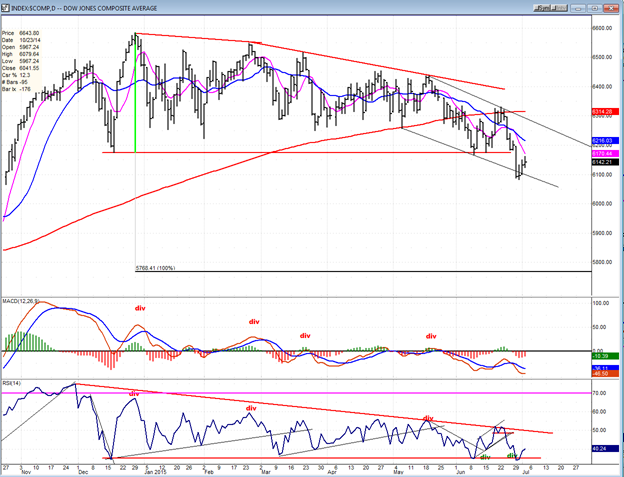
The index has penetrated its lower support line suggesting that the ascending triangle pattern
is now complete. The minimum projection for a decline out of this type of formation is the entire
width of the formation. This would give it a projection down to 5766 and should take several weeks to complete. The fact that this index has started to decline would also suggest that the other indices that make up the stock market will follow. Let’s see if this holds true.
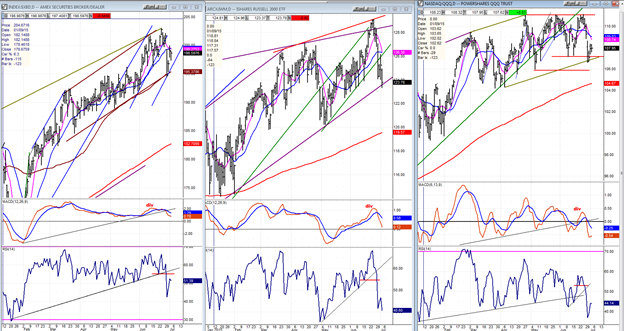
XBD – IWM – QQQ
The leaders appear to have become followers! They remain stronger than the DOW Composite and even the SPX. Nevertheless, they too responded to last week’s decline with IWM having the largest drop after being the strongest and making a new high. It also had the worst weekly close of the three.
All three indices found support on important trend lines which could hold them a little longer, but also bring about more weakness if broken. The XBD is now the strongest of the three. Their indicators are not in the best position to start a rally.
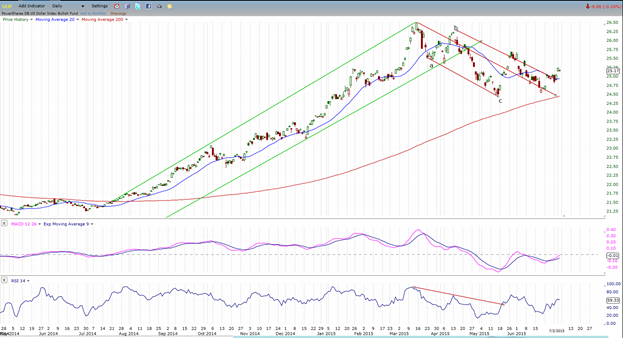
UUP (dollar ETF)
The dollar is trying to resume its uptrend. It has again penetrated its outer channel line and both indicators have turned up, but need to establish more momentum.
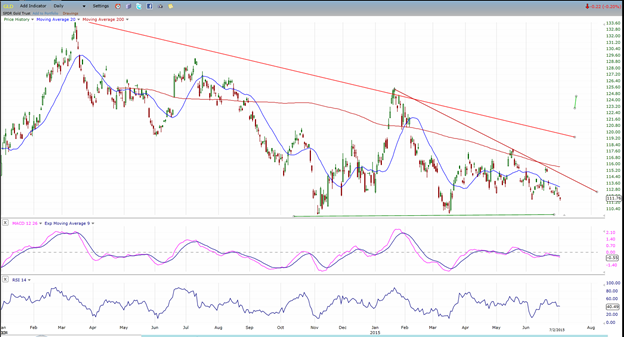
GLD (Gold trust)
GLD continued to decline last week. It is approaching the level of the two former lows. With important cycles still a week or two away from their bottoming time frame and, as you can see on the chart, the tendency of GLD to reach its low point in a selling climax, the index could quickly decline to the low 100s before making a quick recovery as it begins what could be an important uptrend of intermediate nature.
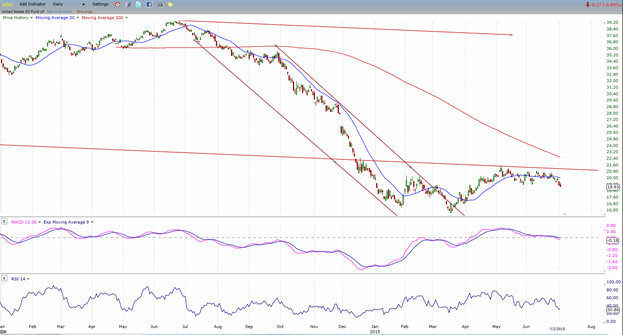
USO (US Oil Fund)
USO also looks as if it is ready to resume its decline. Its consolidation has taken a small rounding top appearance which is beginning to turn down. It’s now a question of whether it will merely re-test its low or go lower. The P&F chart does have a price projection to 13, but these are not always met exactly.
Summary
While the short-term will be affected by today’s Greek referendum, unless SPX and other indices show some real strength if they continue to rally, more downward pressure appears to be in the cards and could last until October.
********
FREE TRIAL SUBSCRIPTON
Market Turning Points is an uncommonly dependable, reasonably priced service providing intra-day market updates, a daily Market Summary, and detailed weekend reports. It is ideally suited to traders, but it can also be valuable to investors since highly accurate longer-term price projections are provided using Point & Figure analysis and Fibonacci projections. Best-time reversal estimates are obtained from cycle analysis.
For a FREE 4-week trial, send an email to: [email protected]
For further subscription options, payment plans, weekly newsletters, and for general information, I encourage you to visit my website at www.marketurningpoints.com . By clicking on "Free Newsletter" you can get a preview of the latest newsletter which is normally posted on Sunday afternoon (unless it happens to be a 3-day weekend in which case it could be posted on Monday).
The above comments and those made in the daily updates and the Market Summary about the financial markets are based purely on what I consider to be sound technical analysis principles. They represent my own opinion and are not meant to be construed as trading or investment advice, but are offered as an analytical point of view which might be of interest to those who follow stock market cycles and technical analysis.

When Andre Gratian was a stock broker years ago, a friend introduced him to technical analysis of the market. Consequently, it is not an exaggeration to say that Andre fell in love with this approach! Ever since then, it has become an increasingly important part of his professional life. Gratian has studied the works of Wyckoff, Edwards & Magee, Edward J. Dewey (cycles) and many others. However, one of my most profitable undertaking has probably been to study Point & Figure charting, which he finds invaluable in analyzing stocks and indices. If he were restricted to one methodology, this is the one that he would choose. This well-rounded background has given him what he feels to be a special insight into the stock market, facilitating the recognition of meaningful patterns and the ‘turning points’ in all trends, whether they be short or long term. Andre feels very comfortable discussing the stock market and passing on meaningful information to others. His subscribers include individuals and money managers throughout the world. Moreover, his Newsletters are currently published on several financial sites, here and abroad.


