Danger Is Creeping Up Slowly Short-Term


Gold closed the week very slightly lower. However, there are indications that more downside may be ahead. For now this downside is not seen as serious - and new highs may be expected after the short slide is over. However, surprises happen, so one must keep his eyes on the daily/weekly developments.

I usually try to keep the chart uncluttered. However, I guess I just got carried away as I started to draw trend and support/resistance lines. As I write this commentary I may or may not address all the features, may leave some for you to decipher on your own.
Gold closed the week with a slight decline of $1.20 or 0.09%, nothing to speak off. However, it’s still in the wrong direction, which does not project very well on the chart. What’s behind the inability to zoom into new highs, I’ll leave to others more attuned to what’s going on, I’ll just stick to my simple “what’s happening now” -- and not worry about the WHY.
LONG-TERM
Nothing much has changed from the long-term perspective. Therefore, I’ll go right to the rating: it remains BULLISH. That doesn’t mean that there are no cautions on the horizon, just that they are not yet of any concern. I’m watching the long-term performance of the 100 stocks in the Merv’s Gold & Silver 100 Index , which are starting to slowly lose some strength. A few weeks ago the percentage of stocks rated as positive (bullish) was in the high 90s, while this past week that percentage has dropped to 86%. Still, that’s very high - and as I said, nothing yet to worry about.
INTERMEDIATE-TERM
I could almost repeat last week’s analysis of the basic indicators. The price remains above its positive sloping moving average line. Moreover, the momentum indicator (RSI) remains in its positive zone, although below a negative sloping trigger line. Still, putting these together the intermediate-term rating remains BULLISH.
Without putting a definitive number on it, I usually define my intermediate-term as “several weeks to several months”. At the initial end, this sometimes gets confused with my short-term definition of “several days to several weeks”. We have a short-term support at the $1335 level, along with an intermediate-term up trend line at the same level. The breaking of these supports would immediately move the price below its intermediate-term moving average line for most likely a bear signal. BUT we have a reasonable short/intermediate-term support at the $1310 level. Should we break through that support, we would then have an initial Point&Figure projection to below the $1200 level…thus breaking several more support and trend lines. It would break below that third FAN trend line suggesting a reversal of long-term bull market. It would also break below my long-term moving average line. A move below the $1200 support would then project the move to new lows, below the previous December low. I’m starting to get a headache, where are those Aspirins when you need them.
All this is to suggest that there could be much action if the price should continue on the down side. Let’s keep our fingers crossed and hope the price reverses - and starts to make new highs again. Otherwise, let’s just take it one event at a time and not try to over think the trend.
SHORT-TERM
To get the short-term basics out of the way, the gold price closed the week just a hair below its short-term moving average line…although the line still has a slight upward slope. The short-term momentum indicator closed just above its neutral line…in its positive zone but below a negative sloping trigger line. By my reading the short-term rating is – NEUTRAL, the closest rating above a full bear.
Some months back readers might remember my mentioning Nicolas Darvas and his “box” pattern method of making millions in the market. Well, we have just such a “box” pattern with gold now. We have an upper resistance at the $1380 level and a lower support at the $1310 level. The breaking of either would tell us the next direction of gold prices. Hey, don’t knock it, this is from a man who made millions using this strategy. There are so many indications of potential moves in gold on this chart that I’ll just simplify things and go with the “box” pattern for now. If broken on the down side that would project, using the “box” projection, to the $1240 level.
GOLD AND SILVER STOCKS
Although gold closed slightly lower on the week the various gold and silver Indices closed on the up side, some minor and some with reasonable advances. The NYSE Arca Gold BUGS Index (HUI) closed the week higher by 1.5% while the NYSE Arca Gold Miners Index (GDM) gained 2.2%. The widely followed PHLX (Philadelphia) Gold/Silver Sector Index (XAU) gained 1.9% on the week. As for the Merv’s Indices, the average price of the 100 stocks in the Merv’s Gold & Silver 100 Index closed higher by 3.2% while the average price of the 50 stocks in the Merv’s Penny Arcade 50 Index closed higher by 5.5%.
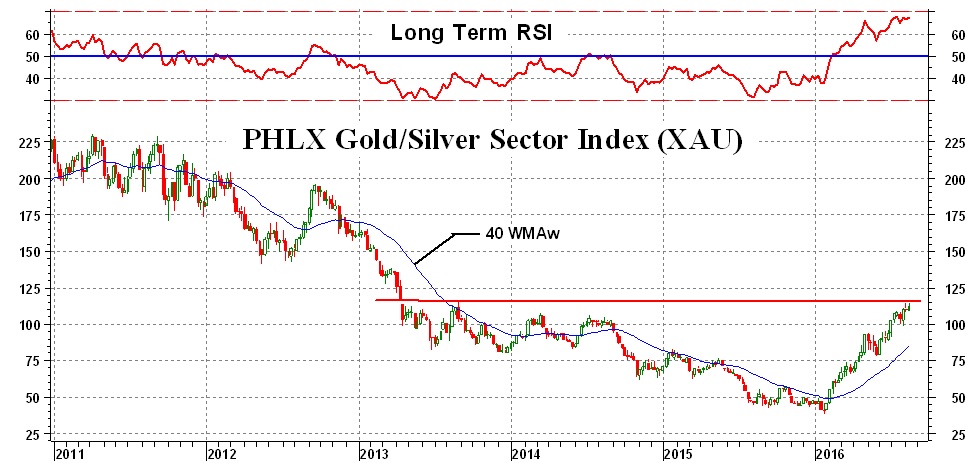
The PHLX Gold/Silver Sector Index had a long bad bear market declining some 83% before hitting bottom. From the bottom it has advanced almost 175% but has still a long way to go to reach its previous highs. By comparison, the bear market in the Penny Arcade Index ended in late 2013 with a decline of 65%. Since that low point the Penny Arcade Index has gained 927%. For a more realistic comparison, from its late December lows the Penny Arcade has gained 446%.
If one is a cautious speculator the PHLX Index ETF would give one a reasonable gain while the more gambling spirit would go for the Pennies. I don’t know of any penny ETF one can speculate with but there is a junior gold stock ETF called the Market Vectors Junior Gold Miners ETF (GDXJ) which one might try. For Canadian speculators, one might try the BMO Junior Gold Index ETF (ZJG.TO) with a similar performance to GDXJ when currency differences are taken into account.
********
Readers are invited to view my Facebook page at https://facebook.com/merv.burak where I will be slowly posting commentaries explaining in more detail my various indicators and techniques. I also present from time to time some individual stocks that look as if they may be good speculations. However, nothing I post is meant to be a recommendation to buy or sell. One should check with their broker or investment advisor before acting.
 Merv is a retired Aerospace Engineering consultant. He is also a retired market technician with over 40 years of market experience and research. Merv received his certification as a Chartered Market Technician (CMT) in 1992. Developer of many technical techniques and programs which he has been using in his previous Technically Speaking with Wil-Arm and Technically Precious with Merv commentaries posted throughout the globe. Developer of several gold and silver Indices, Merv continues to update his Merv’s Gold & Silver 100 Index and Merv’s Penny Arcade 50 Index and reviews them during his periodic on-going Technically Precious commentaries.


