Dare Thee Short Gold? No!


"Shorting Gold is a bad idea." --[mmb, 2009-to-date]
To be sure, that remains a favourite quip of ours over these many years of producing The Gold Update.
Not that the Shorts didn't have their run from 06 September 2011's high of 1923.7 down to 03 December 2015's low of 1045.4: shorting one COMEX Gold contract down that span as priced at $100/point (ex-rollover slippage and fees) produced for the would-be Short a gain of $87,830. And assuming margin required for one contract of $10,000, that equates to a +778% return. (But did ya cover?)
If rather you bought a one-ounce Gold coin at each round 100-price point on the way down, (i.e. at 1900, 1800, 1700, 1600, 1500, 1400, 1300, 1200 and 1100), given Gold's having settled out the week yesterday (Friday) at 1954, your net gain at present is $4,086 on a $13,500 investment (+30%). Or if at those same prices, having accumulated nine COMEX contracts with total requisite margin of $90,000, that investment, up $408,600 at present, is a gain of 354%. So yes, by comparison, the would-be Short "kicked ass" (technical term) percentage-wise on far less dough.
But who's smilin' now, eh? Or to again quote the late, great Richard Russell: "There's never a bad time to buy Gold." That's because its inevitable path throughout history is UP, unlike past paper capers such as Enron, International Harvester, Penn Central, WorldCom and other bombs. (By the way, how's that Amazon price/earnings ratio of 118.9x workin' out for ya ... or our "live" p/e for the S&P now at 54.5x?) But we digress...
Still, the Gold Shorts are of late again getting all titillated. And not without some near-term rationale as 'twas just last Saturday that we penned: "...Obviously any near-term technical study of your choice shows price as well 'overbought'. But more problematic is that the media -- from its high intelligentsia at the financial level down to its manipulative indoctrination at the mainstream level -- is all over Gold, and even Silver too..." And wouldn't you know it: we were informed the next day that the New York Times had just run an enthusiastic piece on the precious metals' significant rise of late. Thus as if bang on cue, Gold careened down from its new found All-Time High of 2089 of just Friday a week ago to as low as 1874 come this past Wednesday, (which for you basement-bound pajama-clad Shorts out there was a one contract gain of $21,500 or 11% given $10,000 in requisite margin ... but again, did ya cover?)
Not that Gold shan't move lower from here: for as we turn to the weekly bars, the current parabolic Long trend really is getting "long in the tooth", the blue dots having accelerated to a weekly ascent pace of nearly 40 points. Now through 21 weeks of their rising, that ties for fourth in duration since the turn of the century. Regardless, the overall broad push for Gold is UP, our sense being that 'tis far wiser to take advantage in buying near-term pullbacks rather than rolling any Short-sighted dice. Recall this past 16 March when Gold opened its week at 1564 after closing the one prior at 1515? Or how about 19 March 2009 when Gold opened at 942 after closing the prior day at 889? Shorting Gold is a bad idea. Here are the bars:

"So then, mmb, where would you take a shot?"
Squire me lad, we see initial structural support in the 1857-1820 zone, that (per the above graphic) is just below the ensuing week's 1871 level which would flip the parabolic trend from Long to Short. Gold's trading range has exceeded 100 points in each of these last three weeks; (our expected weekly trading range is at present 83 points). So barring a resumption of buying surge which would not surprise us a wit, both that zone and the en route flipping of the parabolic trend are well within range of being realized within the next week or two.
Meanwhile, Sister Silver (having finally cast aside her industrial metal jacket to don her precious metal pinstripes) rightly gives us a similar weekly bars view. 'Course, her move from the 11s during March to nearly the 30s these past two weeks tasted of nearly a triple for the Silver cat:
Next let's peek at the percentage tracks from one month ago-to-date (21 trading days) for all five of the primary BEGOS Markets (Bond / Euro / Gold / Oil / S&P). Clearly Gold was the runaway winner before being corralled somewhat back into the fold. Note, too, that the price of the Bond is actually down: perhaps a portent that interest rates have bottomed, COVID be damned? Some may see that as a Gold negative, but with the massive amounts of faux dough having been created this year ... and more on tap to come ... that as a Gold positive more than mitigates the negative, near-term price pullbacks notwithstanding:
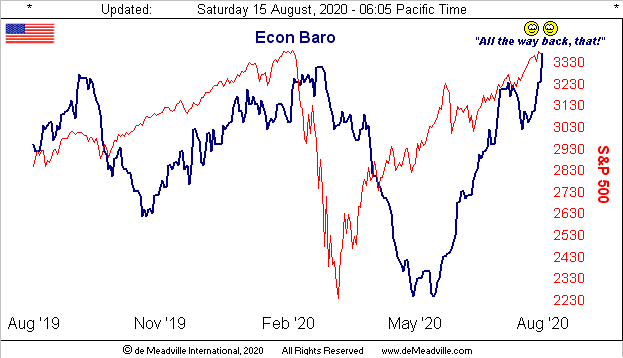
As for upstanding, have a look at the Economic Barometer. The past week's busy calendar of 16 metrics found 13 of them to be net positive for the Baro, the three negatives being slowdowns in both July's Retail Sales growth and Export Price increases, along with less working down of June's Business Inventories. But the balance of the data included robust turnarounds in July's wholesale inflation and Q2's Productivity, the week's highlight being first-time Jobless Claims coming in sub-one million for the first time since those for the week ending 14 March. Still at 963,000 Claims, this past week's report is more than four times as poor as 2019's weekly average of 219,000 Claims. But the trend is improving as is that for the Econ Baro overall, which has now oscillated to a peak above those created pre-COVID:
So StateSide we may be rebounding, but over in the United Kingdom, their recession data is reported to be the worst of the world's major economies, whilst further 'round the globe China's wobbly recovery also is cause for worry.
And specific to the stock market as above depicted in the Econ Baro graphic by the S&P 500's red line, it is looking ever so toppy. We've already mentioned our "live" S&P p/e calculation is at present 54.5x. That's not surprising given (with a week yet to run in Q2 Earnings Season) only 34% of the Index's constituents have improved their bottom lines over 2019's Q2. 'Course with COVID, 'tis all about Q3, Q4 and next year. Moreover, by three classic textbook technical measures (Bollinger Bands, Stochastics and Relative Strength), the S&P is (understatement) "severely overbought". And the elusive 3394 high (of 20 February) remains just that, the Monday through Friday highs of this past week chronologically being 3363, 3381, 3388, 3387 and 3379. Indeed, quintessentially toppy.
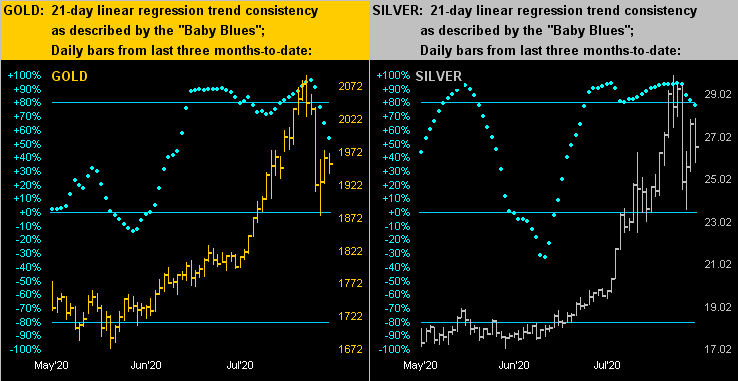
But having already passed below their tops for now are the precious metals' prices as we turn to these past three months-to-date charts of daily bars for Gold on the left and Silver on the right. Not to exacerbate the excitement in the Shorts' emotions, but you regular readers herein and at the website know that when those baby blue dots break below their +80% axes as we see here, the rule rather than the exception is the expectation for lower price levels near-term. (Or perhaps better stated, buying opportunities). But again more broadly, the trend for the PMs is UP, something of which not to lose sight:
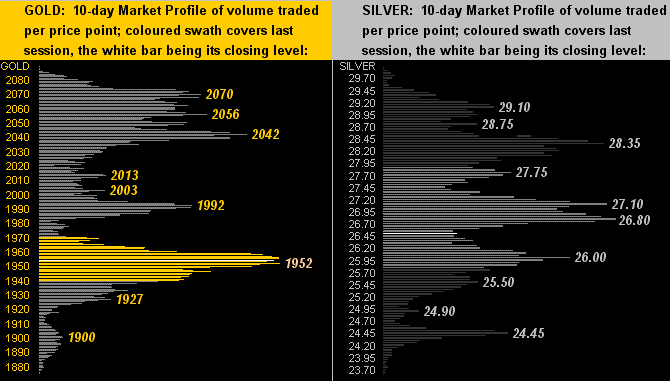
As for their performances across the past fortnight, here we've the 10-day Market Profiles at left for Gold and at right for Silver. For the yellow metal, there's not much underlying support by this construct, whereas there is more so for the white metal. Perhaps Sister Silver can grab a hold of Gold such as to provide support:
Either way, many thought we'd never see the day to find Gold as now positioned in its stack:
The Gold Stack
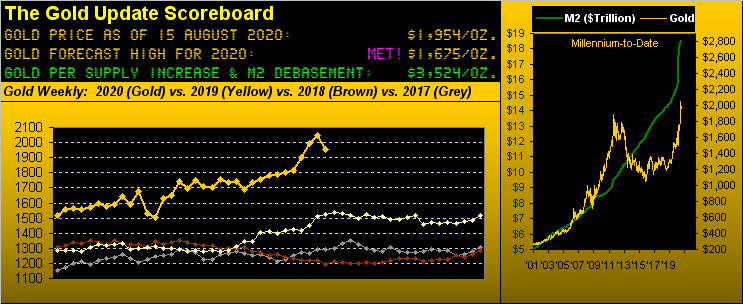
Gold's Value per Dollar Debasement, (from our opening "Scoreboard"): 3524
Gold’s All-Time Intra-Day High: 2089 (07 August 2020)
2020's High: 2089 (07 August 2020)
Gold’s All-Time Closing High: 2075 (06 August 2020)
10-Session “volume-weighted” average price magnet: 1999
Trading Resistance: 1992 / 2042 / 2056 / 2070
Gold Currently: 1954, (expected daily trading range ["EDTR"]: 52 points)
Trading Support: 1952 /1927 / 1900
The Gateway to 2000: 1900+
The Final Frontier: 1900-1800
10-Session directional range: down to 1874 (from 2089) = -215 points or -10.3%
The Weekly Parabolic Price to flip Short: 1871
The Northern Front: 1800-1750
On Maneuvers: 1750-1579
The 300-Day Moving Average: 1594 and rising
The Floor: 1579-1466
Le Sous-sol: Sub-1466
The Support Shelf : 1454-1434
2020's Low: 1451 (16 March)
Base Camp: 1377
The 1360s Double-Top: 1369 in Apr '18 preceded by 1362 in Sep '17
Neverland: The Whiny 1290s
The Box: 1280-1240
Well wrap it for this week with a whack and a thanks.
■ The Whack: a week back we took a whack at Reuters over their completely convoluted headline with respect to a weak jobs recovery powering ahead. But this past Tuesday they really stepped in it by publishing "S&P 500 futures hit record high ... topping an all-time high of 3,372.25 points last hit on Feb. 20." Wrong. The Feb 20 high was 25 points higher at 3,397.50. As a long-time trading colleague mused, the once venerable news agency has perhaps reduced its writing recruits to kids straight out of high school, (many of whom we understand -- at least StateSide -- are comprehensively math-deficient).
■ The Thanks: a week back we herein made our Big Announcement on staying the course for The Gold Update toward price reaching currency debasement value. The outpouring of thanks from so many of you was the largest influx of email etc. we've ever received across the 12 calendar years of penning these weekly missives. So in return, again our enormous THANKS to all of you, our readers, linkers and re-publishers for making this venture what it has become. It all truly means more than you know, it really does.
www.deMeadville.com
www.TheGoldUpdate.com
********

Mark Mead Baillie has had an extensive business career beginning in banking and financial services for two years with Banque Nationale de Paris to corporate research for three years at Barclays Bank and then for six years as an analyst and corporate lender with Société Générale.
For the last 22 years he has expanded his financial expertise by creating his own financial services company, de Meadville International, which comprehensively follows his BEGOS complex of markets (Bond/Euro/Gold/Oil/S&P) and the trading of the futures therein. He is recognized within the financial community of demonstrating creative technical skills that surpass industry standards toward making highly informed market assessments and his work is featured in Merrill Lynch Wealth Management client presentations. He has adapted such skills into becoming the popular author each week of the prolific “The Gold Update” and is known in the financial website community as “mmb” and “deMeadville”.
Mr. Baillie holds a BS in Business from the University of Southern California and an MBA in Finance from Golden Gate University.
More from Gold-Eagle


