Does Dow Theory Still Work?


A noteworthy event happened during an otherwise pedestrian period earlier this month. The Dow Jones Transportation Average (DJTA) rose to new highs for the year, exceeding the performance of the Dow Industrials (DJIA). This development certainly excited the Dow Theorists since they view leadership in the Transports has a precursor to strength in the Industrials.
Indeed, one of the noteworthy tenets of the venerable theory first articulated by Charles Dow in the 19th century, and later refined by his disciple Robert Rhea, is that the “Dow Transportation Average must confirm the Dow Industrial Average.” Modern day exponents of the Dow Theory have refined it to include the adage that leadership in the Transports is usually, though not always, a bullish leading indicator for the Industrials. This relationship has a caveat, however, as we’ll discuss here.
The basis of Dow Theory is that since the transportation sector is the essential mover of manufactured goods from one point to the next, it therefore follows that “as go the transports, so goes the manufacturing sector.” Historically, a failure to confirm a rising trend in the Dow Jones Industrial Average (DJIA) by the Transports has been viewed as a harbinger of weakness for the broad market.
To be sure, Dow Theory isn’t without its notable exceptions. The most notable deviation from the normal relationship between the Transports and the Industrials occurred in mid-July 2007, when both the DJTA and DJIA made new all-time highs. The Industrials then went on to make another new high – the final one until 2013 – in October 2007 while the Transports failed to confirm it. This non-confirmation signal was followed shortly thereafter with the commencement of the credit crash.
The opposite of this scenario occurred in July 2011, when the Dow Transports made a token new high while the Dow Industrials failed to confirm it. By the end of that month, both averages had begun a precipitous plunge in what proved to be the biggest setback of 2011.
Yet by early February of the following year – just seven months later – the Dow Industrials surprised many investors by climbing to new highs. The DJIA continued its impressive ascent until September that year while the Transports mostly lagged.
A similar pattern occurred that momentous year of 2013. As the Dow Industrials went sideways for a five-month period between May and October, the Transports were making a series of higher lows and higher highs. This consistent showing of relative strength eventually gave way to a powerful breakout in the Dow Industrials late in the year.
Yet another instance of the Transports preceding the Industrials in a major move was seen only two years ago. During the spring and summer of 2015, the DJTA was steadily trending lower even as the Dow Industrials were range-bound near their highs. The action in the Transports once again proved to be a prescient signal, for in August the Industrials experienced a frightful plunge.
Almost every important intermediate-term move in the Dow Industrials, up or down, was in fact presaged by the action of the Dow Transports. So the answer to the question, “Is Dow Theory still relevant in the 21st century?” is a resounding “yes!” That said, what is the action of the DJTA telling us to expect for the broad market outlook going forward?
The previously mentioned new high in the Transports earlier this month so far is a token high and not a decisive thrust to significantly higher levels. Historically, the most reliable intermediate-term Dow Theory signals occur when the Transports significantly outperform the Industrials on a sustained basis over a period of several weeks-to-months. As can be seen in the following graph comparing the recent action of both averages, the Transports haven’t yet begun conspicuously outperforming the Industrials. It’s too early, then, to make any definite inferences based on Dow Theory.
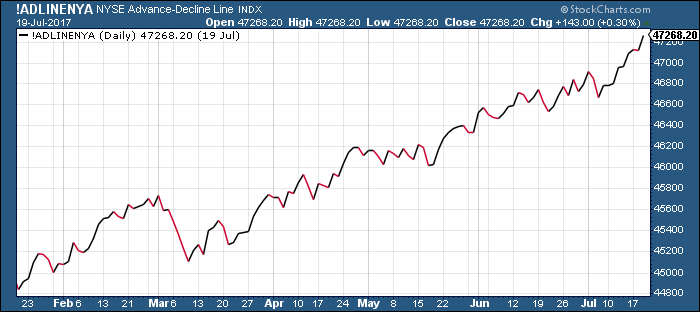
There are, however, a number of favorable omens which portent the bull having plenty of room to run. Breadth, volume and internal momentum have also shown definite improvement in the short term after a languid 6-week period since the start of June. Leading the way have been the NYSE A-D line and the cumulative 52-week new highs-lows. The A-D line has even been leading the advance to new highs, which is encouraging.
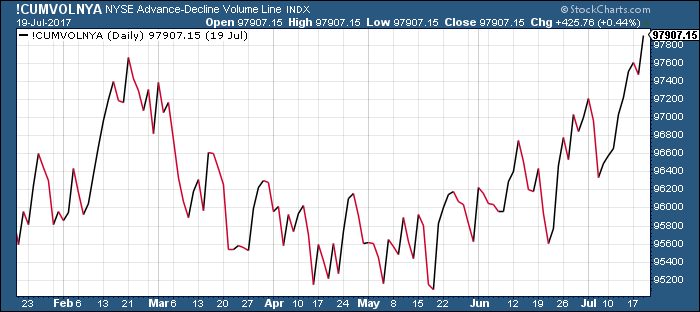
Even more encouraging is the fact that NYSE cumulative volume is finally catching up to confirm the latest advance in the major averages. With both volume and breadth now confirming, the bulls will have their best opportunity in a while at securing control over the near-term trend in several weeks.
Following a broad market correction there are five things we typically look for to confirm that the market’s internal condition has been completely repaired and that higher prices are warranted. Granted, the latest “correction” was internal and sector-specific rather than a major decline in the averages. But if the internal correction we talked about in the previous report has served its purpose of wringing out the excess heat generated during the previous run up, then we’ll know about it shortly. The list of basic requirements for a confirmed market bottom is listed below. It’s based in part on the list originally devised by technical analyst Art Huprich, which I’ve relied on for years at market bottoms. It has proven to be a worthy checklist over time.
-
Do the major averages [viz. the Dow Industrials and Transports] move in sync?
-
Does the NYSE A-D line move in-line and preferably outperform?
-
Does volume confirm? Expanding volume is an indication of institutional activity.
-
Does sentiment remain negative, or at least neutral?
-
Does the number of NYSE stocks making new 52-week lows shrink below 40?
The answers to each of these questions can be answered in the affirmative, which means that so far the indications are favorable for the bulls to retain control. It’s now up to them to consolidate their latest victory rally and pressure the shorts into covering – something they’ve lacked the will to do in recent weeks. The market’s internal currents are starting to move in their favor, however, which should make their task easier.
Mastering Moving Averages
The moving average is one of the most versatile of all trading tools and should be a part of every investor’s arsenal. Far more than a simple trend line, it’s a dynamic momentum indicator as well as a means of identifying support and resistance across variable time frames. It can also be used in place of an overbought/oversold oscillator when used in relationship to the price of the stock or ETF you’re trading in.
In my latest book, Mastering Moving Averages, I remove the mystique behind stock and ETF trading and reveal a completely simple and reliable system that allows retail traders to profit from both up and down moves in the market. The trading techniques discussed in the book have been carefully calibrated to match today’s fast-moving and sometimes volatile market environment. If you’re interested in moving average trading techniques, you’ll want to read this book.
Order today and receive an autographed copy along with a copy of the book, The Best Strategies For Momentum Traders. Your order also includes a FREE 1-month trial subscription to the Momentum Strategies Report newsletter:
http://www.clifdroke.com/books/masteringma.html
Clif Droke is a recognized authority on moving averages and internal momentum. He is the editor of the Momentum Strategies Report newsletter, published since 1997. He has also authored numerous books covering the fields of economics and financial market analysis. His latest book is Mastering Moving Averages. For more information visit www.clifdroke.com
********
More from Gold-Eagle


