Dow Jones And Weird Volatility & Volume


The Dow's 8-count is simply the number of days the Dow Jones moved 2%, or more from the previous day's closing price in a running eight day sample. Whether the Dow Jones moves up or down 2% makes no difference. The 8-count is an indicator of market volatility, identifying periods of extreme volatility seen in bear markets, as shown by clusters of 2% days in the Dow Jones 8 count, such clusters are Mr Bear's calling card.
From 02 August to 09 December 2011 (four months), the Dow Jones' 8-count was at least one, or higher, peaking at a level of six 2% days in a running 8-day count on 11 August while the Dow Jones was declining 13% from its 29 April 2011 peak. That's a lot of Dow Jones' 2% days for just a 13% decline in the Dow.
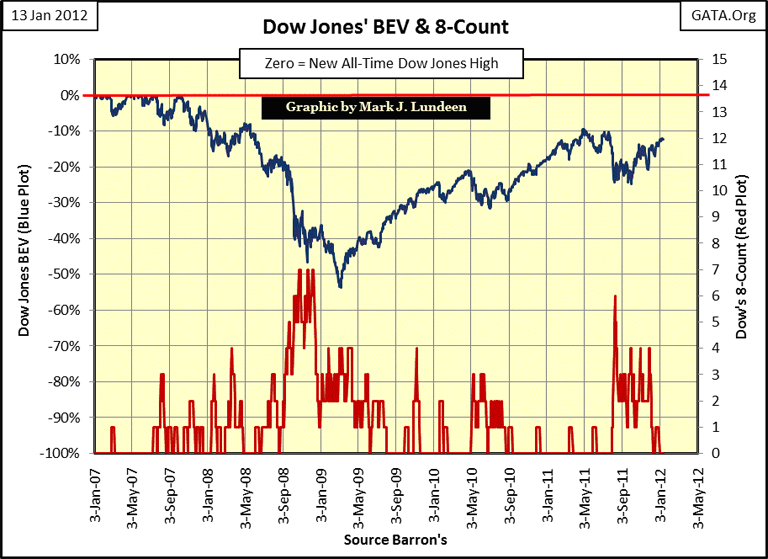
To better illustrate relationship between the Dow Jones 2% days and deep declines in the Dow Jones, let's expand the count from an 8 day to a 200 day running sample (or count), and plot the results from 1900 to 2011 (112 years). During the period from 1900 - 20, having thirty Dow Jones 2% days in a 200 day running sample virtually guaranteeda massive 40% bear market. The Roaring 20s bull market saw very few Dow Jones 2% days, until those nasty Dow Jones 2% days began piling up in January 1929. By Black Tuesday (29 October 1929), the Dow Jones had declined 40% from its highs of September, as its 200-count increased to just 25; quite a difference from our current 200-count of 32, which produced a decline of only 16% in the Dow Jones from April to September 2011.
Today we see far smaller market declines on higher volatility. What could account for this? Intervention by the Plunge Protection Team (PPT) to manage market volatility is one possible explanation. As the Great Depression bear market bottomed in July 1932, the Dow Jones was experiencing a 2% day every other day. The only other period in market history in which volatility approached such levels was in the fall of 2008 when the Dow Jones was experiencing two 2% days a week at the peak.
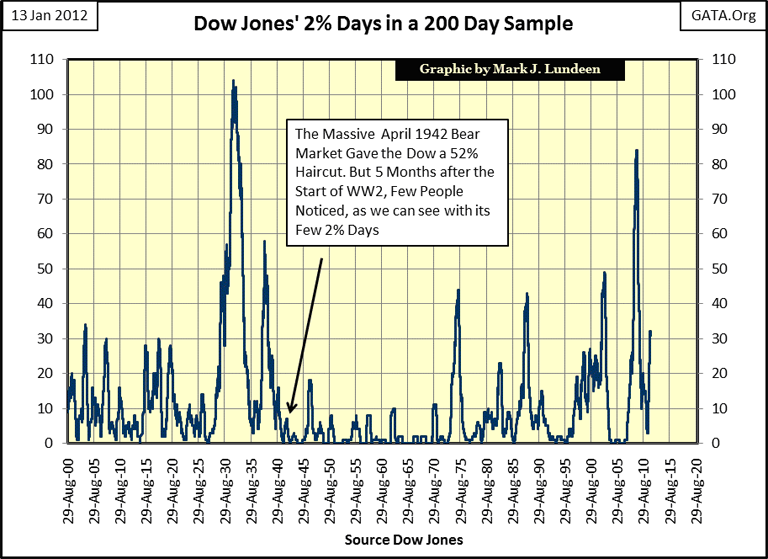
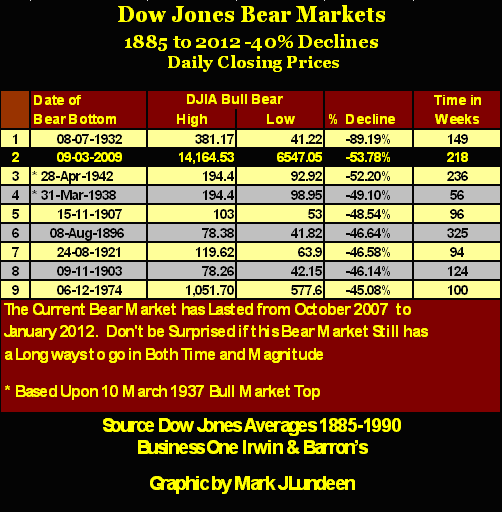
But there's no need to make this point in tedious detail. The following table lists the big 40% bear markets since 1885. With the sole exception of the 1942 market bottom, each post 1900 bear market bottom produced a spike in the plot above. But note that there are also spikes not listed in the table below. These are Dow Jones bear market bottoms that declined by less than 40%. For example, the October 2002 Tech Wreck's 37.85% decline; which peaked at 49-Dow Jones 2% days in a 200 day running sample.
By the way, I use an 8-count as a research tool to forecast market moves in my daily work since the 200-count typically peaks months after the actual bottom in the Dow Jones. But when looking at historical charts spanning many decades, the 8-count becomes cluttered and unreadable, so the 200-count is used.
Returning to my chart of the Dow's 200-count, it's a point of interest that in 2011, the Dow Jones declined a mere 16% while the 200 count climbed to 32-Dow Jones 2%-days in a 200 day running sample. Sure, the third biggest Dow Jones bear market in 1942 had almost no 2% days in its 200 day sample, but this bottom occurred just five months after Pearl Harbor, and two and a half years after the start of a world war. In 1942, most people had better things to follow in the daily news than the stock market. So what could explain the Dow Jones' insignificant 16% decline as its 200-count increased to 32, since last April?
Bull and bear markets leave their own unique finger prints on the stock market. Bear markets are noted by the increase in volatility in the daily price moves in stock, while bull markets experience an increase in trading volume as liquidity flows into share prices.
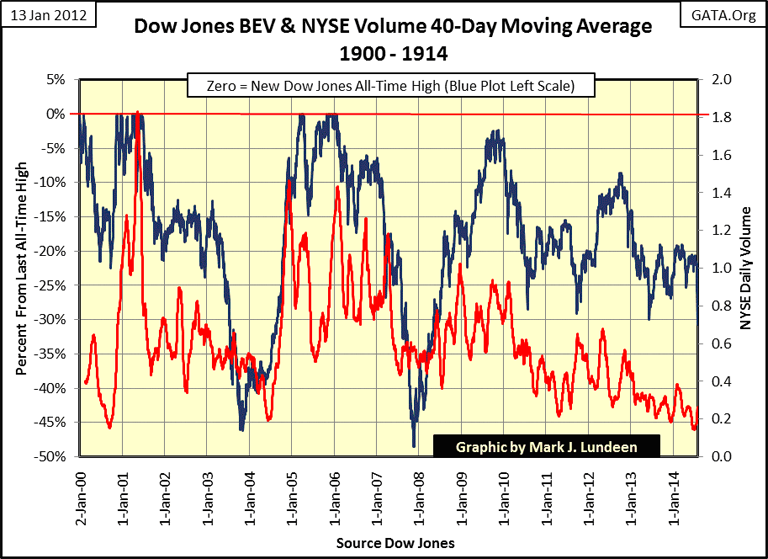
Here's a BEV chart for the Dow Jones, plotted with the NYSE daily volume's 40 day moving average for the first fourteen years of the 20th century. Don't confuse this data with a chemistry experiment. Market analysis is not a precise science fixed by mathematical relationships. With that said, the data does illustrate that increased market participation in the market (indicated by rising volume), supports rising stock valuations. Bear markets on the other hand are marked by a decline in volume as people take what is left of their money and go home.
From 1966 to 1981, the Dow Jones attempted to breach 1000 five times, and failed. From 1966-73, it's true thatvolume was rising on its first three attempts to cross 1000. But unlike what we see above, volume from 1966-73 didn't increase by factors of five or more on any of the Dow's attempts to break 1000.
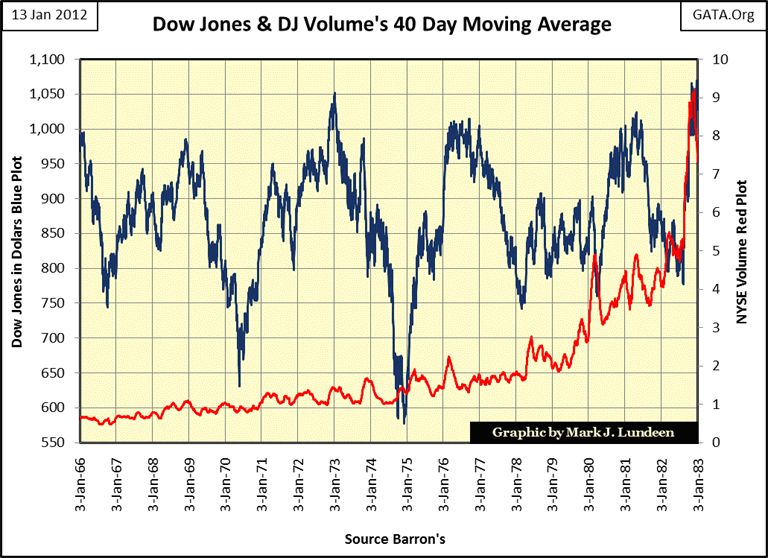
Even after 1975, the Dow Jones still couldn't hold on to 1000; BUT rising volume did mitigate the declines from 1000.Then, in 1982, the Dow Jones finally took out 1000, and began a massive bull market on an explosion of trading volume, as people took money out of their savings accounts, and began buying stocks.
Are you seeing a pattern here? Explosions in volume are bull market events, and contractions in trading volume occur in bear markets! If it seems I'm beating this point to death, you'll soon see why.
Let's examine the Dow and trading volume from 1980-96. Remember, in a Bear's Eye View (BEV) plot, every new all-time high is recorded as a Zero%, and from 1982 to 1996, we see the Dow Jones going from one new all-time high to another, as trading volume increased by a factor of eleven.
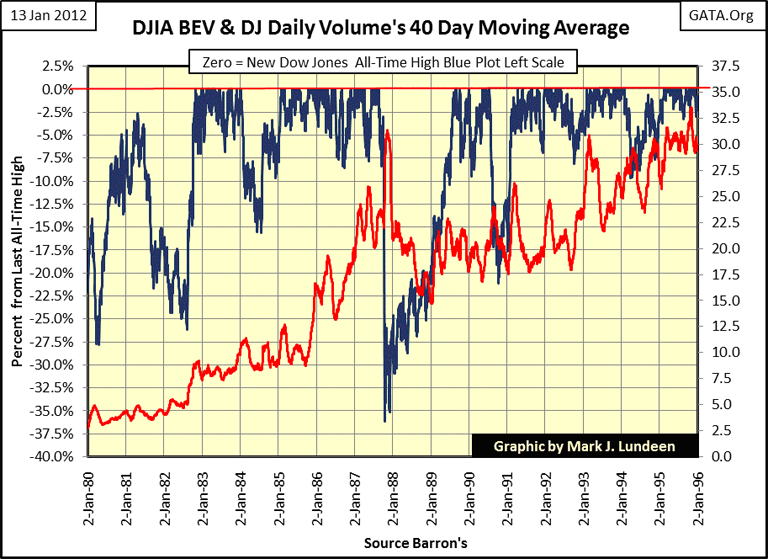
But after the high-tech top in 2000 in the chart below, the 100 year market relationship between the Dow Jones and trading volume inverted! For the past eleven years (chart below), we have seen the Dow Jones * decline * on expanding trading volume, and the Dow Jones now * advances * as trading volume stagnates, or actually contracts. How could that be explained?
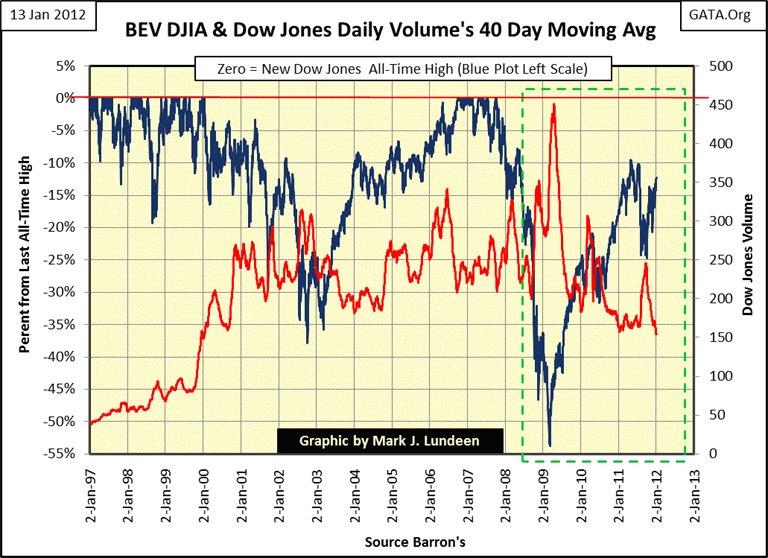
I'll tell you how, the Federal government is using inflationary funding from the Federal Reserve, which is diverted to the big banks, to prop up valuations in the stock market when the financial markets are in a decline. Small wonder the Dow Jones is having problems with taking out its highs of October 2007, or even makinga new credit-crisis high; the rising volume we've seen since 2000 isn't from bullish sentiment in the market, rather it's due to "market management" as a covert official "policy" to avert economic crisis. The "policy makers" goal is not to reignite the bull market, but to sooth the frayed nerves of voters when the major indexes decline.
That is quit a theory Mark; accusing the US government of conspiracy in a giant market manipulation scheme, and the New York banking establishment of trading on insider information. Well, all I know is what I hear on TV, and on 17 September 2001, George Stephanopoulos said the following on Good Morning America.
"Well, what I just want to talk about for a few minutes is the various efforts that are going on in public and behind the scenes by the Fed and other government officials to guard against a free-fall in the markets...perhaps most important, there's been--the Fed in 1989 created what is called a plunge protection team, which is the Federal Reserve, big major banks, representatives of the New York Stock Exchange and the other exchanges, and there--they have been meeting informally so far, and they have kind of an informal agreement among major banks to come in and start to buy stock if there appears to be a problem. They have, in the past, acted more formally"
- George Stephanopoulos, former Clinton adviser September 17, 2001 on ABC Good Morning America
Now George may have broken this news in September 2001, but if you go back and look at my last chart above, it's very obvious that the price fixing scheme he informed the public of, actually began twenty months before in January 2000. And the "Plunge Protection Team", * as Mr Stephanopoulos called them * has continued managing price declines in the stock market ever since. Geeze Louise, the April to August decline in the Dow Jones did so on an up-spike in trading volume, and after the Dow Jones was once again managed upwards, trading volume once again declined.
How long will this fraud last? I don't know, except that it certainly can't go on forever. Since before the October 2007 top, I've been predicting that the stock market was going to see another Great Depression era decline as a result of intrusive market "policies" by the best and brightest in government, banking and academia. One thing for sure, thanks to the inflationary "monetary policies" of the managers of the World's reserve currency, America's financial markets no longer serve as a price discovery mechanism, but as tools for manipulating the price of financial assets for political purposes. When the rig on the stock market finally falls apart, the lows of March 2009 will be taken out pretty damn quickly.
The elimination of gold from the world's money supply will prove to be the most devastating social development of the past forty years. Before 1971, banks used credit to foster profitable capital formation and inventory management. This system of a restricted money supply (the gold standard) forced banks to share their profits with savers, on whose deposits the banks depended for their working capital. The gold standard had its problems as all human institutions do, but the steady growth of the American economy, and the true prosperity for the average citizen in the United States from its founding up until 1971, was in good measure due to the honest banker's skill in managing other people's money for the benefit of all. Unfortunately, after two decades of Alan Greenspan's chronic "injections of liquidity" to save the criminals now in charge of the global economy, the honest banker is as rare as the Dodo bird.

Banks no longer have any beneficial function in society; not when they offer savers a measly 0.50% or less on deposits. Today, the only use banks have for human contact is when people apply for a mortgage, auto loan or a credit card account. The unavoidable fact is that ever since the banking system began funding their operations with inflation from the Federal Reserve System, and not from the thrift of the general public; our world began changing for the worse. The public's continued participation in the casino known as the stock market is based on the reality that there is no other option. Depositing one's savings in a bank makes no economic sense, if one's goal is to create future wealth!
Mark J. Lundeen
[email protected]
[email protected]
More from Gold-Eagle


