Dueling Forces


Critical underlying support: $312
Critical overhead resistance: $320
December gold futures are nearing have reached extremely critical turning point and will be forced to make a decision this week that will make the difference between a broad upward swing to new highs or a decline to test recent lows near $300.
The daily gold futures chart is a classic example of "dueling forces," or the conflict between the bulls and bears. This is a beautiful pattern that we've seen before in recent years, although it's less common that it was in the late '90s. That's mainly because most financial markets have been in a bear market since late '99/early '00 and the pattern currently visible in the daily gold chart is a bull market pattern. It's also the kind of pattern that will literally make or break a market as it represents two powerful forces vying for control of the market with only one winner. And the winning side typically will get its way for a long time to come.
Let's examine the year-to-date daily gold futures chart (below), a remarkable study in market forces.
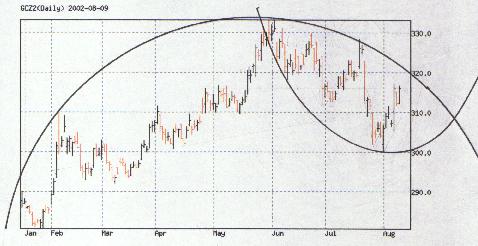
Note the parabolic bowl that has formed since the late May peak and recently passed the "vertex," or mid-point. Now notice the much larger circular curve, representing the forces of supply combined with the dominant interim time cycle that governs gold price movements. As we mentioned above, this particular pattern used to be visible in a lot of markets, most notably the market for T-bond futures between 1998-2000. Take a look at the following chart which illustrates this "dueling forces" principle (chart courtesy P.Q. Wall Forecast, November 1999, P.O. Box 15558, New Orleans, LA 70175).
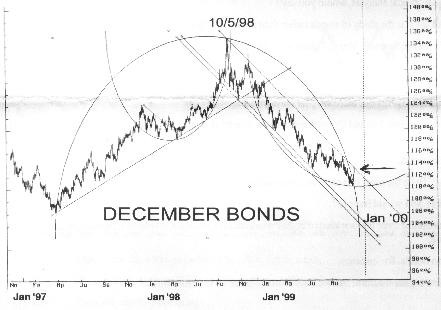
In the case of bonds, the notable dome in its chart back then was similar to that in gold's present chart. Take note of how bond prices peaked to the right-of-center within the dome, just like gold prices did recently. This was indicative of the underlying bullish trend of bond prices which, although the late '98 highs have not yet been exceeded, shows that the January 2000 bottom indicated by the parabolic bowl in the foregoing chart was indeed the bottom for quite some time as bond prices rallied strongly for several months thereafter.This is almost exactly the same position gold futures are in right now, the parabolic bowl within the larger dome, with an impending breakout on the immediate horizon.
Only one side will win, and the winner will likely be apparent by the end of this week. For the bulls to win, December gold must close above $320, which would in effect puncture the dome. Whenever domes of this magnitude are broken it nearly always leads to a runaway upside run. In gold's present case, breaking the dome above $320 would almost certainly lead to a test of the recent highs around $330.
In order for the bears to win, gold must reverse this week and burst through the rim of the parabolic bowl in the daily chart. When bowls are broken, it nearly always leads to a major decline. In fact, if gold closes below $310 this week, that would be a preliminary signal that a test of $300 is almost certain to follow since this would be a sign of great weakness since $310 is an extremely important chart support and a pivotal point.
So which side is likely to win out in the gold market? Here are three preliminary clues:
- Gold prices peaked beyond the mid-point of the circular dome in the daily chart to the right of center. This typically means gold is still undergoing a bull market since cycle peaks in bull markets are less precise and prices tend to peak a bit beyond the underlying time cycle peak due to the dominant upward trend in market prices.
- In the case of the parabolic bowl between June-August, prices peaked almost precisely in the center of the bowl, which is typically bullish. A weak market tends to bottom to the right of center of a parabolic bowl and is a precursor to an eventual breakdown. But when prices bottom square in the middle it shows the dominant cycles have a bullish bias since cycle bottoms are most precise in bull markets and less precise in bear markets. This explains why prices tend to bottom in the dead center of bowls (which represent cycles).
- Platinum futures, a leading indicator for gold, has broken out of its recent downward trend and has rallied for five straight sessions. Along the way it has broken through two overhead layers of supply and has only one more supply layer to overcome before its bull market is re-established. Platinum could well be leading the way for gold.
More from Gold-Eagle


