Economic Growth Isn't What It Used To Be
“Economic growth” is a favorite topic of government economists; people who find signs of “growth” everywhere they look. But they base their public research from the beginning of the Obama administration, which corresponds with the bottom of the 2007-2009 credit crises. Choosing an extreme downturn as your starting point makes it easy to find signs of recovery after untold trillions of dollars have been injected into the economy. This approach is known as “data mining,” and gives a distorted picture of what is actually happening. To see the reality of today’s so called “growth,” we need to expand our examination of economic growth to past decades; only then does it become obvious that actual economic growth as the United States once knew it has become a thing of the past.
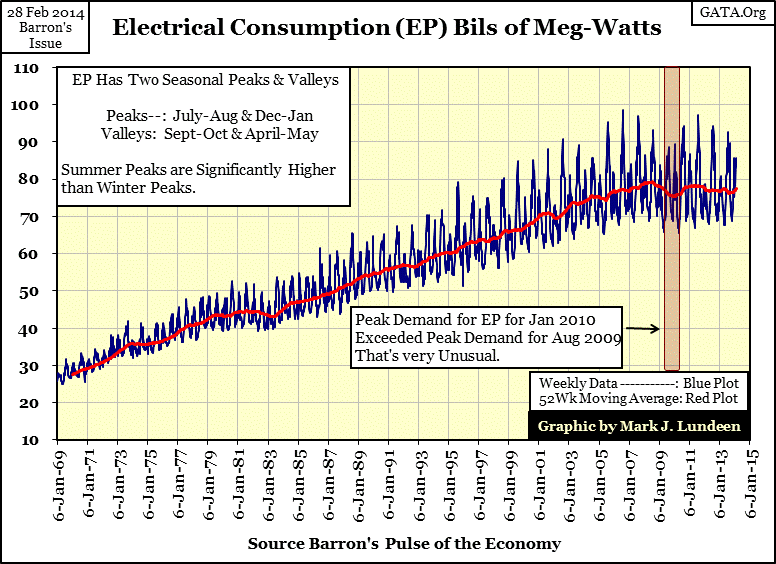
Here’s a look at US electrical power (EP) consumption from 1969 to 2014. EP consumption is one of the best ways to measure actual economic growth as not much happens in the economy, (from industrial production to trends in consumption) that doesn’t run on electricity. Because of seasonal demands in EP (cooling in the summer, heating in the winter), the chart has two plots. The as published data (Blue Plot) oscillates above and below its 52Wk moving average (Red Plot). This chart makes clear that from 1969 to 2008, real economic growth was a fact, something not seen since that time.
EP’s weekly high point was reported in Barron’s 14 August 2006 issue. 2006 must have been a particularly hot summer, but since then, declining demand for EP during the summer peaks suggests that North America has been cooling. The thin red box contains two peaks in EP, with peak demand for electricity in January 2010 actually exceeding peak EP demand in August 2009. Having a winter’s peak exceed the previous summer has never happened before. The last peak in the chart is for our current winter and it is huge! Since the beginning of December (13 weeks) demand for EP has been in the highs 70s to mid-80s. As this data is national, not a regional sample of power demand, demands on the power grid are an excellent measure of how long and cold this winter has been for the United States as a whole.
To smooth out the seasonal variations, I use a 52Wk moving average; it peaked in August 2008, just weeks before the sub-prime credit crisis became painfully evident to everyone. Since then, slack demand for EP suggests that the United States has been in a prolonged and deep recession.
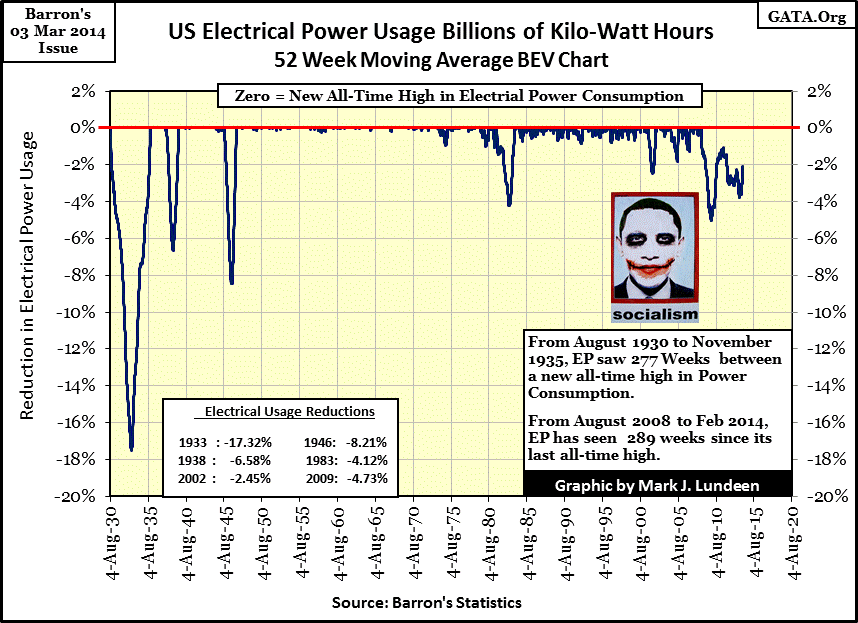
The best graphic to display economic demand for EP is EP’s 52Wk moving average shown in Bear’s Eye View (BEV) format below. Remember, each BEV Zero (0.00%) is a new all-time high in demand for electrical power. Remarkably, for the 26 years from 1947 to 1973, new all-time highs (0.00%) in demand for EP were recorded every week, with very few exceptions. Weekly data points that were not a new all-time high are shown as negative percentage declines from the previous all-time high. Take the 1933 decline as an example; during the Great Depression, demand for EP declined by 17.32% from August 1930’s 52Wk M/A peak, a clear sign of a suffering economy. In fact, each 1% or greater decline in EP below was associated with economic hardship; the only exception was the 1946 8.21% decline. The decline in 1946 resulted from retooling the economy to peacetime production, which was labor intensive, so good for employment.
A quick look at the plot above also shows just how different the post August 2008 decline has been from all previous declines in EP. They dropped, bottomed, and quickly recovered to new all-time highs. The current decline is not only the longest period of decline in demand for power since 1929, with 289 weeks since EP’s last all-time high, but the BEV plot has stagnated since its November 2009 bottom. The failure of the current decline to follow the pattern of previous declines in EP by sharply rebounding from the low is truly unique, and troubling.
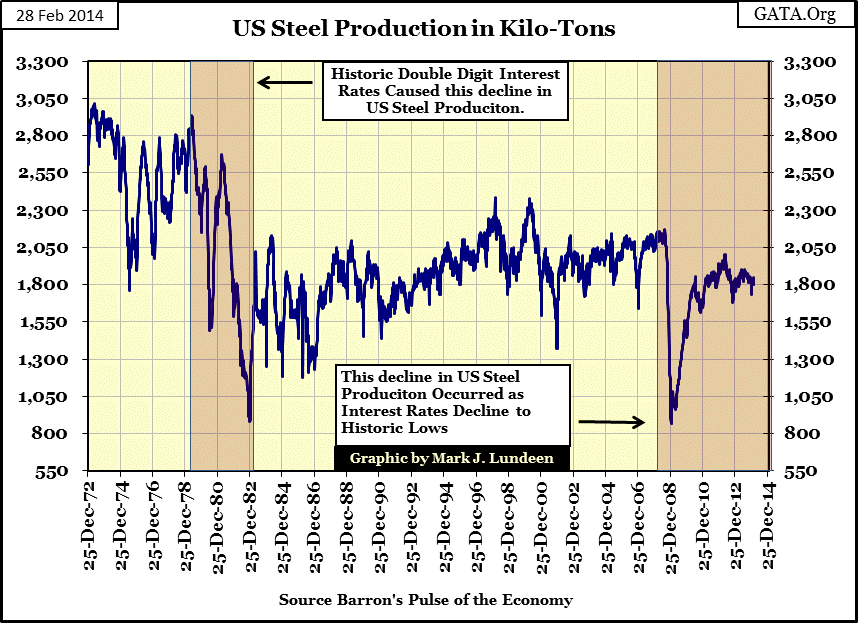
Next is the chart of US steel production from 1972 to 2014. It’s amazing how the collapse in steel production of the late 1970s occurred as interest rates and bond yield were at historic highs, and then in 2008 steel production collapsed again as interest rates declined to historic lows. The difference between the two is this; the 1970-80 decline in steel production occurred as Fed Chairman Volcker increased interest rates to double digits to save the US dollar a decade after the US removed the dollar from the Bretton Woods $35 gold standard. The current decline occurred as Fed Chairman Bernanke lowered interest rates to zero to save the banks from their toxic mortgage reserves and interest rate derivatives.
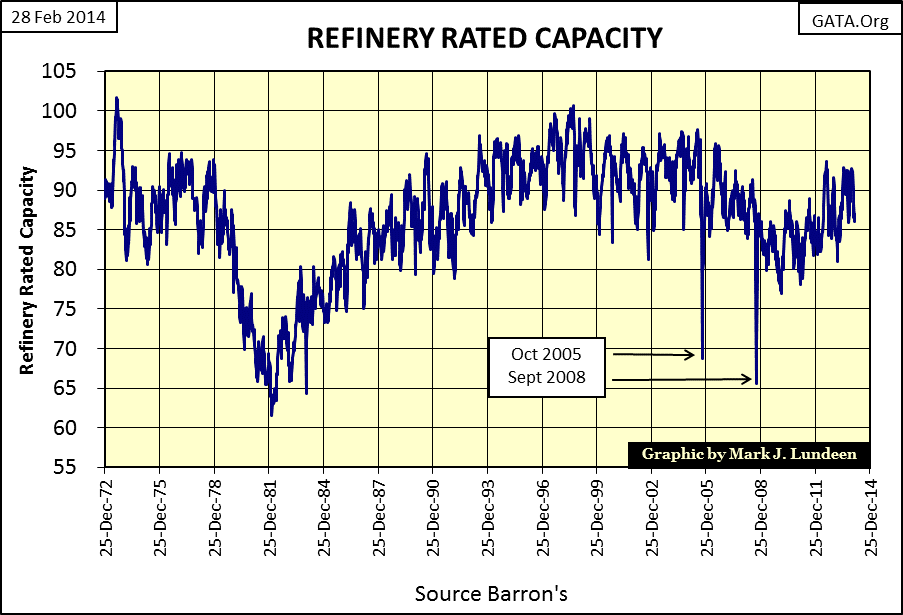
As with EP, we see “growth” in steel production from its 2008 low, but not to pre-credit crisis levels. Below is a chart for US petroleum refinery capacity. My comments for steel production and the post Bretton Wood’s extremes in interest rates also apply to oil refining. Demand for refined petroleum products isn’t what one would expect for a growing economy, but are above the extreme low of the credit crisis.
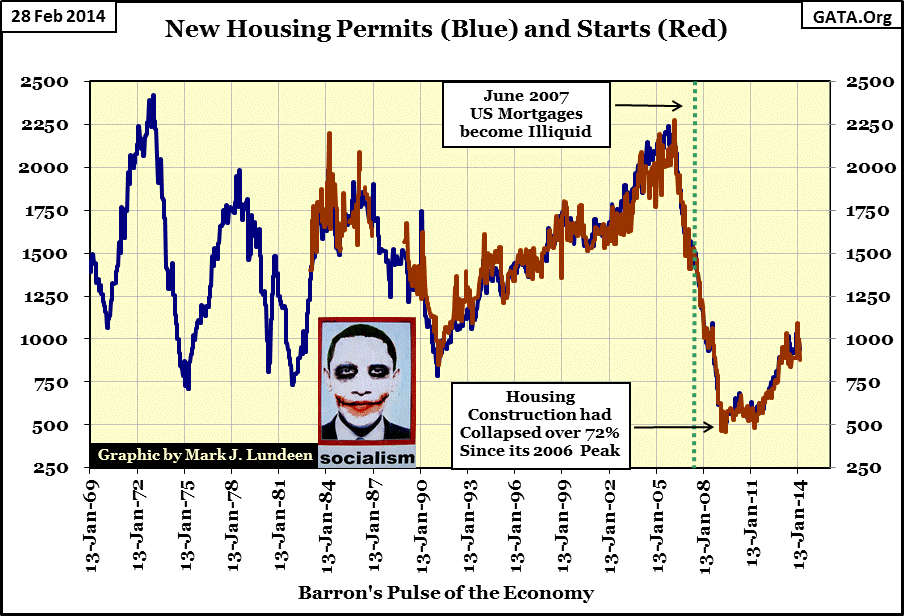
Next is a chart for ground-zero of our current economic malaise, housing permits and starts. Again, we see signs of “growth” after the credit crisis bottom, but nowhere near the “growth” seen before it. With tens of thousands of vacant, bank owned properties still being held off the market, only the zero interest rates to banks and loosening credit standards are backing the recent re-inflation of the housing bubble. One has to wonder if the housing market even needs the increase in supply the post 2008 increase in permits and starts represent. No doubt the bulk of this post credit crisis increase in housing inventory was funded by a stimulation program from Washington.
But housing has been a playground for Washington’s political class since FDR created the Savings & Loan industry and Fannie Mae in the 1930s to foster home ownership. Here’s a quote from Barron’s from 1954 to prove the point.
“The Housing Act of 1954 will turn out to be one of the worst pieces of inflationary legislation ever placed on the statute-books. For the first time, non- veterans will be able to buy a $10,000 house with a down payment of $500, the Federal Housing Administration insuring a 30-year mortgage of $9,500 on such a house. This is a triumph of the Nation’s Home Builder’s Association and a defeat of commonsense. Unfortunately, there is no reason to hope that mortgage money lenders will resist the practical consequences of this legislative monstrosity. Throughout the’ first half of’ 1954, most of them have been eager to make VA mortgage loans to home-buyers at no down payment at all.”
- Barron’s The World at Work, 05 July 1954, Page 7
Many of those $10,000 1954 houses became quarter million dollar homes in 2007 thanks to political intervention in the mortgage market and the 1971 abandonment of the Bretton Wood’s gold standard. The banking system freed from the $35 an ounce gold standard could now create credit without limits. It was just a matter of time before credit standards were lowered to where thirty year mortgages were extended to those the banking system knew could never service the principal and interest payments. But in fairness to the banks writing the sub-prime mortgages, “community organizers” such as ACORN’s Barack Obama forced Chicago banks through successful court actions to extend thirty year loans to unqualified sub-prime applicants.
http://newmediajournal.us/indx.php/item/6672
“Obama’s lawsuit was one element of a national “anti-redlining” campaign led by Chicago’s progressive groups, who argued that banks unfairly refused to lend money to people living within so-called “redlines” around African-American communities.”
Today, the Clinton administration is generally seen as a presidency that fostered economic growth, but in fact Mr Clinton sowed the seeds of many of today’s economic ills. It was during the Clinton administration when the OTC derivative market was allowed to expand into a hundred-trillion dollar criminal enterprise without government regulation. Washington’s quid pro quo with Wall Street was that the banking system was to lower mortgage standards to allow the chronically unemployed to purchase homes with subsidized credit created by the Federal Reserve. Wall Street created a market for sub-prime mortgages, bundled them with interest-rate swaps, and sold trillions of dollars worth of them globally as AAA rated investments.
Here’s a 1999 article from the New York Times reporting on the creation of the American sub-prime mortgage market.

September 30, 1999
Fannie Mae Eases Credit To Aid Mortgage Lending
By STEVEN A. HOLMES
In a move that could help increase home ownership rates among minorities and low-income consumers, the Fannie Mae Corporation is easing the credit requirements on loans that it will purchase from banks and other lenders.
The action, which will begin as a pilot program involving 24 banks in 15 markets -- including the New York metropolitan region -- will encourage those banks to extend home mortgages to individuals whose credit is generally not good enough to qualify for conventional loans. Fannie Mae officials say they hope to make it a nationwide program by next spring.
Fannie Mae, the nation's biggest underwriter of home mortgages, has been under increasing pressure from the Clinton Administration to expand mortgage loans among low and moderate income people and felt pressure from stock holders to maintain its phenomenal growth in profits.
In addition, banks, thrift institutions and mortgage companies have been pressing Fannie Mae to help them make more loans to so-called subprime borrowers. These borrowers whose incomes, credit ratings and savings are not good enough to qualify for conventional loans, can only get loans from finance companies that charge much higher interest rates -- anywhere from three to four percentage points higher than conventional loans.
- End NY Time Quote -
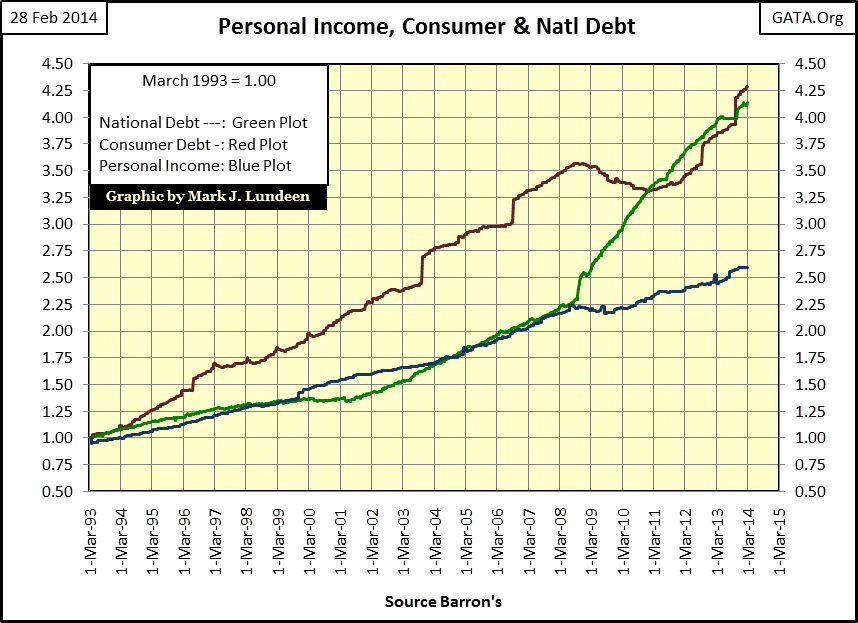
So, what’s the problem with the US economy that’s inhibiting its return to robust growth? With the supply of dollars available to loan officers no longer limited by the supply of gold held by the US Treasury for monetary reserves, the banking system has expanded credit beyond the ability of its debtors to service their obligations to the banks. This includes aggregate debt taken on by governments, corporations and private citizens. The chart below plotting the indexed values of the US national debt, consumer debt and personal income tells the story of why the economy is doing so poorly; consumers are being overwhelmed by debt service. Realize that there are many other sources of debt not included below: student loans, mortgages, municipal and corporate bonds. However, in one way or another, all this debt must be serviced by private individuals paying their taxes and monthly bills.
So it’s from personal income (Blue Plot) that consumer debt (Red Plot) and the US national debt (Green plot) must be paid, however the growth in debt is overwhelming the growth in income. But the “policy makers” don’t see it that way. Here’s what the President of the Dallas Fed told citizens they needed to do to revive the economy in 2001 in the aftermath of the high-tech crash:
“My term for what happened to the economy as we were gliding in for the proverbial soft landing is that we hit an air pocket. Fortunately, we were flying high enough so that the sudden decline in growth didn't cause us to crash-land. If we all join hands and go buy a new SUV, everything will be all right. Preferably a Navigator.”
- Robert McTeer, President Dallas Federal Reserve Bank: Remarks before the Richardson, Texas, Chamber of Commerce, 02 Feb 2001
In the EP BEV chart above, we see that 2001 was the start of the largest downturn in demand for electrical power since 1983. The 2000-02 high-tech wreck resulted in a 2.19% decline in EP. This was the first, but not the last decline in EP since Alan Greenspan’s market bubble of the 1990s began deflating, and the response from the “policy makers” has always been the same: increase the amount of debt burden on the economy. Of course they call it “stimulation”, but all they’ve accomplished is to place larger burdens on the wealth of an aging public and the income of workers still employed in a bad economy.
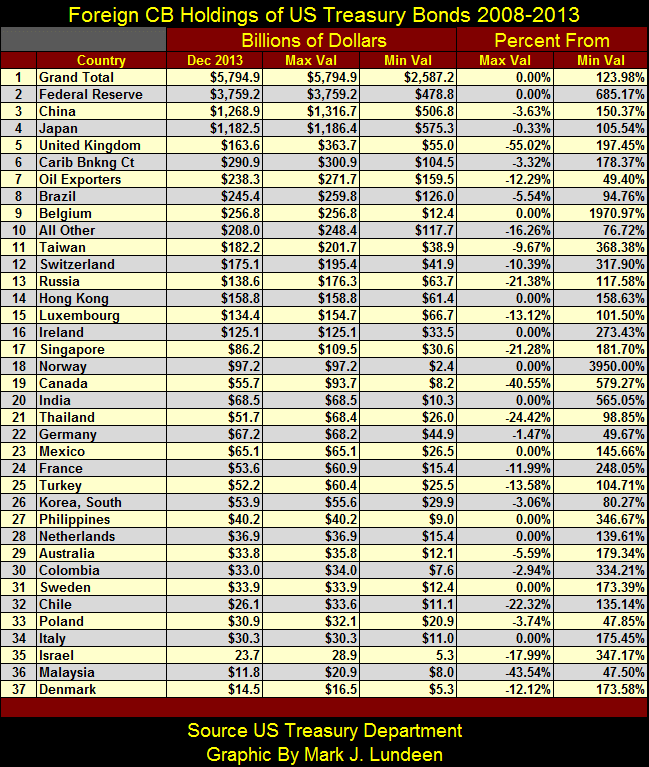
Here’s a table listing foreign holders of US Treasury debt updated to December 2013.
I included the Federal Reserve’s US Treasury’s bond holdings in the list, but the Fed’s holdings of US Treasury debt is *NOT* included in the Grand Total, still it’s interesting to see how the Fed’s holdings of US Treasury debt have grown relative to it since the credit crisis. In May 2008, before the credit crisis crashed the markets, the Fed’s holdings of US Treasury debt was only 19% of the Grand Total. In December 2013 it has increased to 64%! The Federal Reserve’s bond purchases are for monetary operations required to “inject liquidity” into the economy, but a quick look at the EP’s BEV chart shows how little effect these massive inflows of dollars are having on the economy. Be that as it may, the academics in control of the Federal Reserve will continue buying more US Treasury debt with inflation, and “injecting liquidity” into the economy as that is all they know how to do.
What is actually needed is something that was abandoned by Congress with the gold standard in August 1971, and by the FASB in March 2009; the requirement of daily marking-to-market all debt trading in the financial markets, writing off all losses in the process; and prosecuting high level officers in control of Wall Street banks for criminal activities, something not done since the savings and loan crisis of the 1980’s. These two steps:
- Daily marking assets to market
- Prosecuting criminal activity by Wall Street officials
…would do more to restore the capital markets to their former role of financing economic growth than any regulation written by Congress. But it’s been 43 years since the US abandoned the Bretton Woods gold standard, so in 2014 there’s more unviable debt masquerading as financial assets on the books of insurance companies and pension funds than anyone can really say. At this point the cure may be worse than the disease; you can be sure Janet Yellen over at the Federal Reserve believes this. But the financial system and the economy it supports are fatally impaired and so can’t go on like this forever.
The day is coming when Mr Bear is going to do what he was born to do – take out the trash from the financial system. You can say goodbye to “economic growth” and hello to soaring interest rates when he comes back to work. The best way to survive what is coming is to own assets with no counterparty risks; gold and silver bullion come to mind.


