Economy Mis-Read by Fed, but Gold’s Rally Turning Red?


Let’s celebrate today’s Summer Solstice (02:42 GMT) with the first sentence from The Federal Open Market Committee’s Policy Statement dated this past Wednesday, 18 June:
“Although swings in net exports have affected the data, recent indicators suggest that economic activity has continued to expand at a solid pace.”
Is that really so? For as posted yesterday (Friday) on “X” (@deMeadvillePro), the Economic Barometer just reached an oscillative low not seen since 10 September 2009 … just in case you’re scoring at home. Here ’tis, the Baro and S&P 500 having morphed from being in blissful harmony to comprehensive disconnection:

Further, following the FOMC’s prior Policy Statement (07 May), 74 metrics have since come into the Econ Baro … with only 28 having improved period-over-period … which for you WestPalmBeachers down there means “We’re going the wrong way!” despite the claim of the economy expanding “at a solid pace.” Doubtless such disparity shan’t be on CNBS, et alia.
Neither is Gold watching the Baro; otherwise one ought think the yellow metal would be soaring in “the knowledge” that the FOMC must next vote (30 July) to reduce the Funds Rate, further debasing the Dollar as dough then flows more easily through the Fed’s window into the the money supply. It may be perennially behind the curve, but surely the Fed has the economy mis-read. And as for the disconnect from the Baro by the S&P 500, has the latter transited from The Investing Age of Stoopid to that of basically brain-dead? (More on that in our wrap).
Instead — since the Mid-East conflict ramped up some six trading days ago on 13 June — Gold has been doing exactly what it does during geo-political duress:
- first it swiftly gains ground;
- then it all comes back down.
To wit: Gold settled Thursday 12 June at 3406. Said conflict then erupted that Friday and through the weekend such as to find Gold by Monday (16 June) having scampered up to as high as 3476 … only to spend the balance of this past week selling off as is its geo-political wont down yesterday to 3356, a full -50 points lower than before ISR attacked IRN.
“Sad to say, but these geo-political events look like pretty easy trades, eh mmb?”
We don’t encourage that nature of risk, Squire, especially as “Shorting Gold is a bad idea”. But Gold’s geo-political “spikes n’ sinks” regularly pan out, the prime example being back on “911” in 2001. Gold halted that terror-filled day at 276. Following the ensuing days of no trading, Gold then worked higher to 296 come 21 September (+7.2%), the largest six-trading-day percentage leap of that year. Yet a month on, Gold settled all the way back down at 276 on 22 October, the assault on the States “priced in” as if nothing had happened. Moreover, it took until May of the following year before Gold permanently rose above the 200s. Certainly more recently we’ve seen Gold “spike n’ sink” over RUS/UKR and now yet again with ISR/IRN, as well as on other examples that we’ve previously documented.
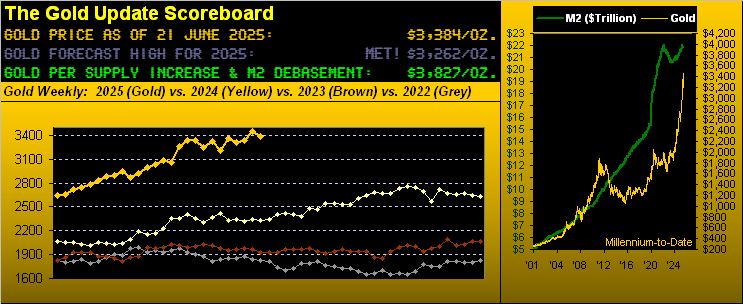
As to the current case, ’twas somewhat surprising that Gold’s geo-political price spike was not enough to flip the weekly parabolic trend from Short-to-Long, even as we’d anticipated ‘twould in last week’s piece. Thus Short remains said stint despite price having settled the week at 3384, still a good +164 points higher than when the trend “officially” began per 19 May’s opening trade at 3220, (i.e. “down” has been “up” as we graphically detailed a week ago). And so to Gold’s updated weekly bars we go, a sixth red dot having joined the show:
To be sure, that rightmost weekly bar came ever so close to the 3480 flip level, price reaching to as high as the aforementioned 3476 level … which in turn is the new hurdle for the ensuing week.
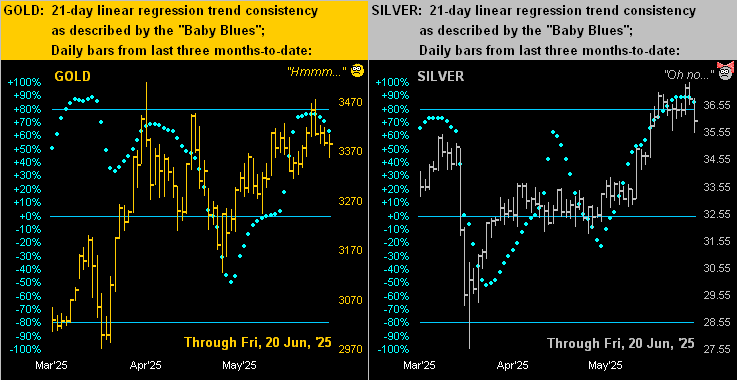
But: is the Short trend about to become (pardon the pun) elongated? Per the following two-panel graphic of daily bars across the past three months-to-date for Gold on the left and Sister Silver on the right, we see the baby blue dots beginning to descend. Mathematically, that means the two respective uptrends have begun to lose their consistency. And as you regular readers and website viewers well know: “Follow the blues instead of the news, else lose yer shoes.” Here’s the graphic:
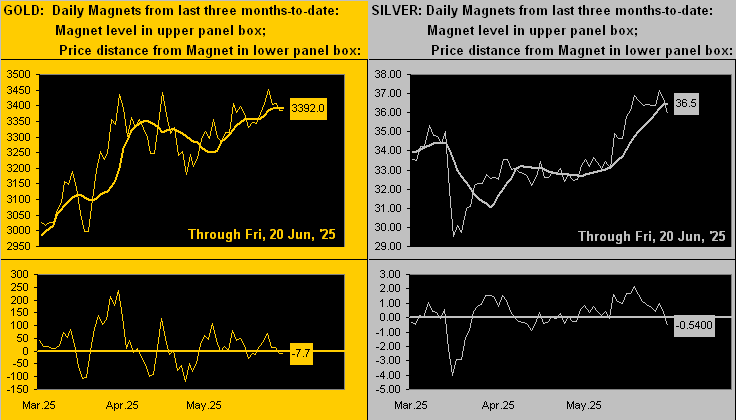
Then we’ve this next double-panel view as culled from the website: the precious metals’ Market Magnets, also for the past three months-to-date. For both Gold at left and Silver at right, price has just moved beneath Magnet. The rule in this case is to expect prices to further fall; however, given the on-balance strength of the yellow and white metals from May-to-date, such Magnet penetrations have suffered little downside follow-through. Regardless, whether for near-term trading or in timing the placement of a broader-term strategy, price’s directional movement vis-à-vis its Magnet is a substantive leading tool. And in this case with the aforeshown “Baby Blues” beginning to rollover, be thee not surprised to find prices move a little lower:
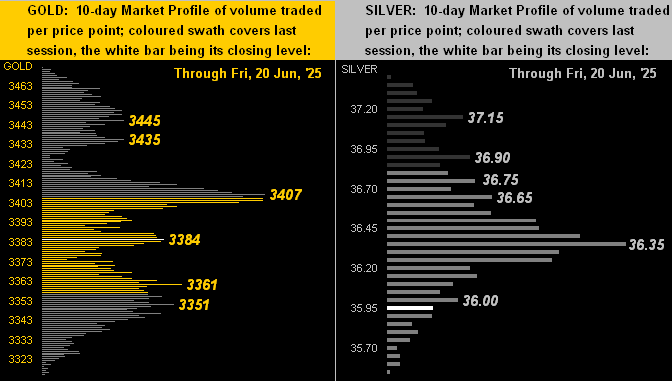
Such near-term negativity noted, let’s next check the 10-day Market Profiles for Gold (below left) and for Silver (below right). And whereas Gold is exhibiting underlying volume support at both 3361 and 3351 as labeled, we’ve none by this construct for Silver. Poor ol’ Sister Silver! Too, for both metals, we also denote their overhead volume resistors:
In sum, a bit more pullback in the precious metals ought not be of much concern, (that courtesy of the “Markets Don’t Move in a Straight Line Dept.”) even as we’ve key leading indicators that suggest a bit of a near-term a slip. With 3384 Gold today — a -12% discount to the opening Scoreboard’s Dollar debasement value of 3827 — price’s best days remain well up the Golden Road. Indeed, to eclipse the key 3476 level in the new week — and thus flip the weekly trend from Short back to Long — from here is a distance of +92 points. Gold’s expected weekly trading range? 151 points. Clearly doable, especially should another dose of geo-political jitters ensue. Otherwise, some pullback looks due.
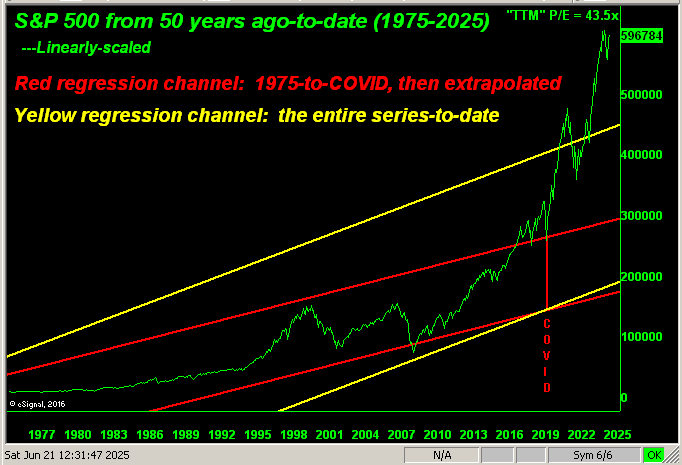
To close, we query: “Do you scare easily?” If you’re invested in equities, the following fearful graphic arguably suggests running for cover. Recall the disconnect with which we opened between the plunging Econ Baro and the flying S&P 500? Scary. More broadly for the S&P, really scary! Such “Casino 500” today at 5968 is some +33% above the top of the yellow regression channel and the “trailing twelve months” price/earnings ratio of 43.5x essentially double any historical norm, (let alone practically triple Jerome B. Cohen’s “…in bull markets the average [price/earnings] level would be about 15 to 18 times earnings…”).
As a fine friend said over coffee this morning “Next year’ll be a disaster for the stock market”, to which we quizzically responded “What about next week?” Scary indeed:
The good news of course is that all such “scariness” is mitigated given economics no longer have meaning, as neither do earnings. Employing math is a thing of the past! Or to reprise what a seasoned investor said to us here back in April: “Nobody at Goldman [today] has ever experienced a down market.” Then to close out the FinMedia week came this yesterday from Dow Jones Newswires: “The Stock Market Has Taken a Lot of Pain for Not Much Gain.” Look at the top of the above graphic. They’ve no concept of what market pain is.
Either way, don’t you get mis-read; get Gold instead!
Cheers!
…m…
www.TheGoldUpdate.com
www.deMeadville.com
and now on “X”: @deMeadvillePro
*********

Mark Mead Baillie has had an extensive business career beginning in banking and financial services for two years with Banque Nationale de Paris to corporate research for three years at Barclays Bank and then for six years as an analyst and corporate lender with Société Générale.
For the last 22 years he has expanded his financial expertise by creating his own financial services company, de Meadville International, which comprehensively follows his BEGOS complex of markets (Bond/Euro/Gold/Oil/S&P) and the trading of the futures therein. He is recognized within the financial community of demonstrating creative technical skills that surpass industry standards toward making highly informed market assessments and his work is featured in Merrill Lynch Wealth Management client presentations. He has adapted such skills into becoming the popular author each week of the prolific “The Gold Update” and is known in the financial website community as “mmb” and “deMeadville”.
Mr. Baillie holds a BS in Business from the University of Southern California and an MBA in Finance from Golden Gate University.


