As Expected, Gold Rejected


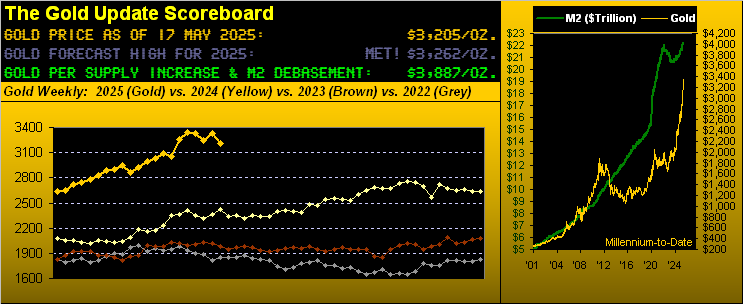
Per our post on ‘X’ (@deMeadvillePro) this past Monday, Gold’s weekly parabolic trend provisionally flipped from Long-to-Short, and was so confirmed by the week’s settle yesterday (Friday) at 3205, a full -305 points (-8.7%) below price’s All-Time High of 3510 set this past 22 April, a mere 18 trading days ago.
‘Course — as you regular readers know — despite all the otherwise bullish Gold hysteria out there — we “alone” (‘twould seem) have been anticipating through these past two weeks such Long trend coming to its end given one of the world’s oldest sciences which we dutifully employ: math, (a tool sadly lost on today’s financial “experts”).
Thus, this begs we straightaway go to Gold’s Long trend end via the weekly bars from a year ago-to-date, the encircled red dot heralding the start of the new Short trend:

This latest Long trend lasted 16 weeks, (which ties for 13th in duration since the year 2001). But more importantly as to “How low is low?”, as above shown we’ve a structural support zone spanning from 2973 down to 2844, the midpoint of which (2908) is -297 points below today’s 3205 level, i.e. some -9% lower.
Indeed, across Gold’s 52 previous parabolic Short trends century-to-date, the average price adversity is -7.8%: thus a -9% decline from here wouldn’t be that untoward; (’tis not a prognostication, rather an “ought not be surprising” consideration). To be sure, that’s all technically talking. Whereas, in fundamentally forecasting, price broadly still has significant upside in its balance per our opening Gold Scoreboard.
“And maybe it goes straight back up ’cause Moody’s just downgraded U.S. credit, mmb!”
They’ve just figured that out now, Squire? Fitch so did two years ago, (let alone Standard & Poor’s away back in 2011, following which the price of Gold fell for four years!) ‘Tis on occasion quipped that “The Fed is behind the curve”; Moody’s apparently can’t even find the curve.
Moreover: you know, and we know, and everyone from Bangor, Maine to Honolulu and right ’round the world knows that were U.S. debt graded as that for a publicly-held company, today’s “multiple As” might more realistically be a “single “B”, if not down in the “Cs”. Ah, but StateSide “full faith and credit” mitigates any notion of (heaven forbid) “junk”. At least so far.
Regardless, debt is a key driver of currency debasement (i.e. more is printed — as more and more is needed — to service more debt). Thus we believe current credit grades — and to an extent future downgrades — are to an extent already “priced in” to Gold as valued by Dollar debasement, which again per the Scoreboard now broadly values the yellow metal at 3887, some +21% above the present 3205 level.
As to our recent expecting of Gold’s rejecting, we’ve merely been watching the math via the website’s near-term BEGOS valuation for Gold. Back on 21 April during this most recent upside deviation, Gold was priced some +440 points above such valuation. Yet we herein remained ever-remindful that price inevitably reverts to its mean (in this case the BEGOS derived valuation, which itself rightly is rising). And indeed such means reversion was completed per this past Wednesday’s settle as we next see:
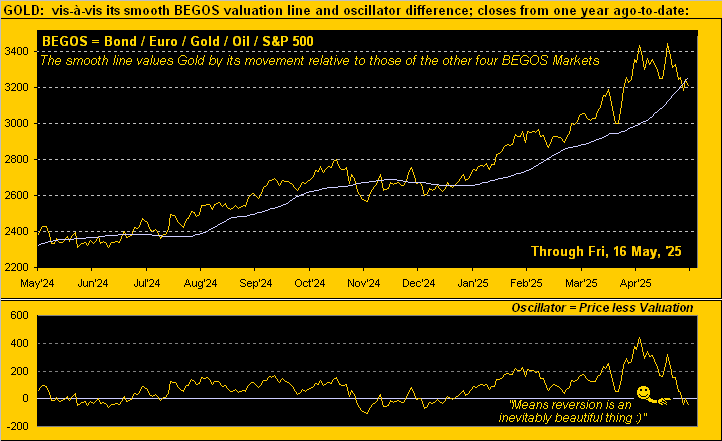
“But crossing under that line also is another down signal, right mmb?”
Absolutely, Squire, that is the rule of thumb for each of the five primary BEGOS Markets (Bond / Euro / Gold / Oil / S&P 500) But specific to our yellow metal as we always caution: “Shorting Gold is a BAD idea!” Further by the above graphic, the downside penetrations from a year ago-to-date have not garnered much follow-through. Or as a StateSide friend and trading colleague used to say: “They went Short Gold, but they ain’t around anymore.” Still with the weekly parabolic trend having now flipped to Short, lower prices at least for a bit make sense through here.
Speaking too of lower, so is the recent track of the Economic Barometer. The past week’s data barrage of 19 incoming metrics recorded just seven that improved period-over-period. Notably therein, April’s wholesale inflation via the Producer Price Index was clearly DEflationary per both its headline and core readings. But hardly was that the case for retail inflation (which for you WestPalmBeachers down there directly affects you) as the pace of the Consumer Price Index quickened after having been flat for March.
So exactly what is the data-compiling Department of Labor Statistics telling us? That by the CPI the cost of April living rose, but that by the more leading PPI the States are experiencing cheaper living now in May? Or are we simply stagflating away? Is your employer thus poised to raise your pay? But they’re not doing as much business, they say? Either way, here’s the Baro from a year ago through today:
And duly note therein the quip about the Baro once having led the S&P 500, as reliably it did for some 22 years from inception in 1998 to 2020. But then: add $7T “for the effects of COVID” to the StateSide money supply (“M2” basis), it all fungibly ending up in the S&P, which in turn has doubled without the requisite earnings support, and thus our “live” price/earnings ratio has skyrocketed from its developmental level back in 2013 of 25.4x to today’s quite real — but ridiculous — 46.3x. ‘Twould seem nobody wants triple the annualized yield afforded by the U.S. Three-Month T-Bill (4.237%) because the S&P’s yield of 1.303% is deemed better (per this Investing Age of Stoopid). ‘Course, stocks never go down, so it all makes sense.
Fortunately, far more sensible is precious metals ownership. Let’s assess this century-to-date: the S&P 500 has gone from 1320 to now 5958 for a pre-dividend gain of +351%; add ’em in and the total return is in the +415% neighbourhood, so pretty good. But then there’s terribly lagging Silver (vis-à-vis Gold) nonetheless +599% across the same stint. So there ya go. Oh yes, and Gold itself? +1,071%. (Editor’s Note: Bitcoin began basically at $0, so such return-to-date is immeasurably infinite, just in case you’re scoring at home).
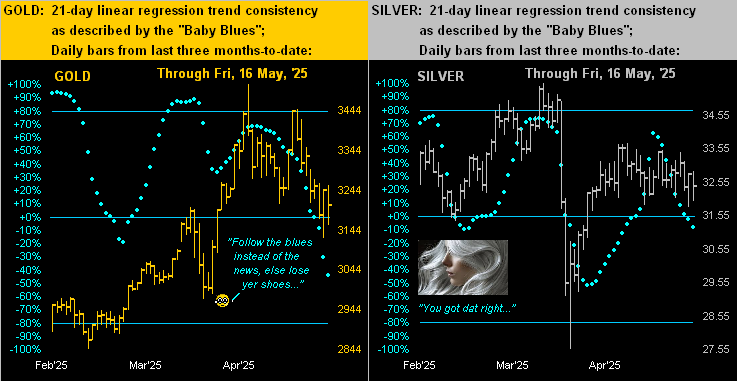
Again however per our missive’s title, “As Expected, Gold Rejected”, we next view our two-panel graphic featuring Gold’s daily bars from three months ago-to-date on the left and those for Silver on the right. Our baby blue dots of trend consistency as ever provide shining guidance. For as therein stated in black and blue: “Follow the blues instead of the news, else lose yer shoes” as further affirmed by Sister Silver. ‘Tis why we turned off CNBS et alia a million years ago. Here you go:
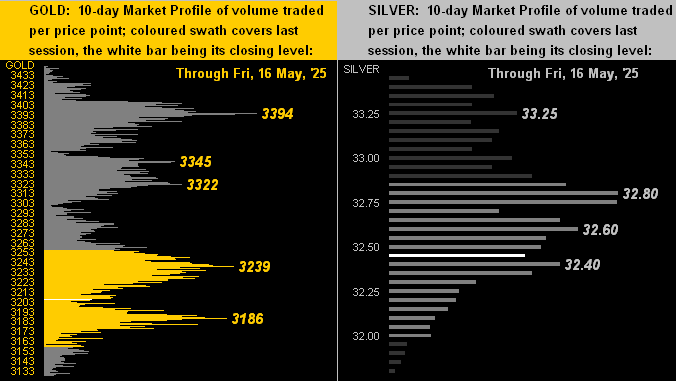
Understand, naturally, that directionally brilliant as are the “Baby Blues”, per the deMeadville home page: “…there is no ‘holy grail’ in this business…”, meaning that cash management is everything. And helpful to that end are the website’s 10-day Market Profiles as next shown below for both Gold (at left) and Silver (at right). The labeled apices are those prices featuring the dominant levels of volume; as such, they better determine the key areas of price’s support and resistance, as updated daily:
To sum it all up as Gold works down, we wrap with the stack:
The Gold Stack
Gold’s Value per Dollar Debasement, (from our opening “Scoreboard”): 3887
Gold’s All-Time Intra-Day High: 3510 (22 April 2025)
2025’s High: 3510 (22 April 2025)
The Weekly Parabolic Price to flip Long: 3510
Gold’s All-Time Closing High: 3442 (06 May 2025)
10-Session “volume-weighted” average price magnet: 3287
Trading Resistance: notable Profile apices 3239 / 3322 / 3345 / 3394
Gold Currently: 3205, (expected daily trading range [“EDTR”]: 90 points)
Trading Support: by the Profile 3186
10-Session directional range: down to 3125 (from 3444) = -319 points or -9.3%
The 300-Day Moving Average: 2649 and rising
2025’s Low: 2625 (06 January)
The 2000’s Triple-Top: 2089 (07 Aug ’20); 2079 (08 Mar’22); 2085 (04 May ’23)
The Gateway to 2000: 1900+
The Final Frontier: 1800-1900
The Northern Front: 1800-1750
On Maneuvers: 1750-1579
The Floor: 1579-1466
Le Sous-sol: Sub-1466
The Support Shelf: 1454-1434
Base Camp: 1377
The 1360s Double-Top: 1369 in Apr ’18 preceded by 1362 in Sep ’17
Neverland: The Whiny 1290s
The Box: 1280-1240
So yes as expected, Gold is getting rejected. But be thee not dejected! For far higher levels remain projected!
Cheers!
…m…
www.TheGoldUpdate.com
www.deMeadville.com
and now on “X”: @deMeadvillePro
********

Mark Mead Baillie has had an extensive business career beginning in banking and financial services for two years with Banque Nationale de Paris to corporate research for three years at Barclays Bank and then for six years as an analyst and corporate lender with Société Générale.
For the last 22 years he has expanded his financial expertise by creating his own financial services company, de Meadville International, which comprehensively follows his BEGOS complex of markets (Bond/Euro/Gold/Oil/S&P) and the trading of the futures therein. He is recognized within the financial community of demonstrating creative technical skills that surpass industry standards toward making highly informed market assessments and his work is featured in Merrill Lynch Wealth Management client presentations. He has adapted such skills into becoming the popular author each week of the prolific “The Gold Update” and is known in the financial website community as “mmb” and “deMeadville”.
Mr. Baillie holds a BS in Business from the University of Southern California and an MBA in Finance from Golden Gate University.


