Exploring The Gold Market: The Fed, The Charts…The COTS & GLD


As most of you know by now, I am bearish on gold from an intermediate term perspective on account of the fact that I do believe that the Fed is eventually going to have to raise rates and try to somehow normalize monetary policy/interest rates. Perhaps I am wrong about that but I find it hard to believe that we can expect near zero interest rates into perpetuity. My own view is that the Fed can only do much to help the economy with monetary policy. What it cannot do however is to set fiscal policy or to deal with the heavy regulatory burden of an overreaching federal government. That will require a change in the party which controls the White House but that is unfortunately a long way off at this point. I maintain that had we a business friendly administration (think Obamacare and the burden that has produced on business for example, not to mention a run amok EPA) , coupled with near zero interest rates and more fiscally sound budgets ( controlled spending) that the economy would be in much better shape than it currently is. That being said, we have to work with what we have before us, not what we might wish for. For now, we have a Fed that has managed to inject enough uncertainty in regards to interest rates that it has taken some of the selling pressure off of gold for the time being.
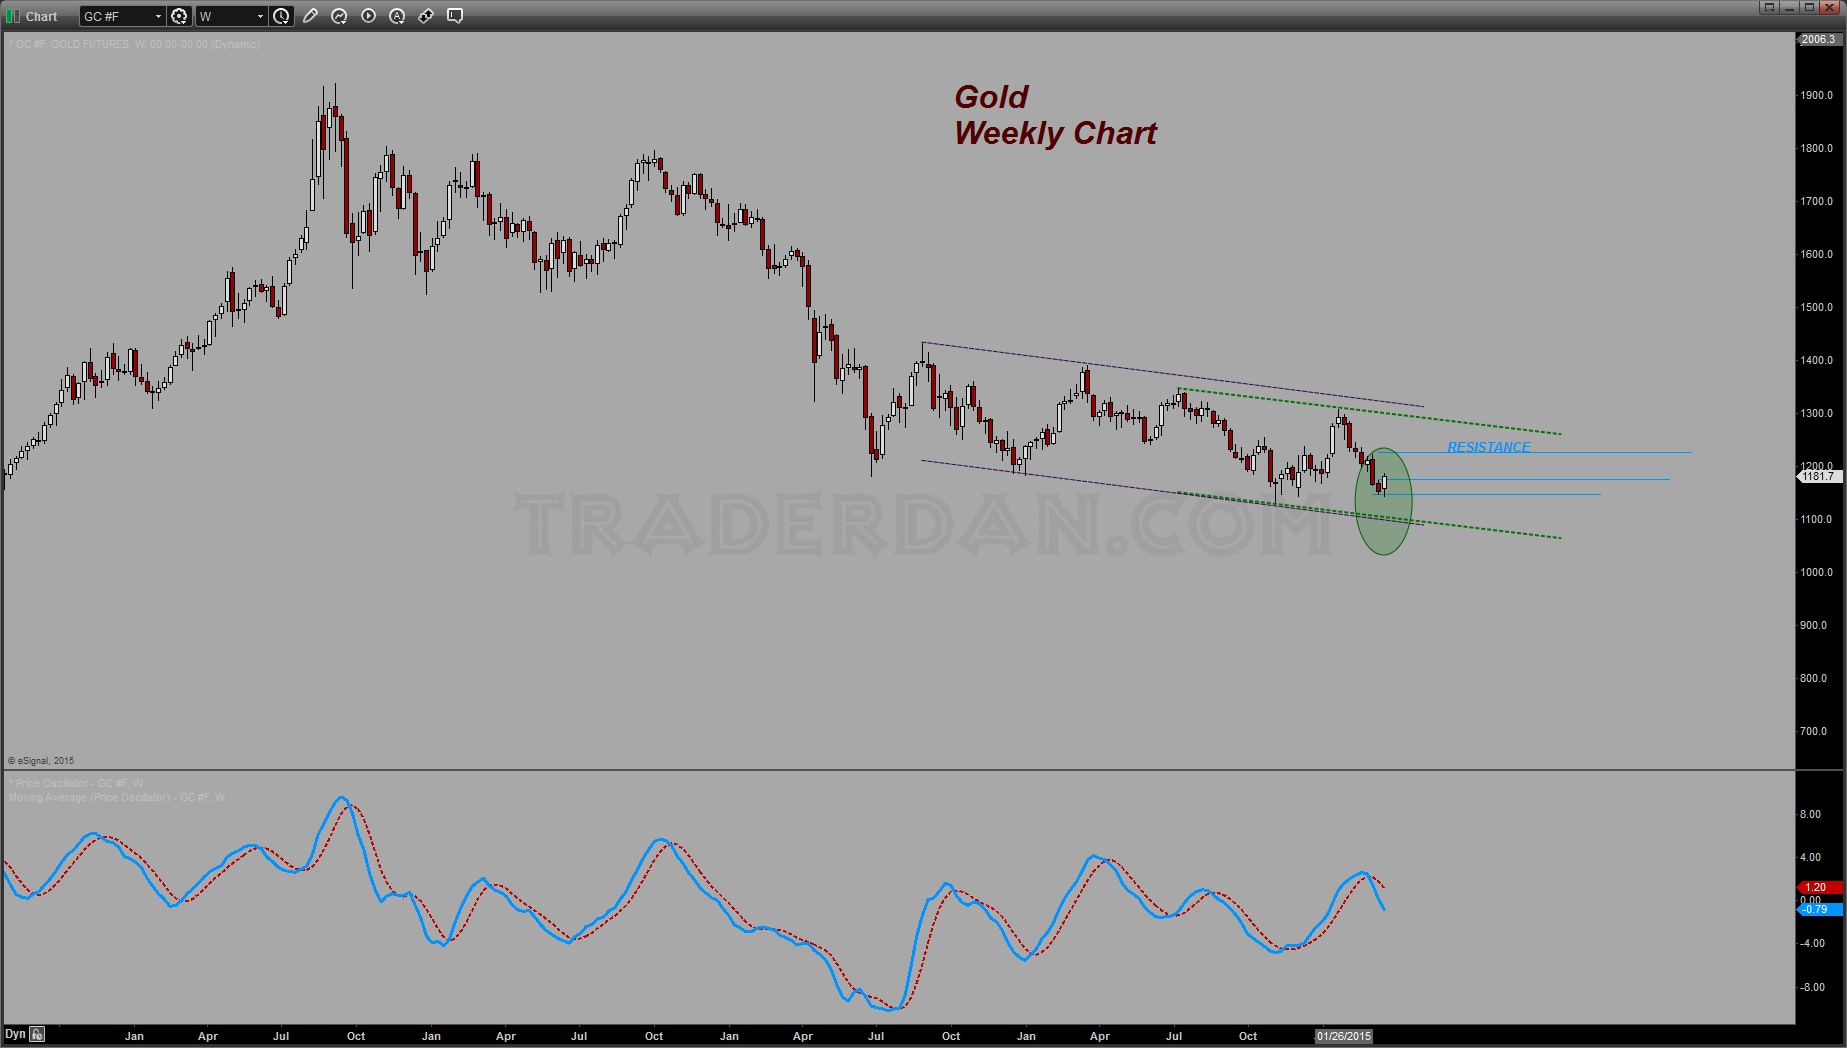
In looking over the chart one can see that the weekly chart pattern shows an upside reversal pattern has formed. We had a low formed that was below the previous week’s low and a high (plus a close) that was above the previous week’s high. Thus, from a technical analysis perspective, it would not be a surprise to see some further upside in the market. For this market to provide anything further in the way of potential serious upside, it would need to clear resistance near $1220-$1225. Were that to occur, you would have the potential to make a run at heavier resistance near $1250. I would be very surprised if gold were able to clear that and would expect heavy selling to occur if it did rise to near those levels. I should note that the price remains well within TWO down-trending price channels and the particular indicator I am using on this time frame remains in a decidedly bearish posture. All of this leads me to view this bounce as nothing more than the latest upside retracement in an ongoing bearish market. We’ll have to wait and see how much further the current short-covering will take it before it runs out of steam.
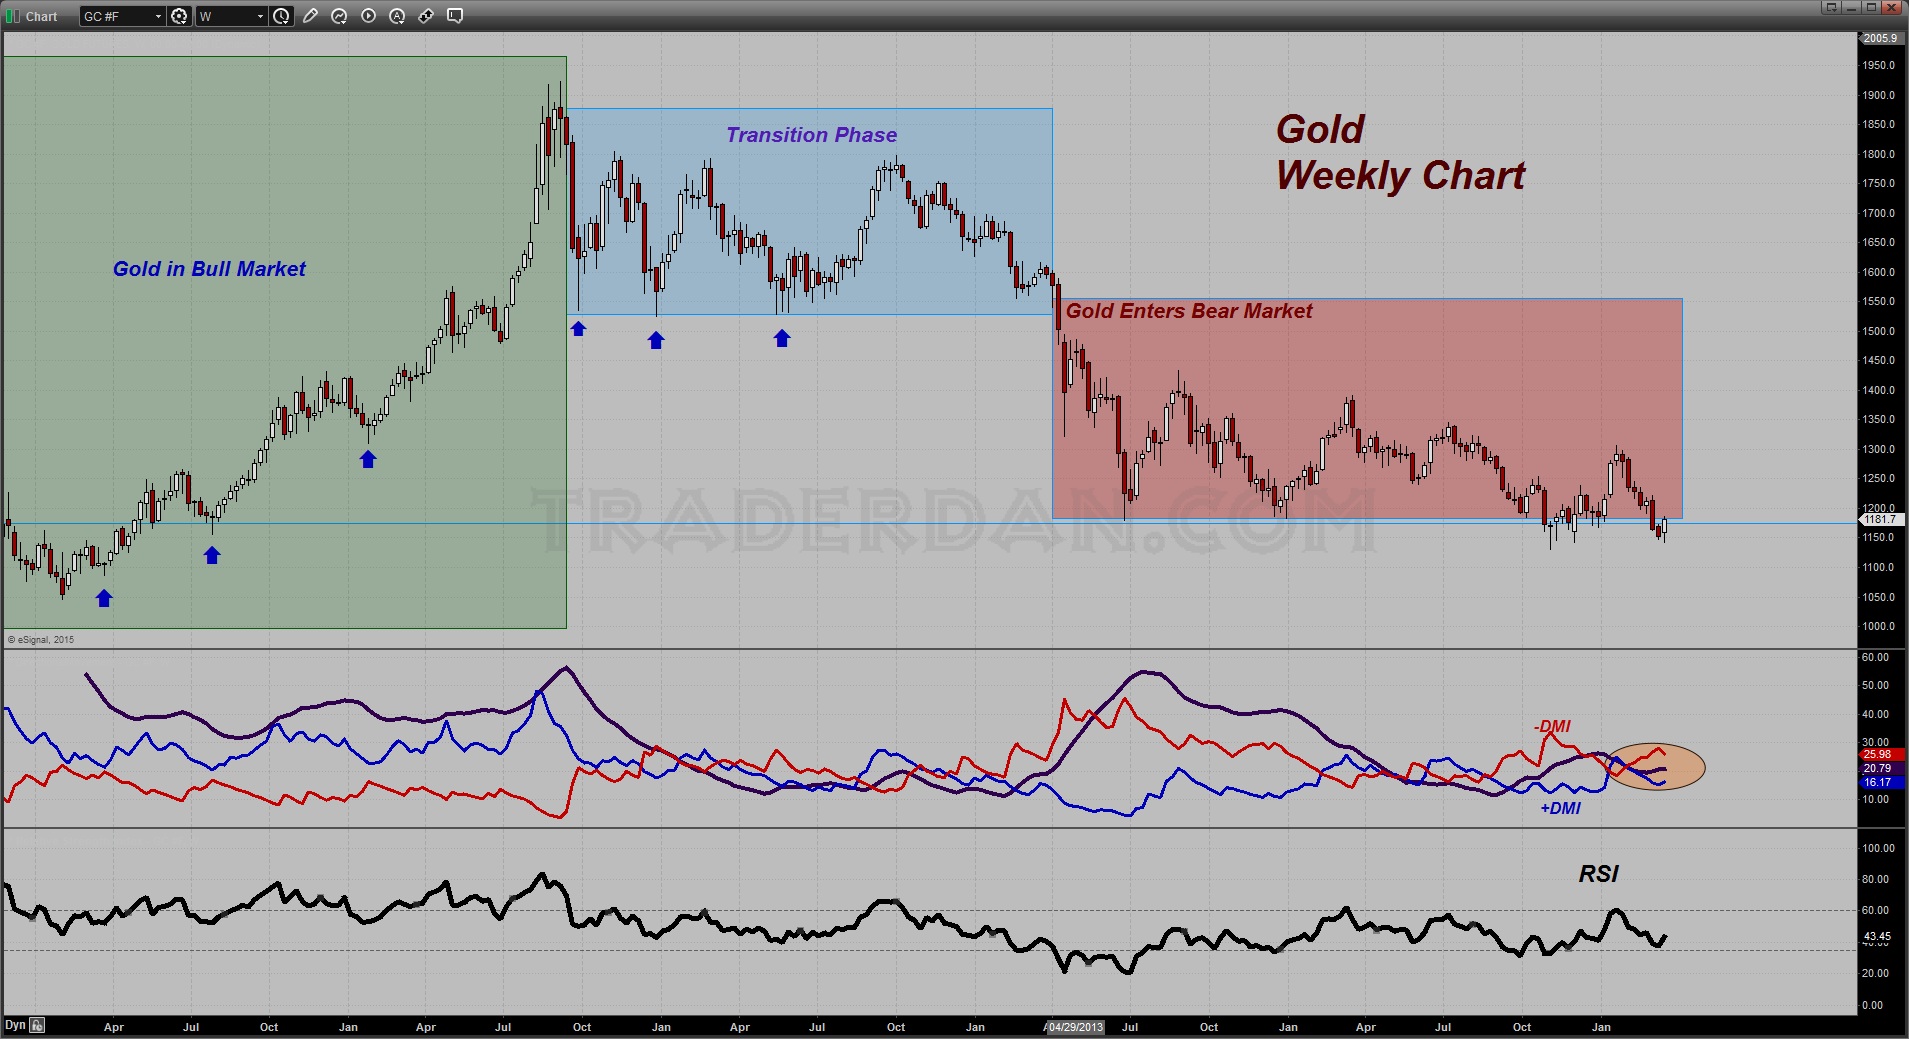
Another view of the same chart using two familiar indicators shows the ADX/DMI also in a bearish posture with -DMI remaining above +DMI ( Bears in control). Also, the RSI remains capped below 60 and has bounced off of the oversold level near 30. Nothing particularly bullish here as well. From where I sit at this time it looks to me like what the Fed managed to do was to therefore spook enough speculative shorts into covering that an upward leg is in the process of unfolding while some of these bears move to the sidelines. If you look at the recent COT report, you can see that the number of total speculator short positions was rather high( remember – this report only covers through Tuesday and therefore does not show us how many of these shorts ran for the exits on Wednesday, the day that the FOMC statement was released). Look at the line within the circled ellipses and you can have some comparison to the recent peak in total spec short positions. We will have to see how many of these decide to cover and move out while waiting to re-enter on the sell side once more. The short term therefore is friendly but intermediate term remains bearish.
As noted yesterday, the biggest factor that I see now that stands as a huge hurdle for the bulls is the fact that once more, just like it did at this time last year, the gold ETF, GLD, is bleeding gold. The latest report from that shows a drop of almost 5 1/2 tons of gold on Friday and about 6.3 tons from the previous week. While overall reported tonnage is some 35 tons greater than at the start of the year, almost 27 tons has been shed since its peak reported holdings in February. The gold perma-bulls can talk all they want to about Chinese and Indian demand but as stated many times here in the past, demand from those two countries can never drive the price of gold sharply higher. What it does is to put a floor in the market. To take the price higher requires Western-based speculative demand. GLD is illustrative of such demand. If it is falling, it is not friendly and no amount of spin can say otherwise. Shifting a bit over to the currency realm. Take a look at the most recent Euro COT chart just prior to the FOMC statement.

What I found rather remarkable is the big surge in the net long position of the “other large reportables” category. Large private traders, non-registered CTA’s and CPO’s, floor locals, etc. make up this group. They piled on a huge number of longs ahead of the FOMC statement. Note – I actually had to double check and make sure I was not making a mistake with the number when I saw it! Talk about a risky bet! In this case, they hit the jackpot but I would stress to the readers out there – this is not recommended strategy as the results can be disastrous for any trader who guesses wrong. Rolling the dice as this group did ahead of a major economic event can make you a hero or terminate your career and make you a zero. If you wish to gamble, head over to Vegas or Reno or Atlantic City. If you wish to trade, don’t be stupid and bet the farm on something that has as much chance of going your way as a coin toss.
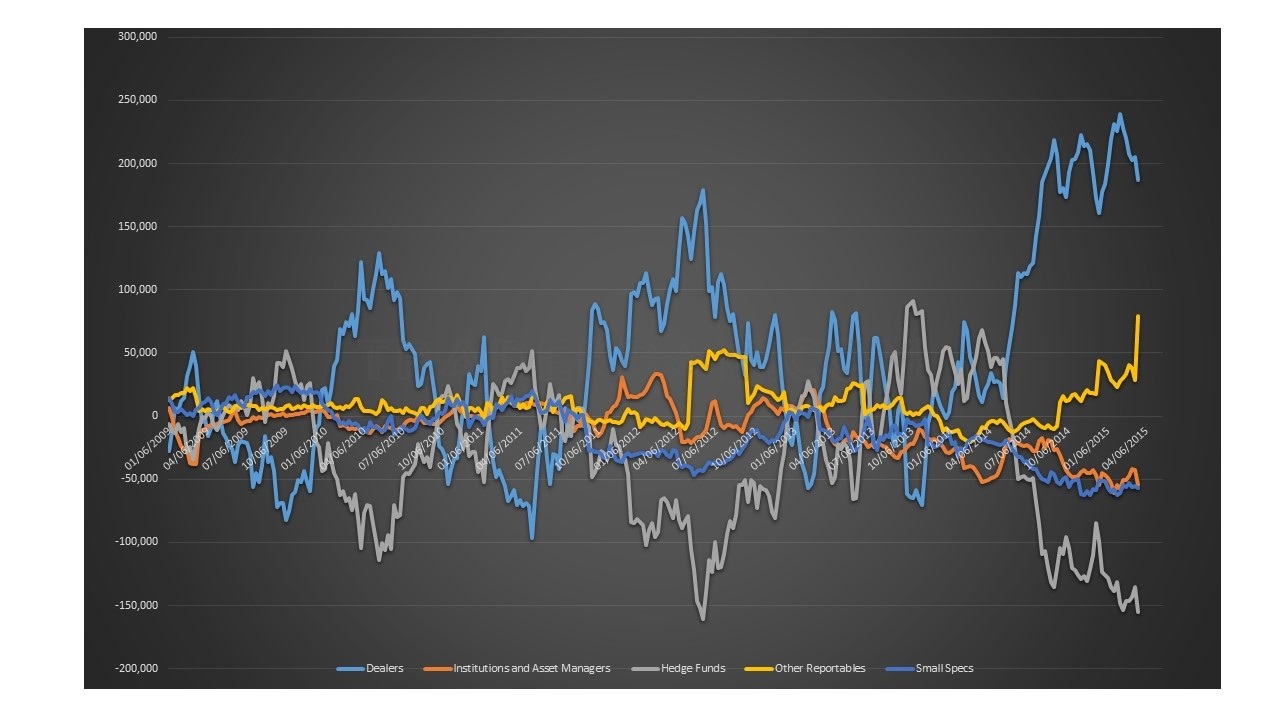
As you can also see, the hedge funds guessed wrong as well. A lot of longs in that category (there were not many in the first place) decided to get out ahead of the report as this camp was expecting a hawkish FOMC statement. Some in this category actually ADDED to existing shorts as well ahead of the statement. WHOOPS! They are now feeling a rather large amount of pain. Again, this is the reason one moves to the sidelines ahead of these major events or reports or at the very least reduces their position size. You just never know what you are going to get. Why risk it? This business is hard enough in the first place let alone exposing yourself to the potential for further harm by getting aggressive ahead of an event such as the FOMC statement. Next month, if you are trading currencies, lighten up ahead of that event!
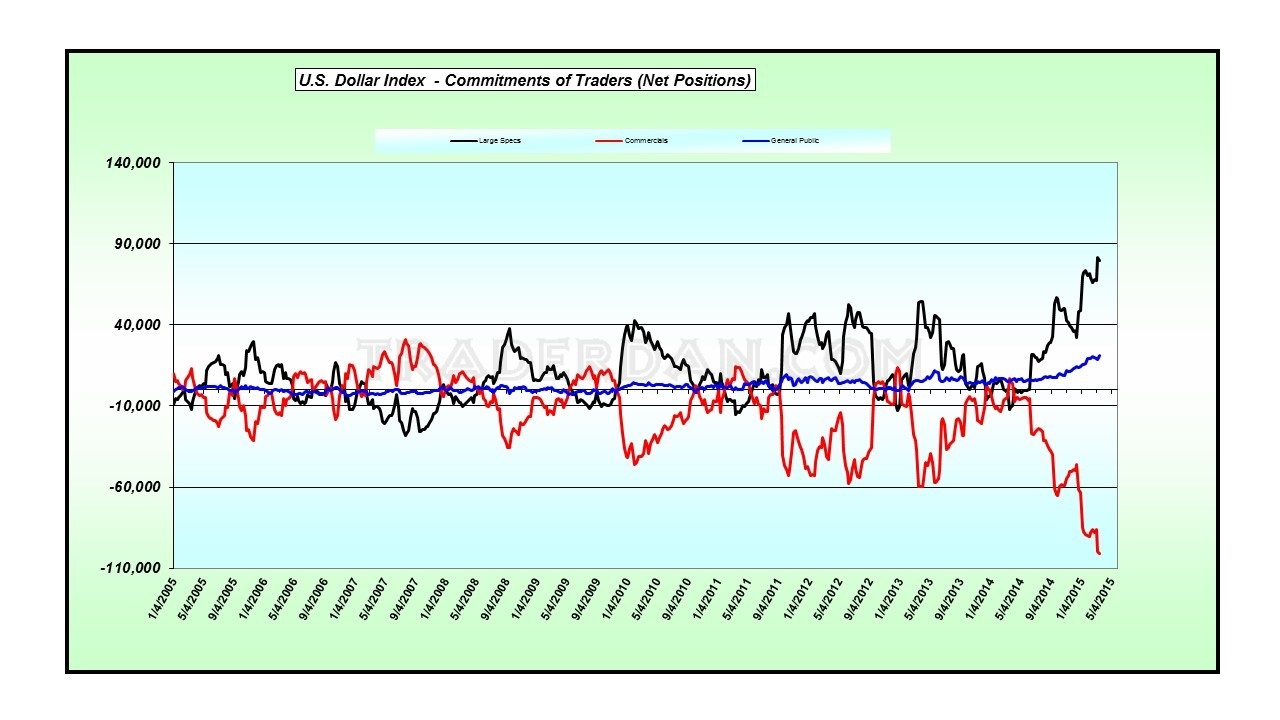
Lastly, here is the old form COT chart for the US Dollar Index. As you can see, there were quite a bit of speculators on the long side of the Dollar as of this past Tuesday. This chart will bleed out some of these longs over the immediate future. We’ll keep an eye on the chart and the price action to see when the price has stabilized and things calm down some.
********
Courtesy of Trader Dan http://traderdan.com/


