Fightback?


Angels At His Head, And Angels At His Feet, Just Like A Little Babe, Our Little Bear Does Sleep.
If by pure chance the persistent and severe attack on the prices of gold and silver is an inverse measure of the degree of general complacency and a belief of being in control of the PM markets among the members of the Cartel, then they are now in their worst state of panic since April 2013. Given the changed circumstances, with greater scarcity of the metals and a new predator on the prowl in the silver market, this panic of 2021 should set a new record.
For many, many years now, we have grown accustomed to regular attacks on the PM metal prices on particular dates and as time stepped on, at particular times of the trading days. Unlike the Emperor’s new clothes, this regularity is not visible to the media and most commentators on gold and silver; they do not see this pattern as evidence that the markets are not free and unfettered. Attempts to point out this fact are met my disbelief and ridicule; exactly as when the Emperor paraded his new outfit to the admiring crowd, the people only see what the Emperor wants them to see. They simply do not hear or see the modern version of a boy who is telling the truth.
For many, many years now, the regular months’ end harvesting of easy profits from the metal bulls who optimistically purchase options and futures proceeded with very few exceptions exactly as intended. During the final run-up to OPEX and FND days, the prices of the metals take a miraculous nose-dive to leave many of the optimists losing the money they have wasted in the hope of the trends favouring them. This fixed routine has surprisingly failed to attract wider market and official attention.
Except that things might be changing!

In the past, on days when options expire or when futures require full margin prices came under sustained pressure, to reach a low at a time when maximum profit can be delivered to the Big Banks. Then the price usually remained near that level for some time, presumably to make it seem the steep fall really was a normal market adjustment and not purposeful intervention.
The above two charts show the intra-day trading on Wednesday when April options expired. During the early morning, the prices of both metals extended the bear trend of the previous day, as if the world was still as it had always been on such a day. Then the unexpected happened and the prices rallied quite steeply. The rally must have caught the Cabal unawares, as it lasted all of most of an hour, or so. The price of gold rallied about $14 in that brief time and silver gained an impressive 68 cents, but that was as far as they could get before the Cabal woke up.
The end result of the subsequent attack was that both options expired a fraction below a popular round number, to make a good number of options worthless. It can be speculated that if the early morning attacks were not interrupted by the rallies, the metal prices would have continued lower to make the $1700 and perhaps the $24,50 option worthless – not the $1725 and $25 options as had happened.
Granted, the fight-back appears to have failed. It could be that the rampant bulls responsible for the rallies acted too early – almost as the US markets opened. They might have had more success if they had waited until an hour or so before the time of the expiration, even if by that time many more options would have been out of the money. It could be a lesson learnt that will pay dividends at the end of April. .
What happened on Wednesday, if so sustained, is one part of at least a two-prong attack on silver in particular. The second front that has been opened is the REDDIT Apes that intend to, firstly remove as much physical silver from the market as they can achieve by buying relatively small amounts of the metal, but doing so in their many thousands, irrespective whether it is coins, bars or shares in PSLV. They have also written a primer on COMMEX for their members who have the wherewithal and the desire to take delivery of COMEX silver and have it stored in own denominated vault, out of Cabal reach.
With the May contracts as the next big silver month and the experience of the rally on Wednesday and with a month to go while the Apes recruit more members, it is not inconceivable that the month of May could see a repeat of a year ago when the recent and unfortunately curtailed rally had started. That one gave the Cabal a big fright and then ran into a wall early in August. That reversal in the trend has been sustained for 9 months now. Should a new rally begin soon, as anticipated, it ought to be better funded than the one a year ago and less vulnerable to intervention.
By enforcing the bear trend in the PM metals for such a long time and to reach such low prices, the Cabal is hoping for two things to happen. The first, as always, is that the bullish longs will become despondent or run out of margin and close their long positions. The second is for hedge fund algorithms will reduce their long positions – the usual counterpoint to the Cabal shorts – and also go more short. As their net long position is reduced, the net short position of the Cabal also shrinks.
The charts below – copies of CoT charts for gold and silver – display the net positions of the commercials (red line), large specs (green line) and small specs (blue line). The charts offer a picture of how the spread between the net positions of the commercials and large specs over time. It is clear that there is good correlation between the changes in the net positions relative to each other and also relative to the price behaviour in the markets.
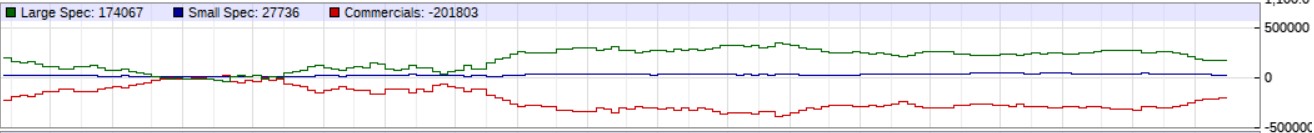

The charts cover the period from May 2018 to the present. From May 2018 to June 2019 both markets were mostly sideways to lower to form the end of the post 2011 bear market. By mid 2019 gold began to make a near consistent move higher. A more bullish outlook presumably had the large specs more bullish and the Cabal had to respond as sellers to contain the trend, both increasing their exposure.
Silver soon followed gold’s example, but the two net positions of the commercials and the large specs do not offset each other as cleanly as for gold – there had to have been some another factor. This might be that large specs preferred to play safe with silver, employing long-short spreads, while the commercials went more net short. In neither case did the small specs play a significant role.
The spread between the longs and shorts in gold remained wide throughout 2020 and only started to narrow in 2021 when the Gamespot affair raised concerns among the members of the Cabal. They had realised that a possibility exists that they could follow in the steps of the Gamespot hedge funds.
In March 2020 the silver spread narrowed, at the time of an attack to prevent the very large number of vintage in the money options. On 24 September the London fix was below $22.25 and I believe clear below the strike price of the options. The attack had the bonus for the Cartel that the large specs closed positions to enable the commercials to reduce the number of their short positions. Afterwards, the silver spread widened again as the price of silver had soon rebounded. The wider gap, like that for gold, then began to close a little during 2021.
The evidence supports a conclusion that the tactic to get the large specs more short is working for both metals, but more so for gold. In silver the large specs appear to still prefer long-short spread positions to play safe; perhaps they are scared of the frequent deep spikes in the price of silver? It can be expected that if the prices really take off, the large specs in due course would risk joining the throng of buyers in order to close some of the short legs of their suspected spread positions.
So far this tactic seems to work for the Cabal, for the near term at least. However, what do they intend once the prices of the metals again begin to increase? When the prices break above some unguessable level, large specs will become aggressive buyers to close their short positions, which will accelerate the rising trend. Do the Cabal intend to intervene again, or will they let the price run? That might depend on how far they have reduced their exposure to risk, balanced against their apparent commitment to maintain pressure on the PM prices.
If they do decide not to become large sellers again, their short positions will quickly become painful and compel them to compete with the other buyers – in a market with few sellers. The prices will rocket higher.
If they suppress the new rally, they will result in another increase in their short positions at prices much lower than what can be projected for a new silver bull market. It will be a step that only delays an even greater embarrassment to later when many smiling Apes and newly optimistic long term bulls have been adding to their positions and attracted many new buyers.
On the face of it and without being aware of any surprises the Cabal might spring on the market when the situation warrants it, it does look as if they are in a proper bind where their options are very limited and none of these promises offer an easy exit from their long term short position.
Tomorrow, Monday 29th March, is FND for the April PM contracts and what happens then and into April should provide more evidence on an imminent fight-back against the cartel, as suggested by the price action on Wednesday. The new week and the new month soon after could become more interesting than any other recent time.
The yield on the US 10-year Treasury note pulled back to hold within its longer term bull channel. The price of crude also reversed lower, back into its own longer term bull channel, but the break lower then failed to hold. The possibility of resuming the bear trend in bonds and the bull trend in the energy price remains on the table and will renew the threat of higher inflation should the two trends resume. The dollar index has reach significant resistance on Friday, but as yet with no other indication as to whether the latest rally has ended and could reverse to turn bearish again. On Wall Street Friday’s new all time high DJIA surely cannot be a surprise for anyone.
Euro–Dollar
The dollar had a sudden new lease on life after 6 January, when the two Republican candidates for the Senate were sent home and not to Congress. That in may have been a signal that the results of the presidential election would stand and further implied the markets expected that a Biden presidency would be good for the dollar.
What was then known about the policies of the new administration makes this bullish change in the dollar’s fortunes difficult to understand. The actual evidence so far, 12 weeks later, with massive printing of dollars, new high trade deficits and with Yellen in the Treasury ready and able and willing to employ the printing press against problems of a financial or economic nature has brought no clarity about the renewed strength of the dollar.
What happens next all depends on whether the euro support at line D will hold or not. An answer should not be too long to come.
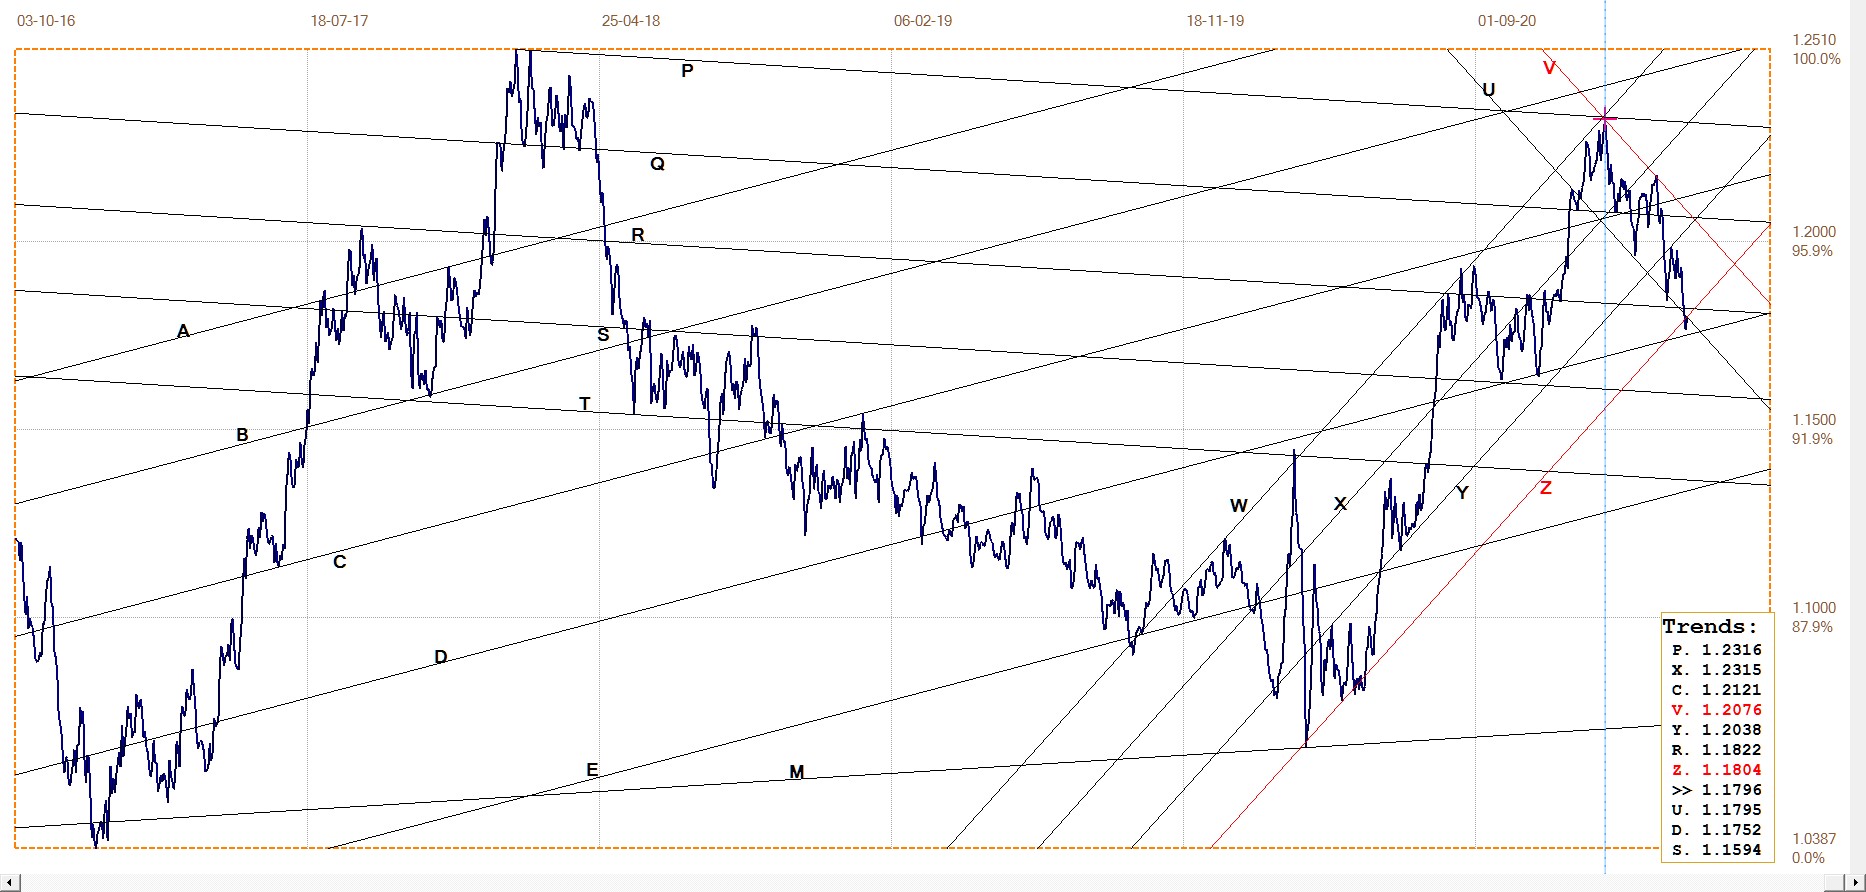
Euro–dollar, last = $1.1796 (www.investing.com)
DJIA daily close
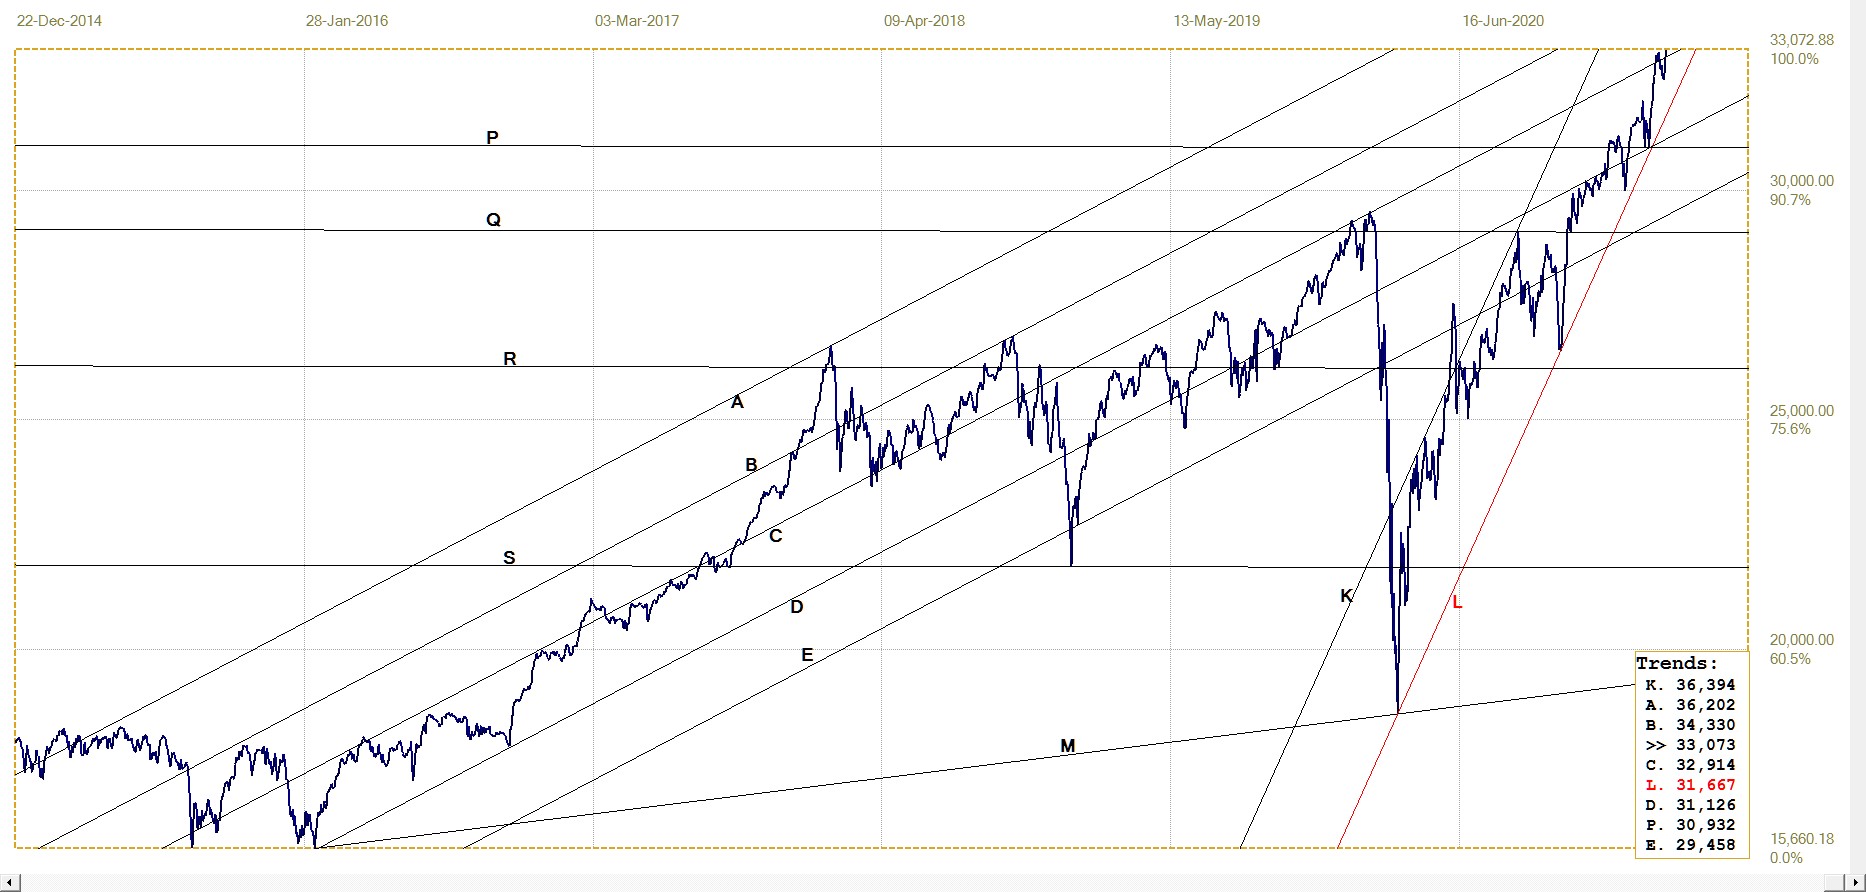
DJIA. last = 33072.88 (money.cnn.com)
The DJIA achieved another all time high on Friday – this despite the number of days that recently started and ended with steep declines and the other days that started lower and surprisingly ended with steep gains. On the one hand we have the many commentators warning of the collapse of the stock market and on the other there are the many people with access to the new printed dollars who choose the stock market over Bitcoin as the place to invest.
Then there are the third group, who have deep pockets and a commitment that binds them to ensure that Wall Street will not confirm that the economy is not nearly as healthy as the government, their statistics and the media proclaim. Talk of a bear market is cheap while the dollars that keep flowing into Wall Street have the louder voice.
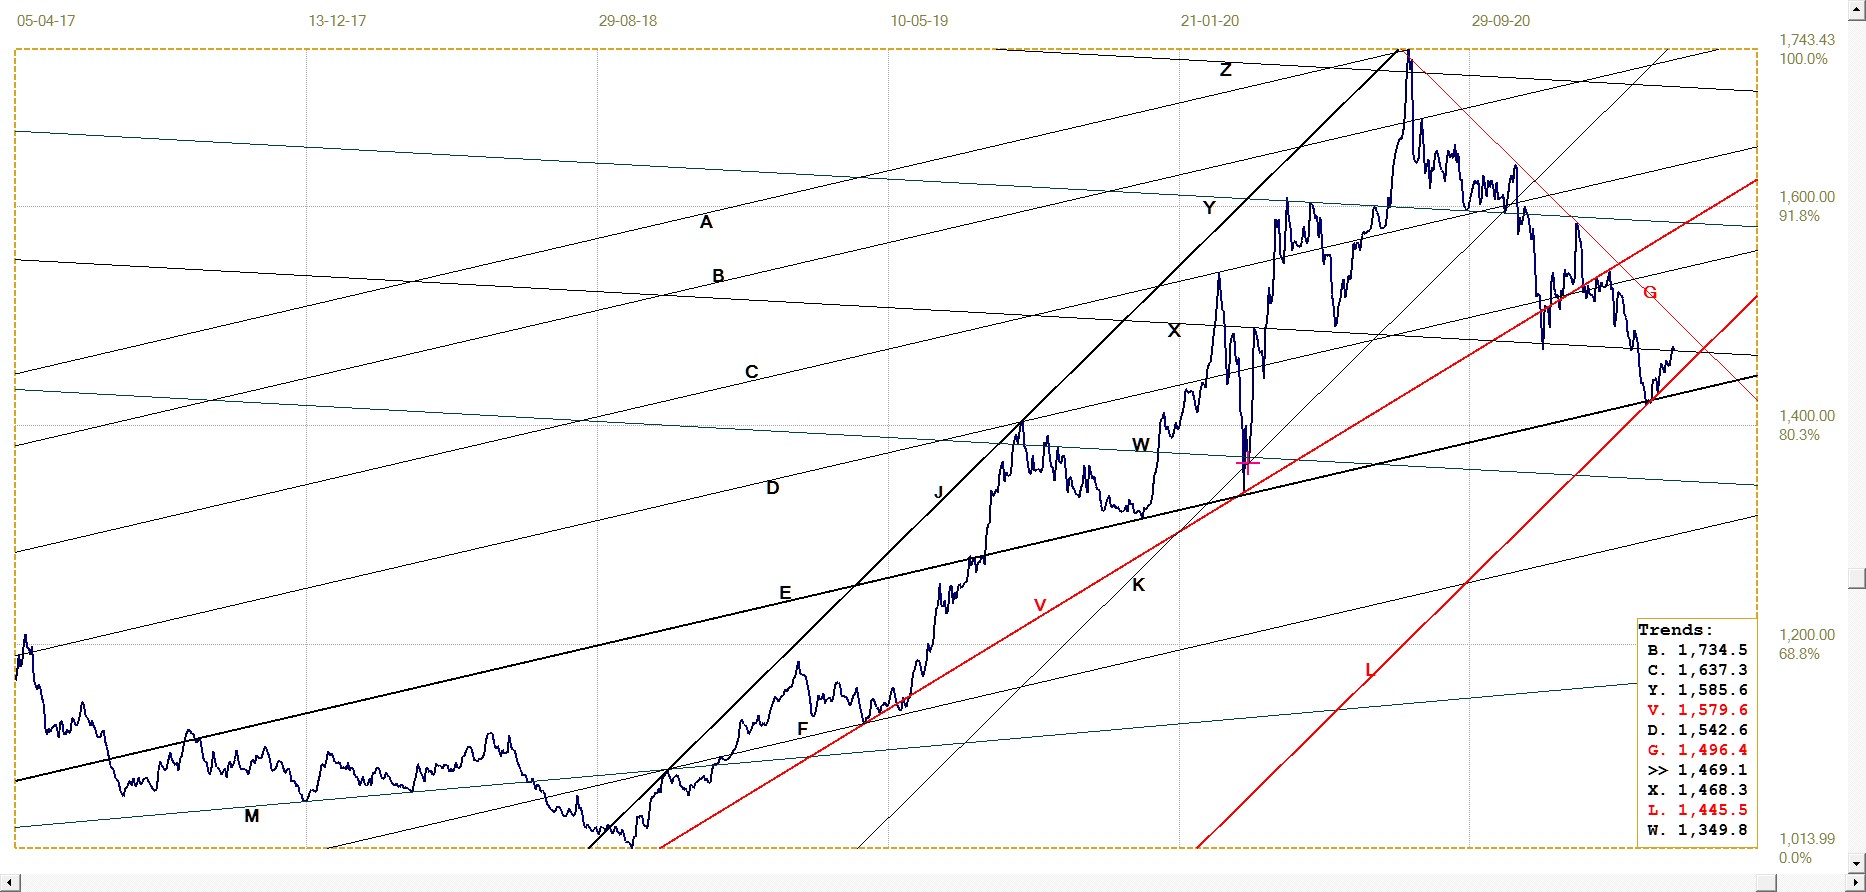
Gold London PM fix – Dollars
Gold price – London PM fix, last = $1731.80 (www.kitco.com)
As long time readers know, the two-part channels in these charts often have ratios that correspond to certain specific values, of which the Fibonacci ratio is one of the more important ratios. Line L of the channel pair JKL has been moved to the recent low to result in a ratio for the channel of 389:611 – less than 10 pips away from the Fibonacci ratio of 382:618. This suggest that the latest trend reversal could define the lower boundary of a new channel JKL. This is tentative, but it hints the Cabal might be in the process of losing control of the price of gold. A break above lines X and G would support this hint. That will require a London PM fix at or above $1707 on the FND on Monday, 29th March.
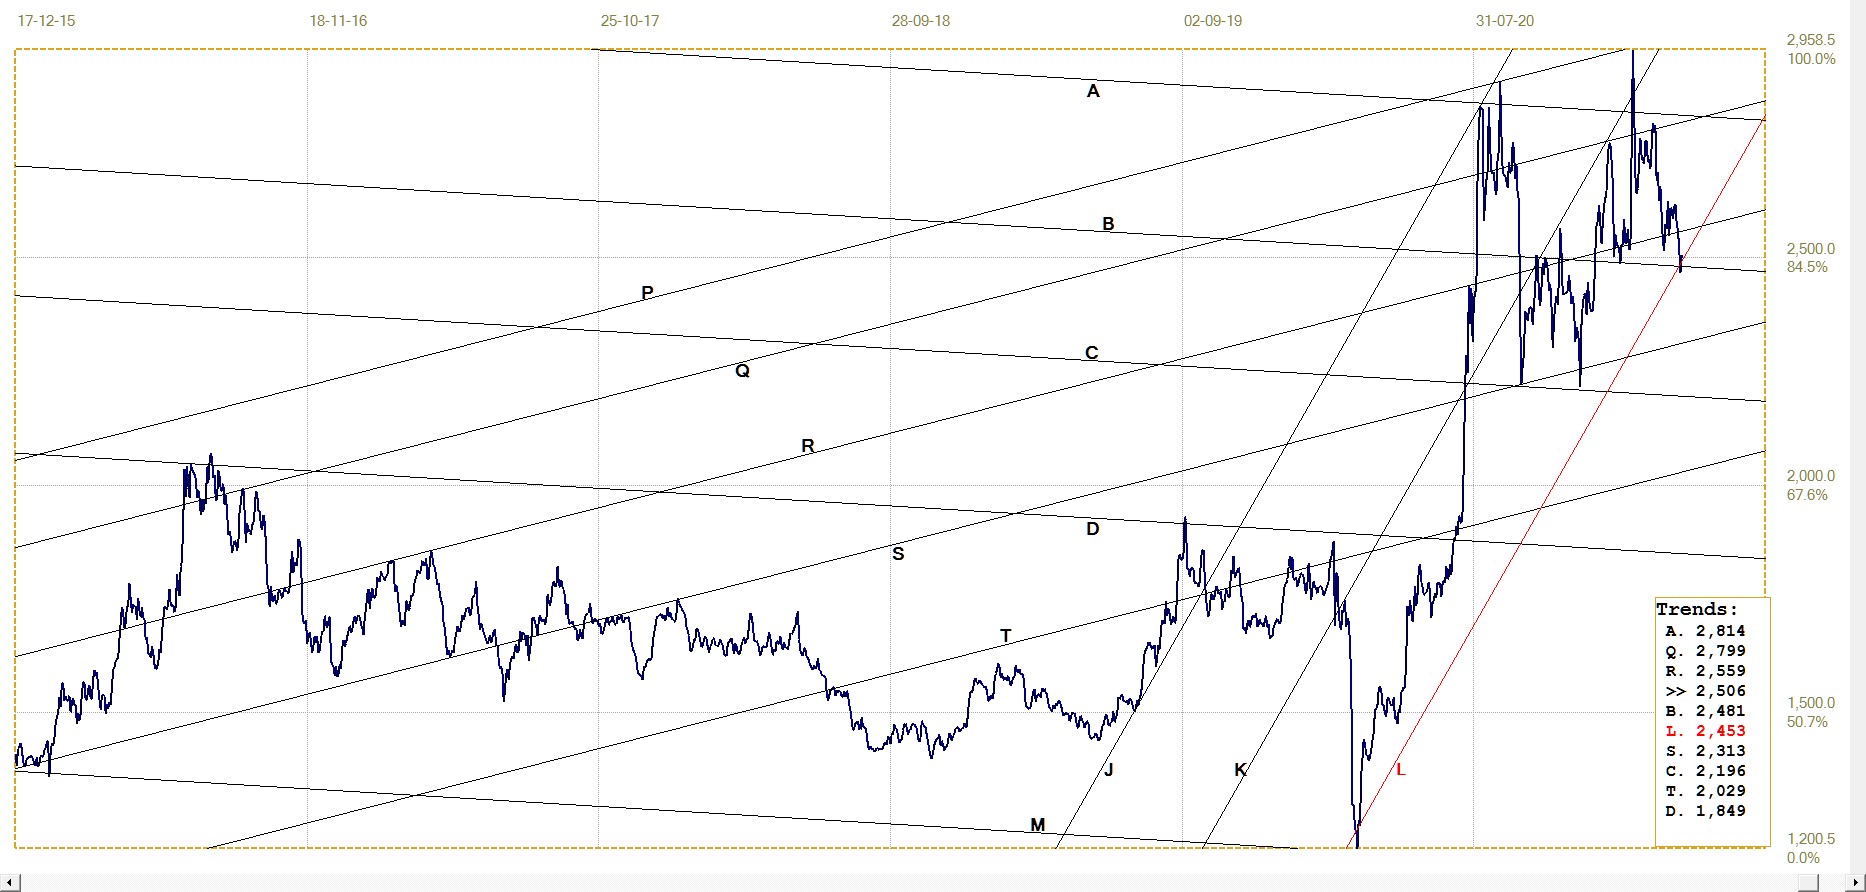
Euro–gold PM fix
Euro gold price – PM fix in Euro. Last = €1469.09 (www.kitco.com)
Here we have a similar channel JKL with a ratio of 443:557, which is close to the 450:550 ratio that is also often seen on these charts. This adds further support to the possibility that the decline is over – even though we still have FND on the 29th to contend with. If the London PM fix can hold above €1445 on Monday – which is well before the battle for the old price on COMEX will conclude – a little sigh of relief by the gold bulls could be justified.
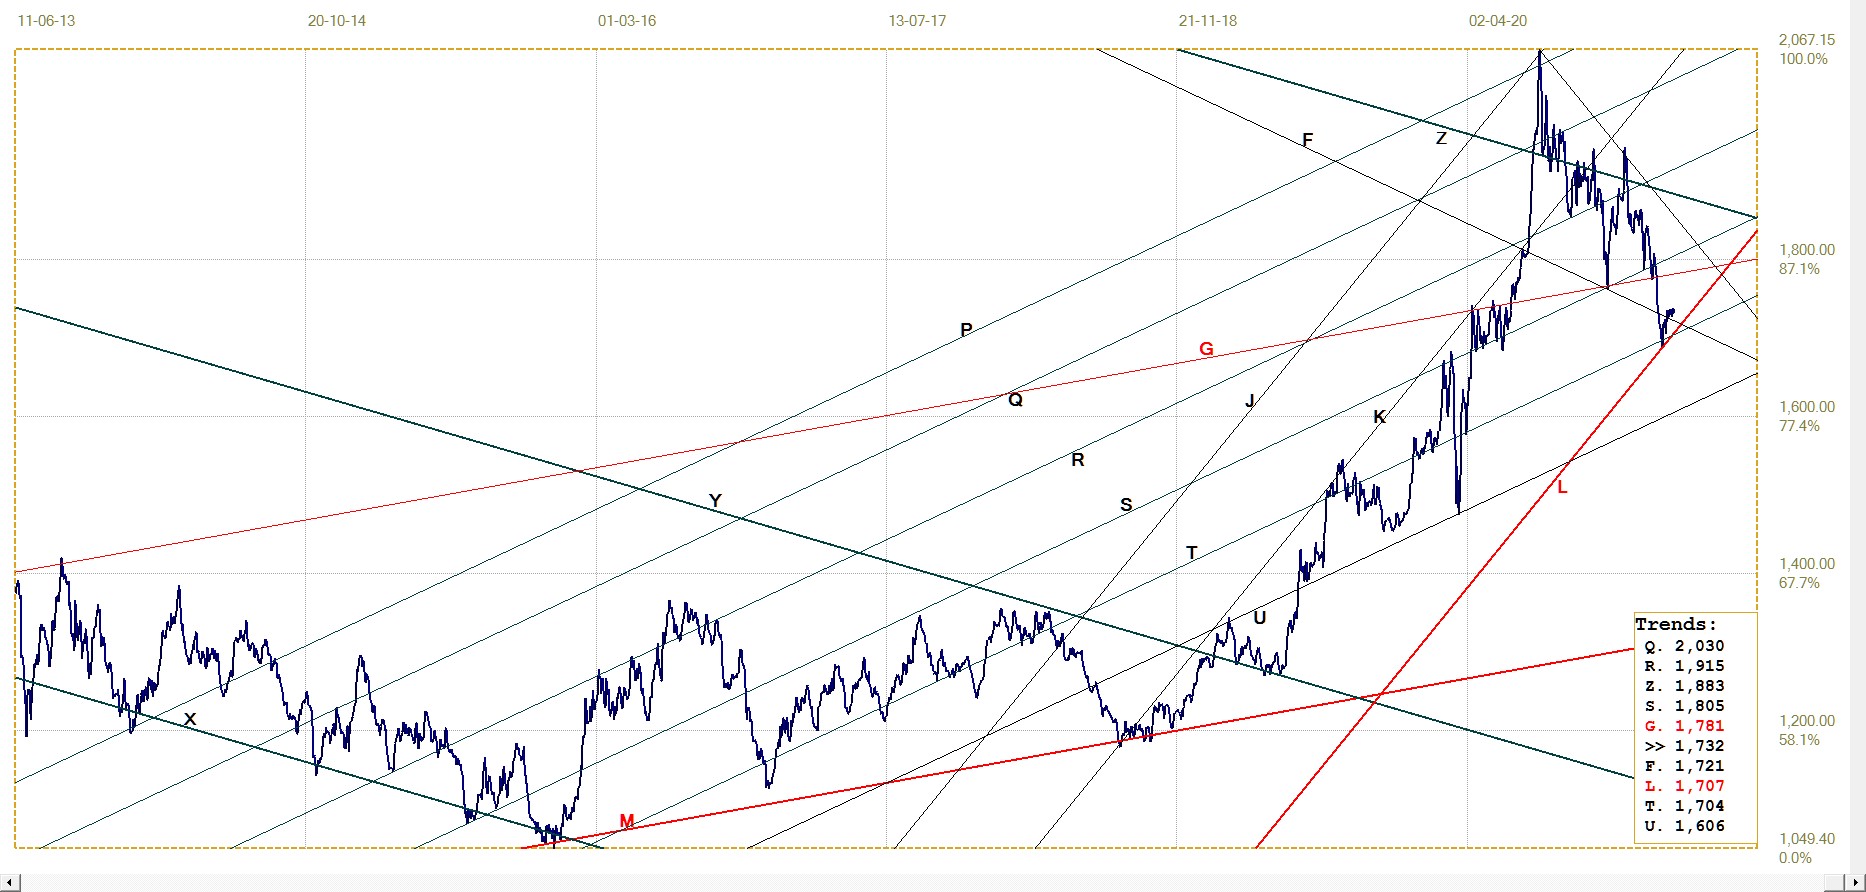
Silver Daily London Fix
Silver daily London fix, last = $2505.5 (www.kitco.com)
Will it be lucky three times in a row? In the charts of dollar and euro gold, the bull channels had the lower boundary shifted to the recent low on the chart. In both the charts of the dollar and euro prices of gold the ratios of the two bands of the steep channels were close to known channel ratios; to suggest that the low point of the new correction might be in place and that the bull channels might hold.
The chart of the silver price offer a similar channel pair JKL with a ratio of 503:497, which differs little from the 500:500 ratio of a major channel which is symmetrically divided into two sub-channels of equal width. The new line L is located in a narrow bifurcate low of the price, which is recognised as an important anchor point in this kind of analysis. Hopefully the coincidence will prove to be more than only a chance event and the bull now stands ready to replace the manufactured bear.
U.S. 10–year Treasury Note
After having accomplished important breaks above three resistance levels during the past few weeks the yield on the 10-year Treasury is taking a breather – or, still as a possibility, preparing to reverse trend. Most analysts will regard the latter as a near impossibility, but the way many markets have been behaving it would be a foolish person who completely discounts even such a remote possibility. The safer choice is to join the large amount of funds behind the bets that the yield will be moving higher during most or all of 2021.
U.S. 10–year Treasury note, last = 1.674% (www.investing.com )
West Texas Intermediate crude. Daily close
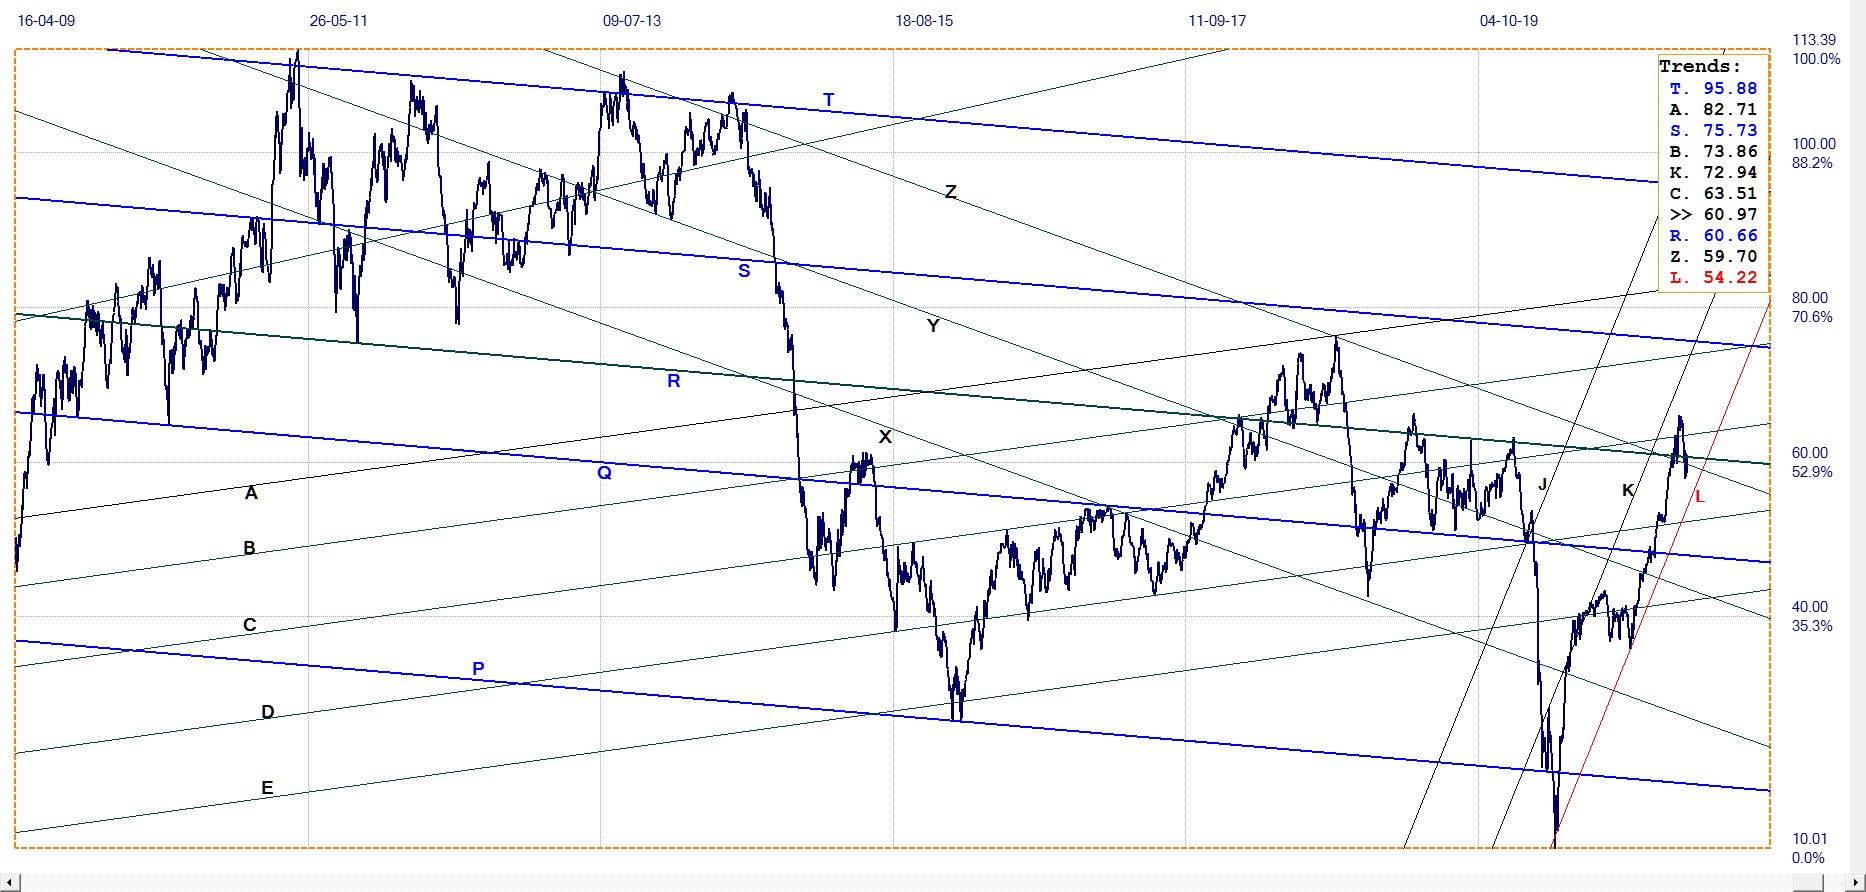
WTI crude – Daily close, last = $60.97 (www.investing.com )
After breaking to a new high above channel PQR and also above line C, the price corrected lower to break below line R and also back into bear channel XYZ, Then the price rebounded higher again, back above channel YZ and line R, to hold in the steep bear channel JKL
Line K of this channel is also located in a bifurcated low, similar to line L on the silver chart. The ratio of this channel pair is 601:399, close to the often seen ratio of 400:600. This also suggests the prospect of a significantly lower price for crude oil do not have a high technical probability. Inflation pressures probably will remain high and increase more in due course.
© 2021 daan joubert.


