Forecast: The Gold Cycles Were Right


 Last week's trading saw gold forming its low in Monday's session, here doing so with the tag of the 1791.00 figure. From there, a slingshot higher was seen into later in the week, with the metal pushing all the way up to a Thursday high of 1835.00 - before backing off the same into the weekly close.
Gold, Short-Term
From the comments made in past articles, the most dominant short-term cycle for the Gold market is the 34-day wave, which is shown again on the chart below:
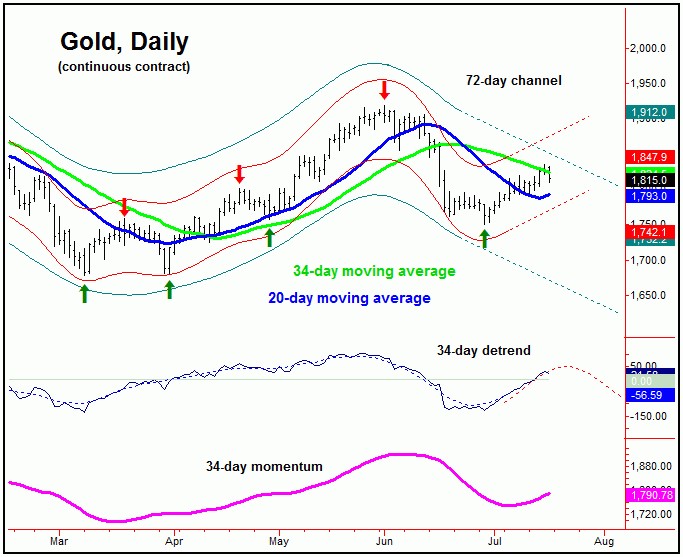
The last short-term correction phase into late-June was the odds-on favorite to bottom this 34-day cycle, with the 1750.10 swing low being the confirmed trough for that move. With that, the overall assumption was that this wave was heading higher into mid-July or later:
From last weekend: "since a cycle will revert back to a moving average of the same length better than 85% of the time, the probabilities will favor a push on up to the 34-day moving average in the days ahead, before topping this 34-day component. This moving average is currently at the 1837 figure (August, 2021 contract) - but which is declining daily."
With the action seen into late last week, we can see that our 34-day moving average magnet for Gold was indeed satisfied with the rally into Thursday's session - thus meeting our minimum expectation for the recent rally. This same moving average was also mentioned as being a key short-term resistance level for the metal:
From last weekend: "the 34-day moving average is at or near the top of the extrapolated (and declining) 72-day cycle channel - thus also making it a key resistance level for the metal. With that, if the rally up off the late-June trough is going to end up as a countertrend affair, then it would likely have to stop at or near this 34-day moving average and/or the upper 72-day channel line."
As noted, the same 34-day moving average would also act as key short-term resistance for Gold, which did repel the action for a pullback into Friday's session. Having said that, I am favoring the current pullback to end up as an eventual countertrend dip, due to the position of the larger 72-day cycle, shown again on the chart below:
In looking at our 72-day wave, of note is that our detrend indicator is projecting higher prices overall in the next month or so (i.e., mid-to-late August). Having said that, Gold needs a push on through the upper 72-day channel in the coming days to actually confirm that assessment, with an exact upside ‘reversal point’ for this wave noted in our thrice-weekly Gold Wave Trader market report.
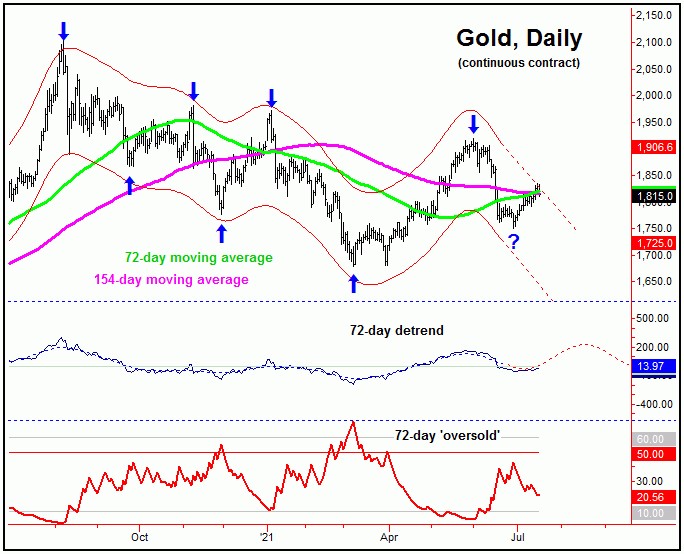
Going further with the above, a confirmed turn with our 72-day cycle would favor additional strength into the aforementioned mid-to-late August timeframe, with the potential for a push back to or above the early-June highs - before working on the next key price peak. That peak is expected to come from the next larger wave, the 154-day component, which is shown again below:
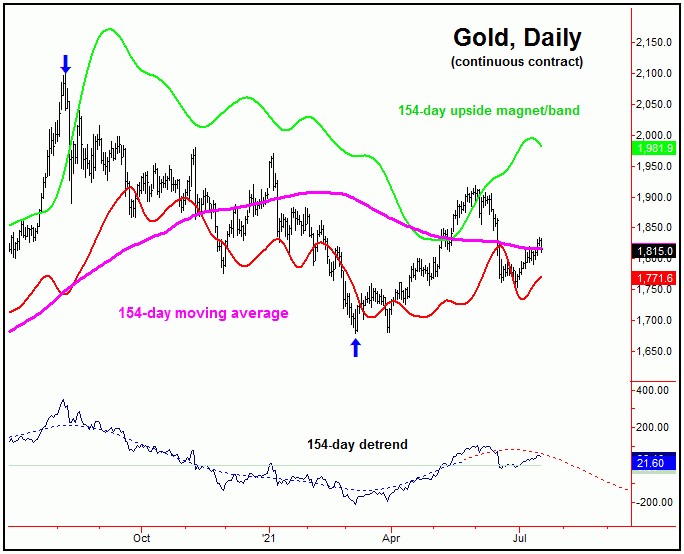
Stepping back then, as mentioned above, the upward phase of the 72-day wave should be the one that tops this larger 154-day cycle, for what is expected to be a larger percentage decline into the Autumn of this year. In terms of patterns, however, the ideal path is looking for that decline to remain above the March, 2021 trough, and - if correct - should give way to higher highs into early 2022 or beyond.
U.S. Stocks Vulnerable to Larger-Degree Decline
As mentioned in past articles, the U.S. stock market - as measured by the S&P 500 index, (or 'SPX') - has been in the process of forming a mid-term price top. That top is expected to come from the combination of the 180 and 360-day cycles, with the larger 360-day component shown again on the chart below:
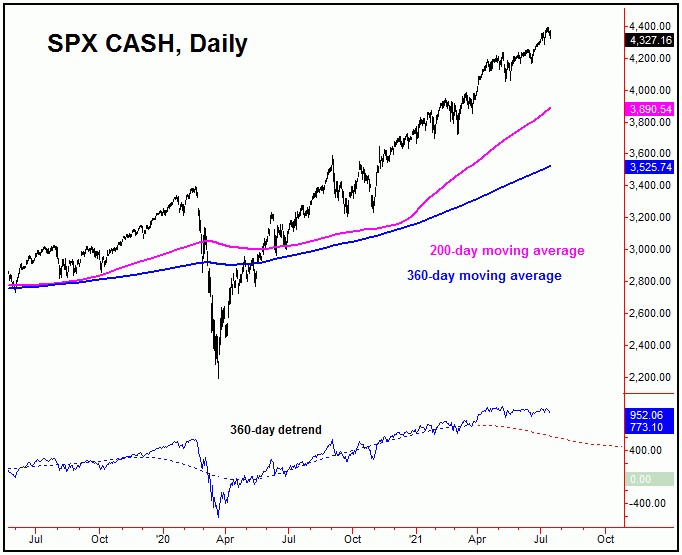
In terms of price, the downward phase of this 360-day cycle is likely to see the SPX in its largest percentage decline of this year, which means something greater than the 5.7% drop seen from mid-February into early March. The average declines into a 180 and 360-day low have been around 10% or more off the top, with the 200-day moving average acting both as a potential magnet - and as a key level of mid-term support for this index.
Even with the decline seen into last week - which we were able to call correctly in our daily Market Turns report (which covers the U.S. stock market) - we have yet to actually confirm the next mid-term correction phase to be in force. With that, we are watching a key downside ‘reversal point’ in the days ahead, which, when taken out, will be our best indication/confirmation of the next mid-term peak.
For the longer-term outlook, the coming mid-term correction in U.S. stocks is expected to be a natural retracement - inside an even-larger bull market phase, one which is projected to last well into later next year, before the next major peak attempts to form. That peak should come from the next larger wave, the four-year cycle, which is something we will take a look at in more detail in a future article. Stay tuned.
Jim Curry
The Gold Wave Trader
http://goldwavetrader.com/
http://cyclewave.homestead.com/
********


