Forecast: Gold Drops Right on Cue - What's Next?


 Recapping Last week
Last week's trading saw Gold forming its high in Monday's session, here doing so with the tag of the 1818.90 figure. From there, a sharp decline was seen into late-week, with the metal dropping all the way down to a Friday low of 1759.10 - also ending both the day and the week at or within earshot of the same.
Gold, Short-Term
For the near-term action, as mentioned last weekend, we were back into short-term topping range for Gold, and with that were on the lookout for a decent correction to play out - some of which was seen with the action into last week.
From last weekend: "we have now met this (72-day moving average) expectation - and thus are back into short-term topping zone. The next short-term peak for Gold is now expected to form at anytime - coming from the combination of 10 and 20-day cycles. In terms of price, the next downward phase of the 10 and 20-day cycles is favored to drop back to the 20-day moving average before bottoming."
In terms of price, the last rally up was favored to hit the 72-day moving average before topping, which was met on 8/10/22 with the tag of the 1824.60 figure. In addition, we mentioned the 1824-1833 region as being key resistance to the swing up, which did halt the rally - peaking right on that 8/10/22 date.
With the above said and noted, the current short-term correction is coming from the 10 and 20-day cycles for Gold, with the smaller 10-day wave shown again on the chart below:
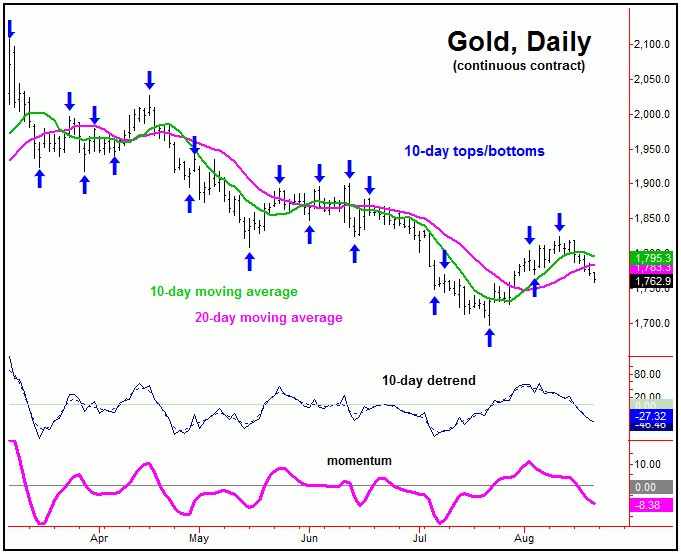
In terms of price, as mentioned last weekend, any reversal below the 1797.00 figure (December, 2022 contract) would confirm a turn south with the 10 and 20-day cycles. That action played out in last Monday's session, thus triggering the recent short-term correction to be back in force.
For the near-term then, the downward phase of the 10 and 20-day cycles is currently in progress, with the ideal path having called for a drop back to the 20-day moving average - which has now met with the recent action.
In terms of patterns, until proven otherwise, the overall assumption is that the current correction phase with the 10 and 20-day cycles will end up as a countertrend affair, holding above the 1696.10 swing low from back in mid-July.
Gold's 3-12 Week View
If the current short-term decline does end up as the favored countertrend affair, then the probabilities will favor a push back above the 1824 swing top on the next swing to the upside with the 10 and 20-day cycles, ideally playing out into the late-August to mid-September timeframe.
In terms of price, it is too early to confirm the next upside reversal point for the 10 and 20-day cycles, though one should ideally materialize in the coming days, with the most current numbers always posted in our Gold Wave Trader report.
Going further, higher highs on the next swing up would put the larger 72-day cycle back into topping range. Here again is our 72-day wave:
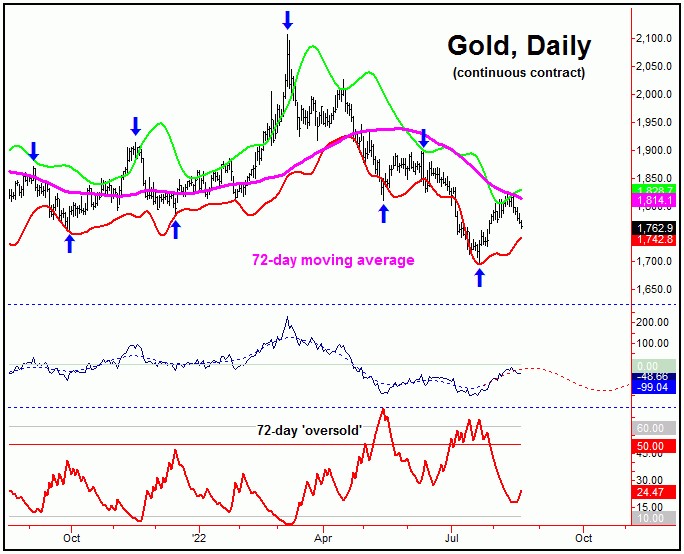
Stepping back, the ideal path is looking for the next correction phase of our 72-day wave to decline into the mid-October timeframe, with the potential for that move to take out the last 72-day low of 1696.40.
For the mid-term picture, the next 72-day trough into October should also end up as the low for the bigger 154 and 310-day cycles, with the 310-day wave shown again on the chart below:
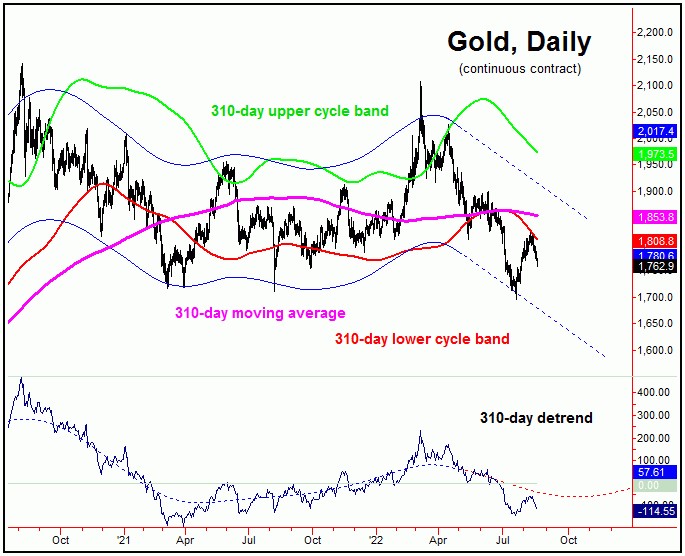
From whatever low that does form with the combination of 72, 154 and 310-day cycles, the probabilities will favor a sharp rally of 20-25% or ore playing out into what looks to be the Spring of next year. Thus, this will be a rally you will want to try and catch, with the minimum upside potential being the upper 310-day cycle band, which is well above current price levels. More on all as we continue to move forward.
Jim Curry
The Gold Wave Trader
http://goldwavetrader.com/
http://cyclewave.homestead.com/
********
More from Gold-Eagle


