Forecast: Gold Looking for a Low & U.S. Stocks Ready to Tumble


 With the overall action seen in past weeks, Gold is still in a correction phase - though is into bottoming territory. As for the U.S. stock market, the SPX has been inside a bigger 'vacuum' window - sucking prices higher - but appears on the verge of a sharp decline phase, one which is readying to take hold at anytime.
First, a look at the Gold market.
Gold's Dominant 72-day Cycle
As originally noted in my article from back in December of last year (and again back in January of this year), the downward phase of our 72-day cycle had assumed control of the Gold market, and was still seen as pushing lower. Here again is that wave:
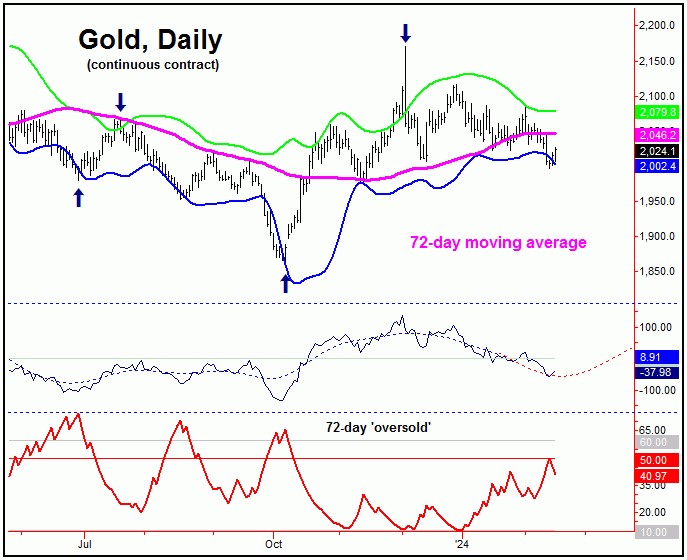
From my 1/24/24 article for Gold-Eagle: "in terms of price, the best 'look' was for a drop back to the 72-day moving average for Gold - which has now been satisfied with the action into last week. Having said that, the lower 72-day cycle band will normally be hit as well, which has fallen just short - and with that the most recent bounce seems likely to fail."
As mentioned above, the 72-day moving average (our normal minimum price magnet) had been hit on the decline into January. Having said that, since prices will normally also drop back to our lower 72-day cycle band (which looks similar to a Bollinger Band), the probabilities favored the bounce into late-January/early-February to end up as a countertrend affair - to be followed by lower lows on the next swing down.
With the above said and noted, we have recently dropped back to lower lows for the swing - as suggested - and with that are into bottoming range for Gold. However, there are no firm indications this low has yet been reached, and with that we could see the most recent bounce also failing - giving way to lower lows for the swing.
Gold Timing Index
Our main (proprietary) indicator for analyzing Gold is our 'Gold Timing Index', which is a combined sentiment and momentum measure, and gives us telling information on what to expect in regards to price. Here again is that indicator:
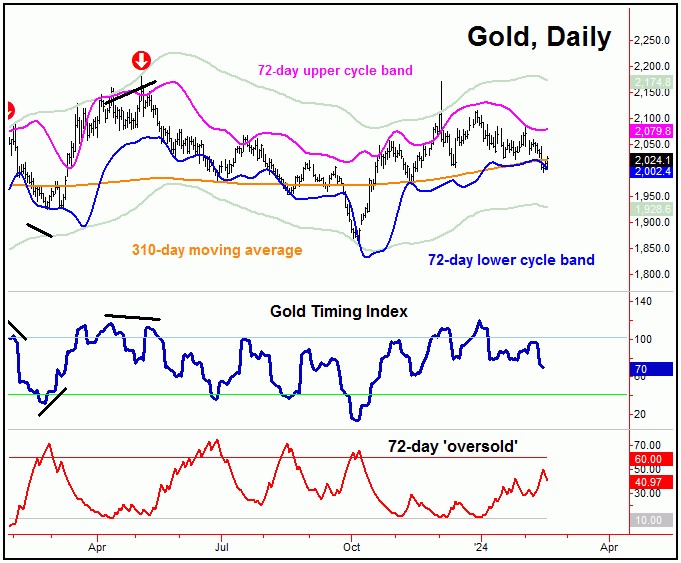
This Gold Timing Index offers up key information at both tops and bottoms. Important signals are generated when divergences are present, and/or times when the indicator drops below its lower reference line.
As an example, back in early-May of last year our largest cycle - the 310-day wave - was into topping range. This indicator gave a topping signal on 5/4/23, with the red (sell) arrow posted in real-time, in our market report. The downside 'risk' to the following decline was back to the 310-day moving average - following my rule that a cycle will revert back to a moving average of the same length better than 85% of the time.
With the above said and noted, in looking at the current action from our Gold Timing Index, there is no particular divergence having formed at the most recent low. Going further, we like to see this indicator dropping to the 40 level or lower at key bottoms, which it has yet to do - but is starting to move closer.
Adding to the notes above, should our Gold Timing Index continue to decline in the days ahead (i.e., to 40 or below), it would be the strongest technical signal that a key bottom is forming for the Gold market.
This is important, as what follows should be a sharp rally of some 10-14% or more off that bottom, which is the statistical average rally range for our 72-day time cycle, when coming off the pattern of a 'higher-low'.
With the above assessment, the near-term action tends to favor something like this: a countertrend bounce that is followed by lower lows on the next swing down, which could create the bottoming setup that we are looking for with our Gold Timing Index, with the latest numbers always posted in our Gold Wave Trader market report.
Gold's Bigger Picture
In terms of patterns, the overall assumption has been that the current correction phase with our 72-day cycle will end up as an eventual countertrend affair. This is due to the configuration of our next cycle, the larger 310-day component:
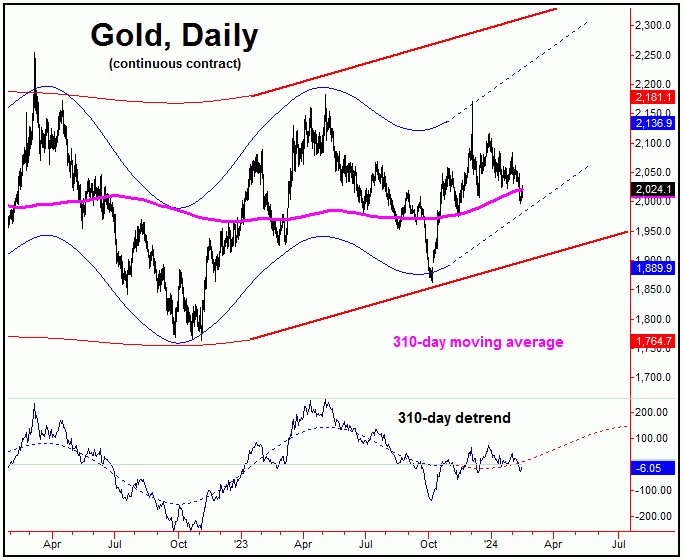
Our 310-day cycle last bottomed back in early-October of 2023 (right where it was projected), and with that has been viewed as pointing higher off the same - with its current upward phase ideally holding up into late-Spring or early-Summer of this year.
With the above said and noted, a countertrend decline with our smaller 72-day cycle - if seen on the current rotation - should favor a sharp rally of some 10-14% or more for the metal, ideally playing out into later this Spring.
In terms of price, we have a key 'reversal point' for Gold, a number - when broken to the upside - will confirm the next upward phase of this 72-day wave to be back in force, with more precise details noted in our Gold Wave Trader report.
U.S. Stocks Topping Out
From the comments made in past months, the upward phase of our 180-day cycle was deemed to be in force, with the ideal path looking for a 17% rally or more on the SPX - one which would take the index back to or above the all-time highs into early this year. Shown below is that 180-day cycle:
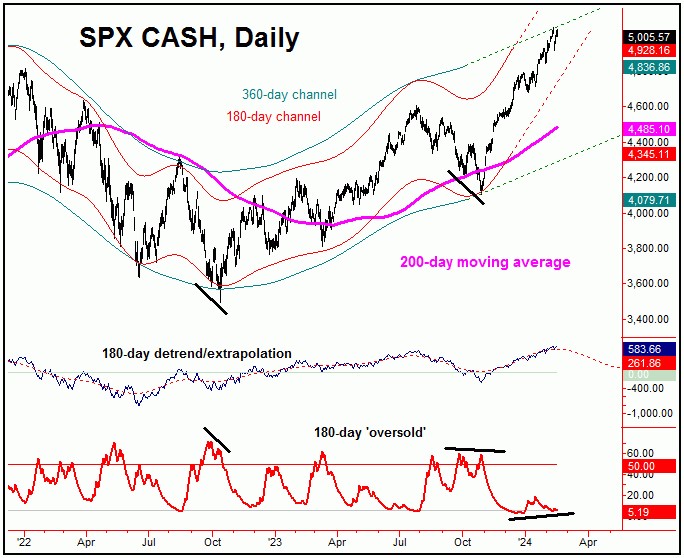
In terms of time, we are now in the range for a peak with this 180-day cycle on the SPX, with the next move favored to be a sharp correction into this Spring, a move favored to end up as a (larger) countertrend affair.
In terms of price, once our 180-day cycle tops out, the downside 'risk' is back to the 200-day moving average on the SPX. This same moving average is also viewed as a key level of mid-term support - if the bigger uptrend is to remain intact into later this year, as is assumed. If correct, what follows should be another sharp rally of some 14-17% playing out into later this year.
Technical Warning Signs
When in the timeframe for a mid-term cycle top, we like to looking at technical signals, with one of these being our Mid-Term Breadth index, shown on the chart below:
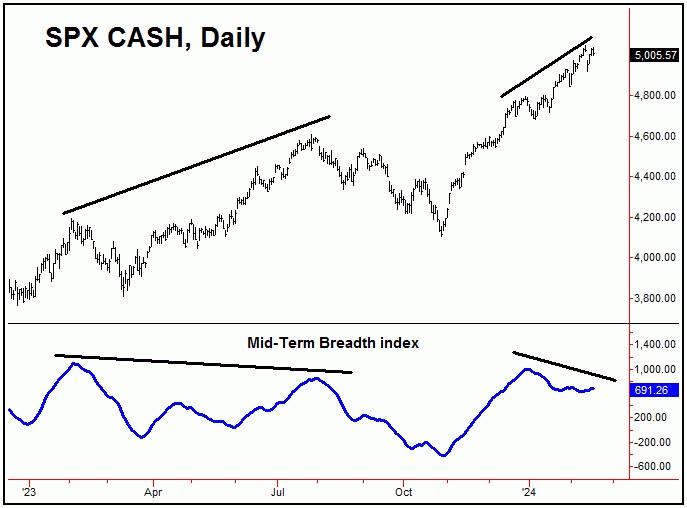
In looking at this Mid-Term Breadth index (in blue), the indicator is showing a decent divergence from the higher price high on the SPX - which is viewed as a firm technical negative for the market. This indicator is what we expect to see diverging at a mid-term peak for U.S. stocks, and with that is seen as supportive of a key top forming.
Going further with the above, we also like to look at our proprietary sentiment index for U.S. stocks, which is shown on the chart below:
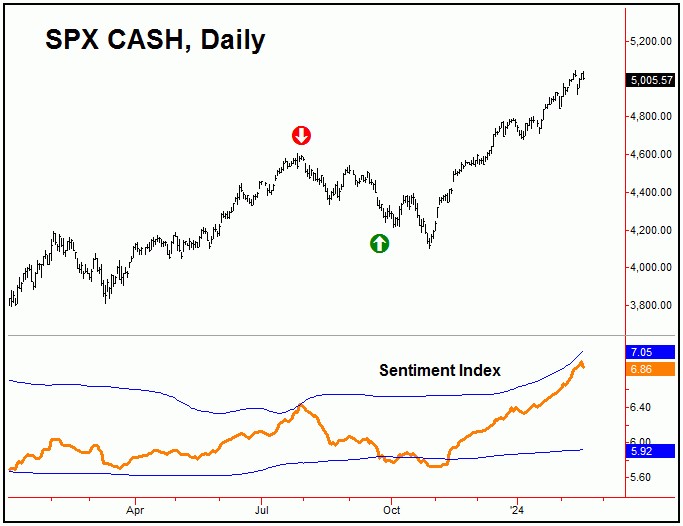
Of note is that our sentiment index (published in our Market Turns report, which tracks the U.S. stock market) last moved to a 'sell' signal within one trading day of the July, 2023 price peak. From there, the market saw a sharp correction into October, where it moved back to the 'buy' side of the market. This model gained 39.3% for last year, vs. the 24.2% gain for the SPX.
With the above said and noted, our stock market sentiment index is inching back towards its upper 'sell' boundary, though remains below it at the time of this writing. This is something we will be watching with a good deal of interest in the days ahead, with other technical signals certainly in place - and looking for a sharp decline to begin at anytime. Stay tuned.
Jim Curry
The Gold Wave Trader
Market Turns Advisory
http://goldwavetrader.com/
http://cyclewave.homestead.com/
********
More from Gold-Eagle


