Forecast: Gold Turning & Rare Signal For U.S. Stocks


 Recapping the Gold Market Last Week
Last week's action saw gold forming its peak in Tuesday's session, with the metal spiking up to a new high for the move, here hitting a top of 1856.40. From there, a sharp decline was seen post-fed, with the metal dropping all the way down to a Friday low of 1780.60. Note: we now move to the April, 2022 contract for our new numbers.
Gold, Short-Term View
As mentioned last weekend, the last short-term peak was due to materialize for gold, with that high expected to come from our 20-day cycle, shown again below:
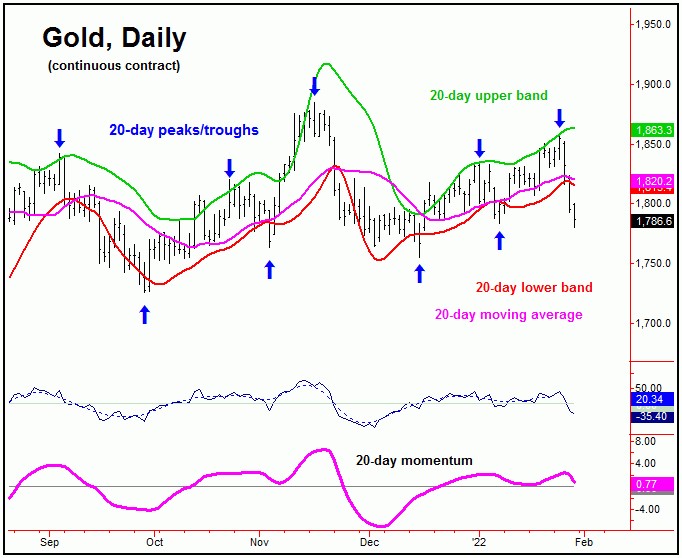
From last weekend: "the current short-term upward phase should end up topping our 20-day cycle once again, with this wave now at some 10 trading days along from its last labeled trough. In terms of price, the probabilities should favor another correction back to the 20-day moving average going forward, which is our normal magnet to the downward phases of this 20-day wave."
As noted above, the 20-day cycle was at or into topping range into early last week, with that correction phase later confirmed to be back in force by a reversal below the 1827.00 figure - and mentioned in advance in our Gold Wave Trader market report.
With the above said and noted, our 20-day cycle is now some 15 trading days along, and with that the next short-term bottom is expected to come from this component. Once this low is complete, a quick rally back to the 20-day moving average or better should be seen in the days to follow, before the another swing high forms.
Gold's 3-5 Week Picture
As mentioned in past articles, the last bigger low came from our larger 72-day cycle, which was projected to bottom back in mid-December. From there, its upward phase was later confirmed to be back in force, with the ideal path looking for strength into the mid-January to mid-February timeframe.
Here again is our 72-day component:
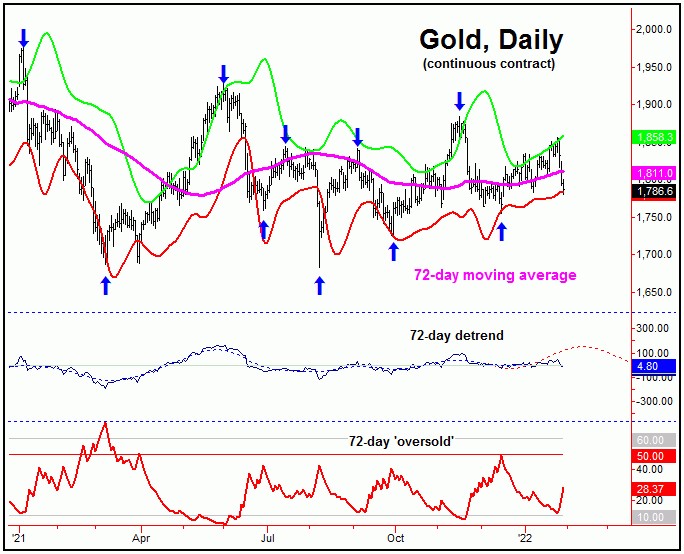
In terms of time, the most recent high was made on January 25th, which was within our topping range for this 72-day wave. With the action seen into late last week, the probabilities now tend to favor this cycle to have topped, with its next trough (if made on schedule) due later this Spring.
Rare Signal for U.S. Stocks
With the sharp decline seen to kick off the year 2022, I thought we would take a closer look at the U.S. stock market this weekend - due to the fact that there is a key signal that has recently formed.
For the mid-term picture, our call (in our daily/weekly Market Turns report) was for the biggest percentage correction of 2021 to play out into the Autumn months, with that decline coming from the combination of 180 and 360-day time cycles.
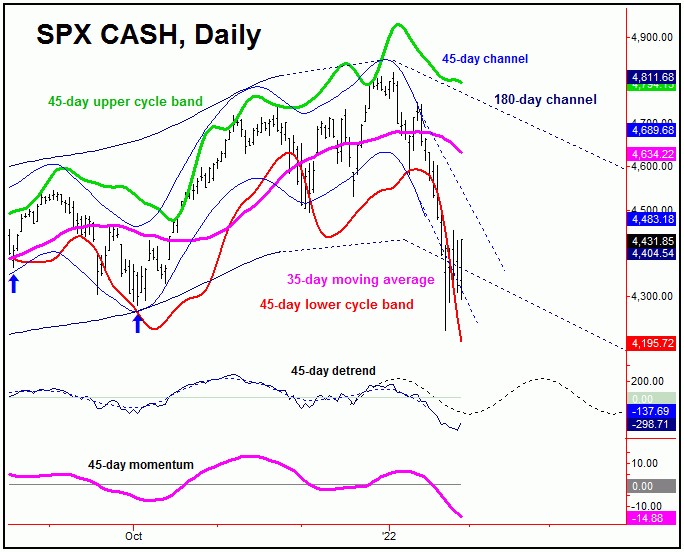
The smaller 180-day component is shown on the chart below:
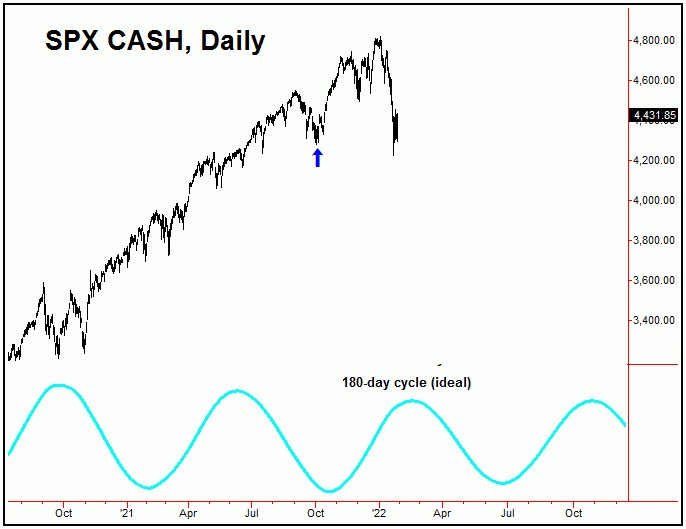
In terms of time, our ideal path favored higher highs into January of this year, giving way to a correction into March - before turning back to make higher highs with this 180-day cycle into late-Spring.
Having said that, our downside 'reversal point' for this 180-day cycle was noted as the 4495.12 SPX CASH figure, which was taken out on January 20th. That action confirmed the downward phase of this 180-day wave to be back in force, which also confirmed a left-translated peak for this cycle, made back in early-January.
Going further with the above, the break below the 4495.12 SPX CASH figure put the 200-day moving average as the near-automatic price magnet, with that moving average easily hit with the action that followed. With that, the next mid-term trough for U.S. stocks should come from this 180-day cycle component.
Having said the above, in terms of time, the next trough for the 180-day wave is actually not due until the June - July timeframe. With that, either we are going to see an earlier-than-expected low for this wave, or else we will see a series of countertrend rallies (with the smaller-degree cycles) in the coming months.
In looking at technical action, supporting the idea of an earlier bottom with the 180-day cycle would be the fact that our 180-day 'oversold' indicator spiked above its upper reference line at the January 21st close of 4397.94 SPX CASH. You can see this on the following chart:
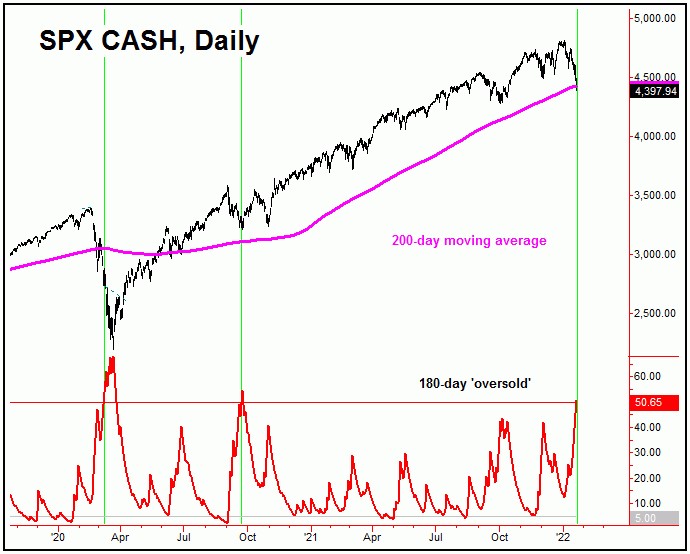
A spike above the upper reference line with our 180-day 'oversold' indicator is something seen closer to bottoms for this 180-day wave. For example, the last occurrence of this pattern was seen the very day of the September, 24 2020 price low - which was also a trough for this 180-day cycle.
Having said the above, the 180-day oversold indicator also spiked above its upper line back on March 10, 2020 - which was only about two-thirds of the way into (though only about 9 trading days from) the March 23rd, 2020 major low.
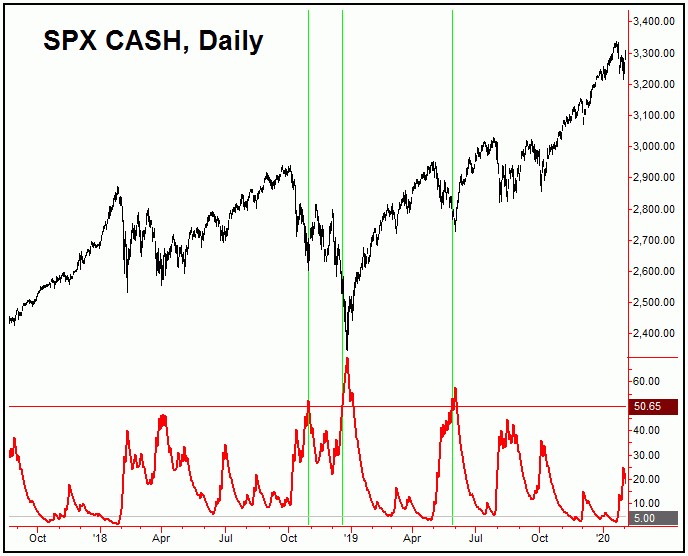
Going further with the above, the above chart shows the same indicator going back to the 2018-2020 timeframe. With that, you can see a spike above the upper reference line back in late-May of 2019, just prior to the key low registered on June 3rd of that year. Prior to that, another spike above the same was seen in mid-December, 2018, which was not too much removed from the late-December trough.
Going even further back, the prior spike up occurred on October 29, 2018, which was the exact day of a low there - but which ended up as only a bottom for the 45-day cycle. What followed was a sharp rally into November, before turning back to make lower lows into December, before actually bottoming the larger 180-day component.
Though I don't have the time to go over each instance of the pattern over the past decade or so, I can tell you that the pattern was normally seen near 180-day troughs, about 80% of the time. The other 20% of the time, it occurred only near smaller-degree lows - such as with the 45-day cycle, which is shown on our next chart:
With the above said and noted, there is some inference that we could be seeing an earlier 180-day cycle low that is trying to form. However, with this particular cycle not actually due to trough until June or later, this is highly-speculative for now.
However, even if this 180-day wave is not bottoming at the present time, the probabilities do strongly favor that the smaller 45-day cycle is in fact bottoming out, with this component ideally looking for a sharp rally into early-to-mid February.
In terms of price, following my rule that a cycle has a strong tendency to revert back to a moving average of the same length - with this cycle currently averaging 35 trading days - that rally is expected to see the 35-day moving average acting as the magnet. From there, we will need to reassess the technical configuration of the market, in regards to the bigger 180-day component. More on all as we continue to move forward.
Jim Curry
The Gold Wave Trader
http://goldwavetrader.com/
http://cyclewave.homestead.com/
********
More from Gold-Eagle


