Forecast: Gold's Countertrend Correction Phase


 As mentioned in my last article back in mid-November, a mid-term upward phase was deemed to be in force for Gold, with the ideal path looking higher into the Spring of next year. Having said that, there will be the normal correction phases in-between, the second of which we are now in.
Gold's 72-day Cycle
As mentioned above, a mid-term had formed back in early-October for Gold, with the bigger picture seen as pushing higher into next Spring. Going further, the overall path favored higher highs to follow the mid-November correction, which we did see.
From my 11/20/23 article: "additional strength is favored into early-December or beyond. In terms of price, a push back above the 2019.70 swing top would be ideal into that timeframe. Going further, I should add that any push above the 2019.70 swing high in the coming days/weeks - if seen - would also favor a short-term breakout to the upside. Though we don't know how far a breakout could carry, it is reasonable to expect a rally of 6% or more off the 34-day low, which is a low-end rally with this wave."
As mentioned above, the ideal path favored the correction into mid-November to end up as a countertrend affair, before giving way to a push back to higher highs into December. Going further, taking out the late-October high was seen as a short-term breakout to the upside, thus favoring additional strength through the same - before topping our 72-day cycle component, which is shown on the chart below:
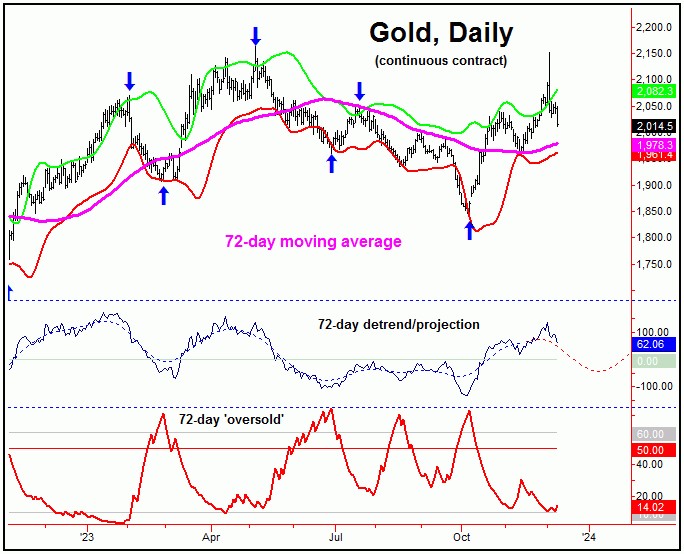
Adding to the earlier notes, higher highs into early-December for Gold were eventually expected to peak this 72-day cycle, which is now favored to have topped with the 12/4/23 spike up to the 2152.30 figure (February, 2024 contract).
With the above, Gold is now deemed to be in a correction with our 72-day wave, which could last into the late-December to mid-January region, where our detrend is projecting its next trough to form. In terms of price, the downside risk (and a potential magnet) is back to the lower 72-day cycle band, currently around the 1961 figure - but is rising slightly.
What we will want to watch for is the red line on the above chart (lowest pane), which is our 72-day 'oversold' indicator. That is, at 72-day cycle bottoms, this indicator has a good tendency to spike above its upper reference line. (Note: this indicator is similar to the VIX for the U.S. stock market, in that it moves inverse to price action).
As per the title of this article, due to the position of the larger 310-day cycle, our ideal path is looking for a countertrend correction with our 72-day wave - one that remains above the early-October bottom.
Here again is our 310-day cycle component:
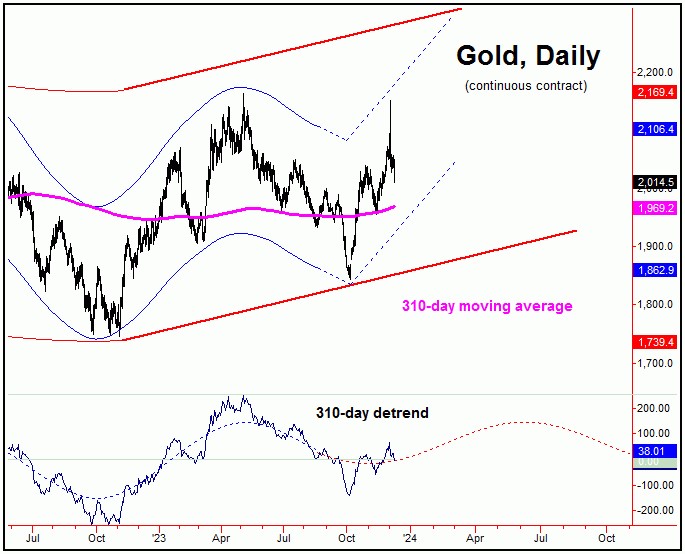
In terms of price, a price analysis of this 310-day cycle suggests the potential for an eventual move up to the 2200's or better for Gold, ideally playing out into the late-Spring, 2024 timeframe. As a side note, at the October 30th close, we confirmed an initial upside target with this wave to the 2112-2181 region (December, 2023 contract), which was met with the recent spike higher.
With the above said and noted, until proven otherwise, our 310-day cycle is seen as pushing higher into next Spring, though with a countertrend correction currently in force with the smaller 72-day component. Once this correction is complete (late-December into mid-January), we should expect a push back to or above the highs on the next swing up with that 72-day wave.

Lastly, we want to take a look at our Gold Timing Index, shown on the chart below:
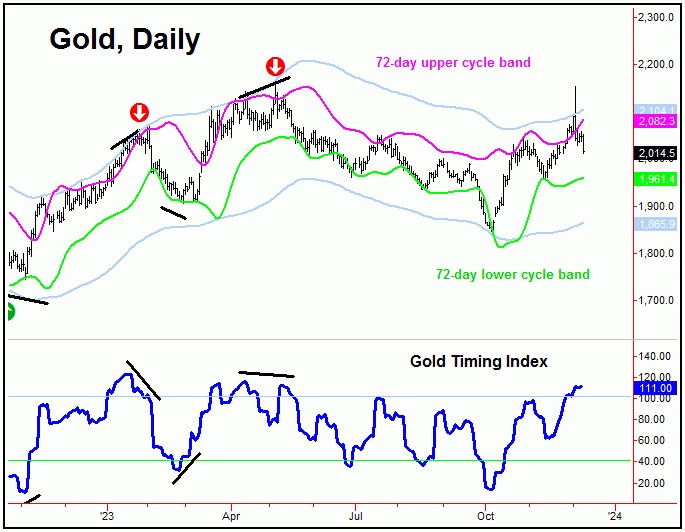
Our Gold Timing Index is a combination momentum/sentiment indicator, and offers up additional information - particularly when it diverges from price action. Going further, price tends to form peaks when the indicator moves into the 100-120 region, and bottoms when it drops below the 40 figure - as it did back in October.
With the above, it will be interesting to see if our Gold Timing Index should drop down to the lower 40 'buy' line in the coming weeks. Should this also be accompanied by a spike higher in our 72-day cycle 'oversold' indicator (mentioned earlier), this would be a strong signal that the next key low is forming for the metal, with precise updates always noted in our thrice-weekly Gold Wave Trader report.
Jim Curry
The Gold Wave Trader
http://goldwavetrader.com/
http://cyclewave.homestead.com/
********
More from Gold-Eagle


