Forecast: Gold's Extended Downward Phase


 Recapping Last week
Gold saw its high for last week made in Wednesday's session, with the metal spiking up to a post-CPI peak of 1744.30. From there, however, a drop back to lower lows for the swing was seen into later in the week, here hitting a Thursday bottom of 1695.00 - before bouncing off the same into Friday's session.
Gold's Short-Term Picture
For the very near-term, the recent downward phase for Gold continues to work on an extended low, which should come from the combination of 10, 20 and 34-day cycles. The middle 20-day component is shown on the chart below:
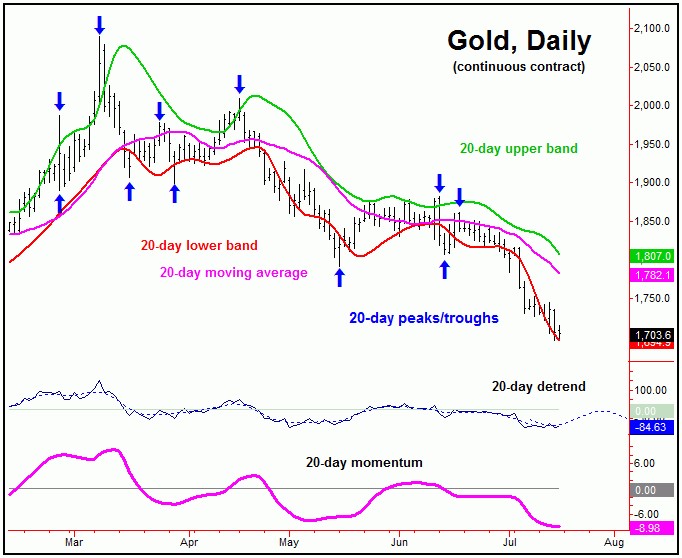
With the recent price action, our upside reversal point for the combination of 10, 20 and 34-day cycles moves to the 1745.80 figure (August, 2022 contract), where it could continue to drop as we move along. Basically, any reversal back above that figure - if seen at any point going forward - would be our best indication of a turn higher with the these smaller-degree waves.
Going further with the above, taking out the 1745.80 figure would favor additional strength into what could be late-July to early-August timeframe. That rally would be favored to see the 20 and 34-day moving averages acting as the price magnets, with the latter due to the position of the 34-day component, which is also shown:
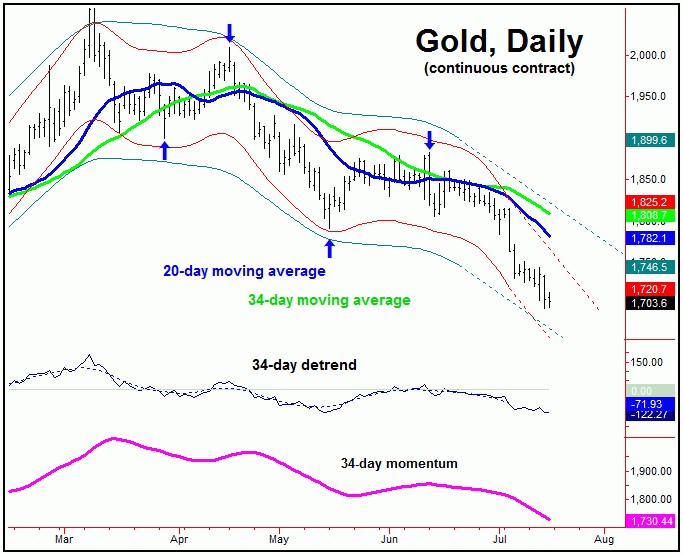
Otherwise, holding below the 1745.80 figure will keep the metal in a bearish position short-term, still with the potential for lower lows for the extended downward phase.
Due to the position of the larger 72 and 310-day cycles, the probabilities will favor the next short-term rally phase with the 10, 20 and 34-day waves to end up as a countertrend affair - holding well below the 1882.50 swing top. If correct, a late-July to early-August peak would have resistance around the aforementioned 34-day moving average, which is also at or near the declining 72-day cycle channel.
Gold's 3-8 Week View
Stepping back further, as noted in more recent articles, the downward phase of the larger 72-day cycle is also deemed to be in force, with its next trough projected to form around mid-August or later. Here again is our 72-day component:
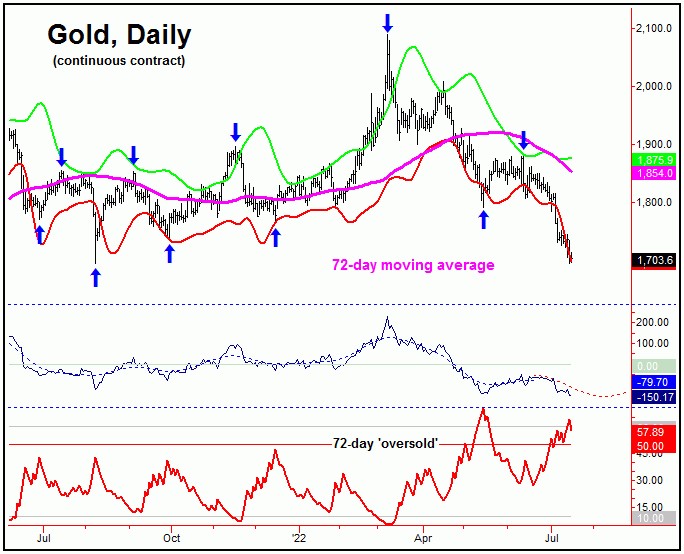
Of key note is that our 72-day 'oversold' indicator (which moves inverse to price action) is already above its upper reference line - along with price currently below our lower 72-day cycle channel. The combination of these are normally seen near price lows for this wave, though this is actually more key when the cycle itself is into normal bottoming range. This won't be the case until at least early-to-mid August.
With the above said and noted, a short-term rally with the smaller-degree (10, 20 and 34-day) waves - one that gives way to lower lows into mid-August or later - would then be favored to bottom this 72-day cycle. From that low, we would expect to see another try at the 72-day moving average or better into what looks to be the early-to-mid September region - a move which would also be favored to end up as countertrend, due to the position of the larger 310-day component:
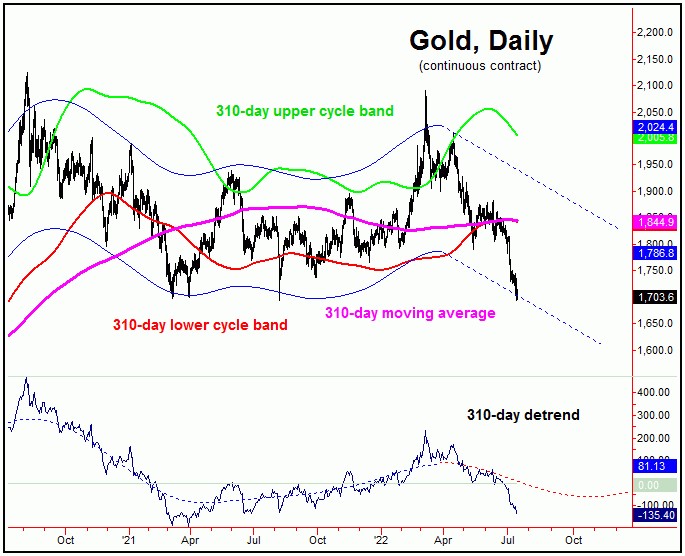
In terms of price, the next upward phase of the 72-day cycle should see resistance somewhere around the 72-day moving average, the upper 72-day cycle band - and the 310-day moving average. If correct, a countertrend peak with the 72-day wave into early-to-mid September would be expected to give way to a final drop to lower lows into October, before the next mid-term trough forms with our larger 310-day wave.
In terms of price, unless hit beforehand, there is the potential for a drop to the 1650's or lower as this larger 310-day cycle bottoms out in the coming months. Once that low is complete, a sharp rally of some 20-25% or more will be expected to play out in the months to follow, as the next upward phase of this 310-day wave assumes control of the Gold market. More on all as we continue to move forward.
Jim Curry
The Gold Wave Trader
http://goldwavetrader.com/
http://cyclewave.homestead.com/
********
More from Gold-Eagle


