Forecast: Gold's Natural Magnet & Potential Upside


 Recapping Last week
Following a consolidation into early-week, Gold saw its low registered in Thursday's session, here doing so with the spike down to the 1678.40 figure. From there, a sharp reversal to the upside was seen to end the week, with the metal hitting a Friday peak of 1738.30 - before backing slightly off the same into the weekly close.
Gold Market, Short-Term
From the comments made in recent articles, Gold was looking for a key low to form, with that low coming from the combination of 10, 20 and 34-day cycles. The chart below shows the larger 34-day cycle:
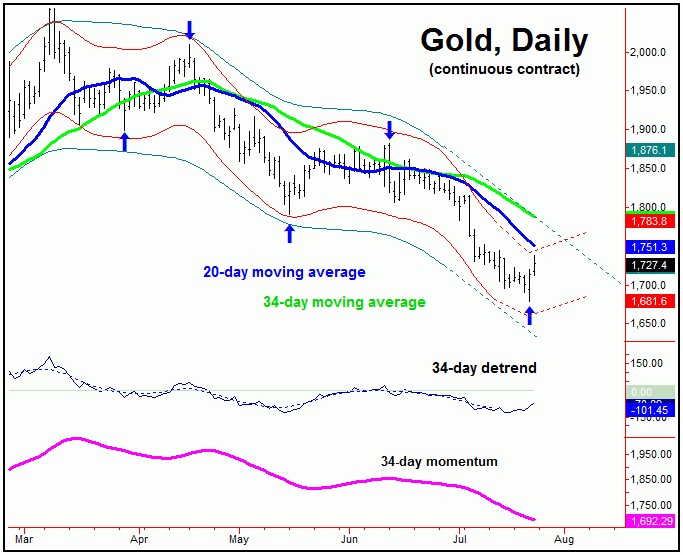
With the action seen into Thursday/Friday, the probabilities now tend to favor this short-term combination low to be set in place. Going further, that action suggests the potential for a sharp rally in the coming weeks, with the 34-day moving average or better acting as the ideal magnet.
Until proven otherwise, the overall assumption is that the current short-term rally phase will end up as a countertrend affair, with resistance around the 34-day moving average - which is also at or near our upper (and declining) 72-day cycle channel. Here again is our larger 72-day cycle:
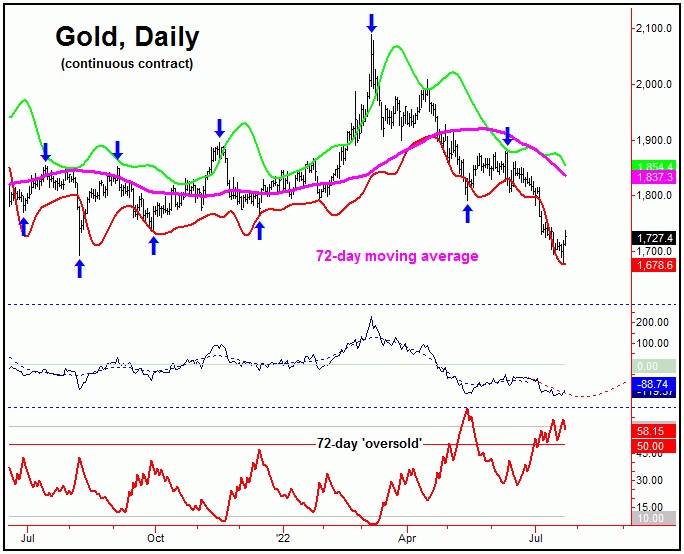
In terms of time, the ideal path for the current short-term rally to play out into the early-August period. If the move does end up as countertrend, then a drop back to or below the lows can be seen into mid-August or later, before bottoming this larger 72-day component.
Having said the above, there is one alternate that I am considering - and a strong case can actually be made for the same. That is, the most recent low was not only a bottom for the 10, 20 and 34-day cycles, but will also end up as a contracted trough for our larger 72-day wave. I do see this as having at least some validity, simply due to the fact that the smaller 34-day wave was recently into extended territory.
If the above alternate were to end up as correct, then the current rally would have the potential to rise as high as the 72-day moving average, and/or the upper 72-day cycle band - each of which are well over 100 points above current price levels. In other words, there is the potential for a huge amount of upside for Gold, at least for the short-term picture.
Gold's Stepped-Back View
For the mid-term picture, the overall assumption is that the next rally phase of the 72-day cycle - if and when seen - will end up as a countertrend affair, giving way to lower lows into mid-to-late October of this year. This is due to the current position of the larger 310-day cycle, shown again on the chart below:
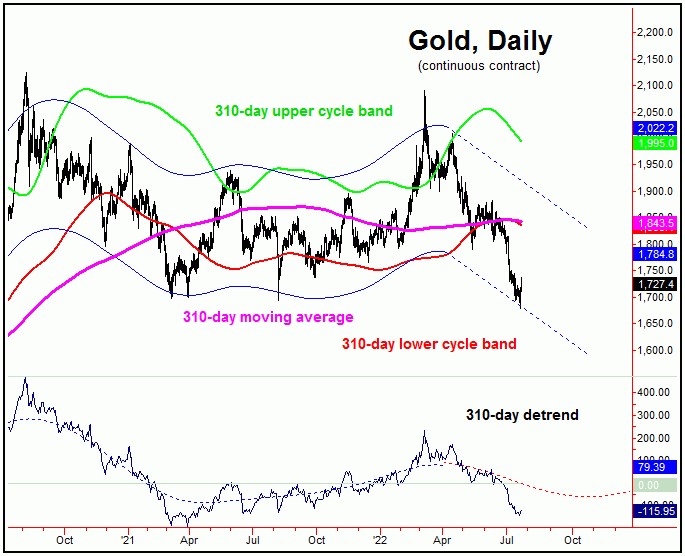
In terms of time, as mentioned above, the downward phase of this larger 310-day wave is projected lower into what looks to be the mid-October timeframe of this year, or later. If this is correct, then we will see any rally with the 72-day wave finding resistance at or near the upper 72-day cycle band indicator, giving way to lower lows into October. In terms of price, there is the potential for a drop to the 1650's as this larger 310-day cycle bottoms out.
For the bigger picture, the next mid-term low should come from this same 310-day cycle. From whatever bottom that does form with the same, Gold should see a very sharp rally of some 20-25% or more in the months to follow, as the next upward phase of this wave assumes control. More on this as we continue to move forward.
Jim Curry
The Gold Wave Trader
http://goldwavetrader.com/
http://cyclewave.homestead.com/
********


