Forecast: Gold's Rally Isn't Over But Caution Advised


 Recap of Last Week
Last week's action was choppy into mid-week, with the metal forming its high for the week in Wednesday's session, here doing so with the tag of the 1812.70 figure. From there, a sharp decline was seen into early-day Friday, with the metal dropping all the way down to a low of 1772.40 - before bouncing off the same into the weekly close.
Gold's Short-Term Picture
For the very short-term, the action continues to be on the choppy side, with the 10/22/21 swing top of 1815.50 being seen as the last peak for the 10-day cycle, which is shown on the chart below:
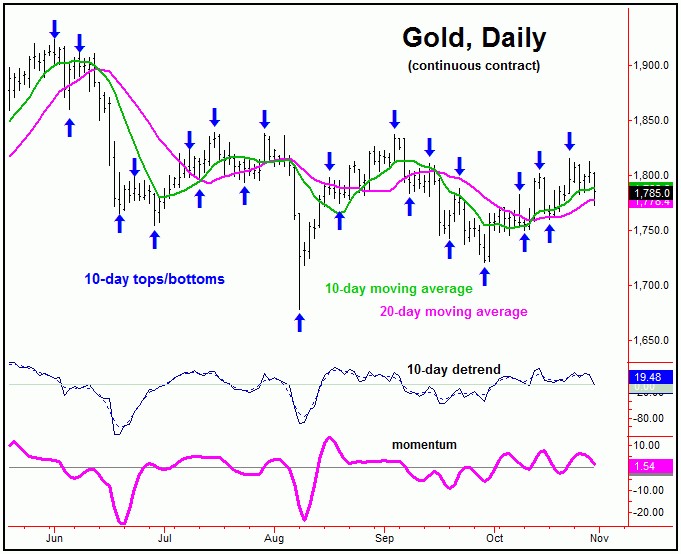
In terms of price with the above, the recent decline back to the 10-day moving average is seen as being all or part of the downward phase of this 10-day wave, which will remain intact only as long as the 1815.50 figure (December, 2021 contract) is not taken out to the upside.
If that 1815.80 figure should be taken out higher in the days ahead, then it would confirm the next upward phase of this 10-day wave to be back in force. In turn, that action would favor additional strength through the same - potentially on up to test the 1836.90 swing top - which has been expected to be tested on the current upward phase of the larger 72-day cycle, shown again below:

In terms of time, as mentioned in previous articles, the combination of the 72 and 154-day cycles had recently confirmed a turn back to the upside - with that action favoring additional strength into what looks to be the mid-to-late November timeframe. At that point, this smaller 72-day cycle will be looking for yet another top, and would be expected to give way to another multi-week decline into later this year.
Gold's Stepped-Back View
Going further with the above, until proven otherwise, the correction phase of the 72-day cycle (i.e., later this year) is favored to end up as a countertrend affair - ideally holding above the prior 72-day trough of 1721.10. If correct, then another decent rally phase would be expected to play out into around February of next year, before topping the larger 154-day wave, which is shown again on the chart below:
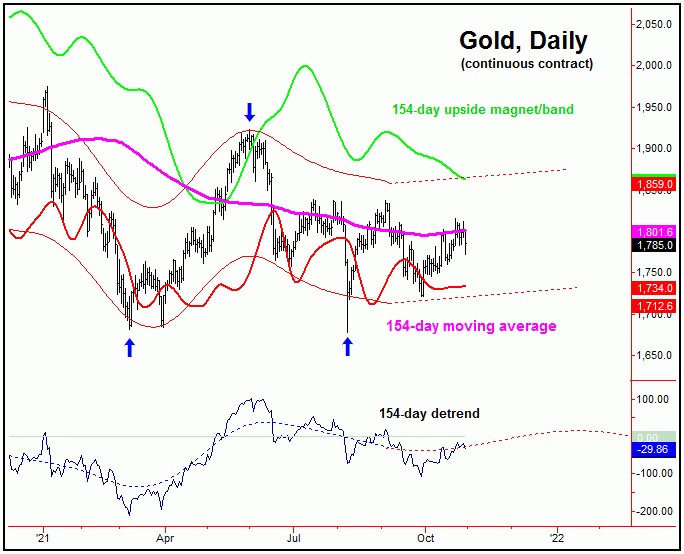
In terms of price, we see the potential for an eventual tag of the upper 154-day cycle band (in bright green) going forward, simply due to the fact that upward phases of this 154-day wave will normally see a rally back to the same - before the cycle tops.
In terms of time, the best odds for a tag of the upper 154-day band to be hit would either be before the 72-day cycle peak into mid-to-late November (favored), or else into January or February of next year - following an in-between correction with that same 72-day component.
For the bigger picture, however, the current upward phase of the larger 154-day cycle seems favored to end up as a countertrend affair - holding below the prior 154-day top of 1923.40, seen back in June of this year. If this assessment is correct, then a peak with this wave into early next year is likely to give way to another decent decline into late-Spring, where the next larger-degree trough is projected to form, coming from the combination of 154 and 310-day cycles.
The Bottom Line
The overall bottom line is that the near-term action is likely to be a continued choppy affair, though the overall rally phase of the 72-day cycle looks incomplete. If correct, then the ideal path is looking for another try at strength in the coming weeks, before topping this wave for another correction into late-year. That move is favored to end up as countertrend, giving way to another try at strength into early next year - before setting up a more significant peak with the larger 154-day wave. Stay tuned.
Jim Curry
The Gold Wave Trader
http://goldwavetrader.com/
http://cyclewave.homestead.com/
*********
More from Gold-Eagle


