Forecast: Key Gold Inflection Point Coming Due


 Recapping Last week
Following early-week strength, Gold formed its low for last week in Wednesday's session, here doing so with the spike down to the 1770.00 figure. From there, a firm push higher was seen into Thursday, with the metal running up to a peak of 1812.00 - before backing off the same to end the week.
Gold Market, Short-Term
From the comments made in past articles, Gold was seen as forming a key price low - which came from the combination of 10, 20 and 34-day cycles. That low was later confirmed to be set in place in our Gold Wave Trader report, and with that called for a significant short-term rally. Shown below again is our 34-day cycle component:
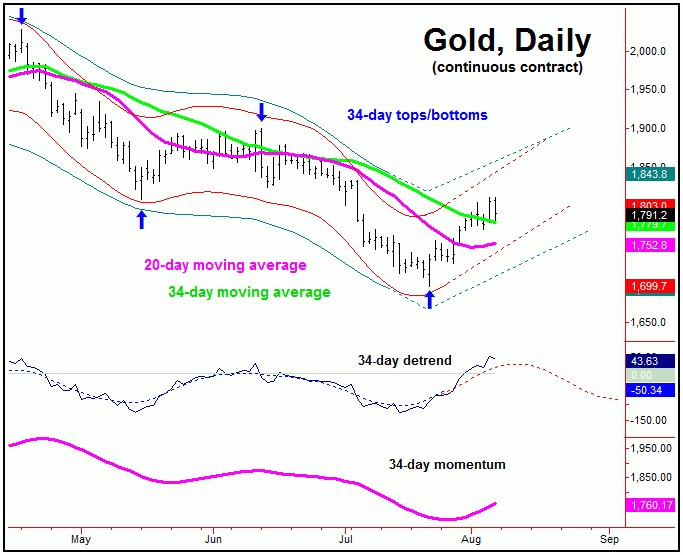
From my 7/10/22 article: "Once the next 10, 20 and 34-day combination low is in place, then the probabilities should favor a very nice rally in the days/weeks to follow. In terms of price, Gold has a very strong tendency (i.e., 85% odds) to revert back to a moving averages which is in line with the cycle length(s). With that, the upside potential for the next rally is back to the 20 and 34-day moving averages - with highest (34-day) average nearly 85-90 points above current price levels."
As mentioned in prior articles, with a cycle having the strong tendency to revert back to a moving average of the same length, the upside potential for Gold was back to the 34-day moving average - which has now been met with the action into last week. In terms of price, Gold has rallied some 116 points from the July low (1696) to last week's high of 1812.00 - which is right in line with the noted potential upside.
I mentioned that - if the move higher were going to end up as an immediate failure - then it would likely do so at or near the same 34-day moving average. Having said that, I also pointed out the alternate path - which was later moved to the preferred scenario - which had the July low also ending up as a contracted trough for our larger 72-day cycle, which is shown on our next chart:
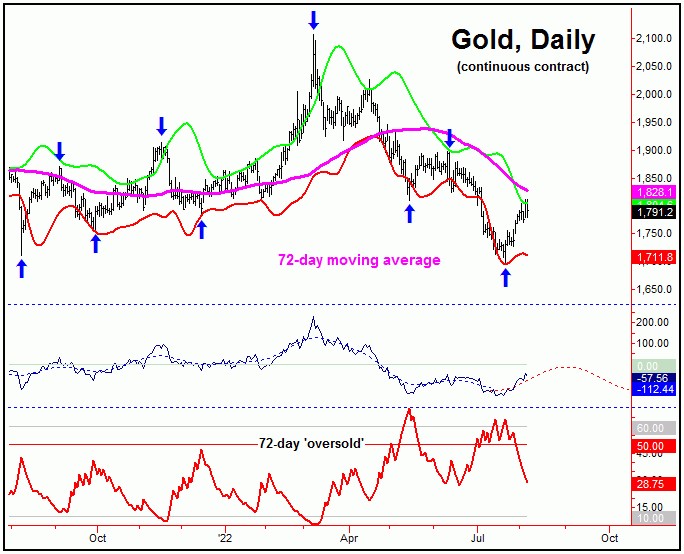
In terms of price with the above, the 72-day moving average was mentioned as the ideal upside magnet - which is around 36 points above current price levels. With that, the overall assumption is that Friday's pullback will end up as countertrend, giving way to strength again - and higher highs for the move - on the next minor swing up, ideally lasting into mid-month or later.
Gold's Stepped-Back View
Stepping back slightly, higher highs for the swing should peak, at minimum, the aforementioned 34-day cycle. However, there is the potential the move could also top the larger 72-day wave, since we expect a left-translated 72-day cycle upward phase - due to the position of the larger 310-day component, shown below:
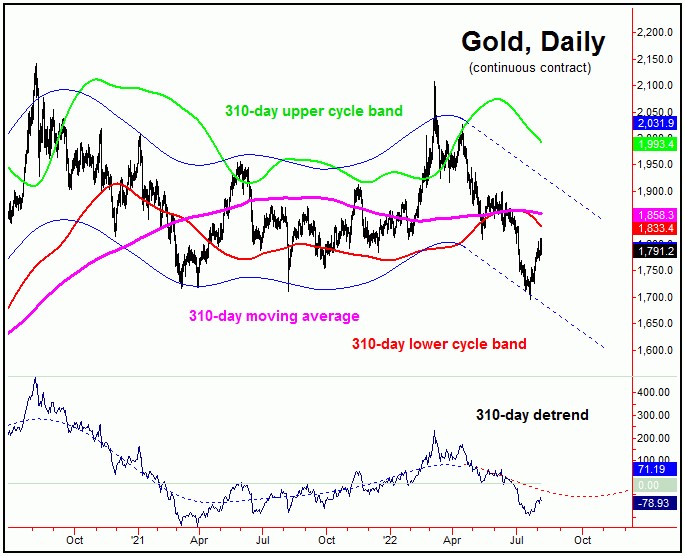
Stepping back further, the next trough for the 72-day cycle should be primed to bottom the larger 310-day component, which is seen as pointing lower into October - against the upward phasing of the smaller-degree waves.
With that, the assumption is that the current upward phase of the 72-day cycle will end up as countertrend, giving way to a drop back lower lows for the larger swing into October. The next trough for this 72-day cycle - if made on schedule - is also due to form around mid-October of this year.
For the bigger picture then, the next major low is expected to come from the 72 and 310-day cycles (as well as an in-between 154-day wave), and is due around October of this year, plus or minus. Once this bottom does form, what follows is expected to be a rally of some 20-25% or more, lasting into well into what looks to be late-Spring of next year. The overall lack of interest from Gold traders tends to add weight to the idea of a major rally coming, once the next mid-term upward phase does assume control. More on all as we continue to move forward.
Jim Curry
The Gold Wave Trader
http://goldwavetrader.com/
http://cyclewave.homestead.com/
*******


