Friday’s Falling Markets Suggest Trend Acceleration As Gaps Get Filled


My research team and I have identified a series of Gaps and Gap Fills that may become very telling for the markets over the next 30 to 60+ days. We have highlighted some Gaps in previous markets over the past 12+ months in some of our other research articles, but we believe the current Gap setups in the SPY, Dow Jones, and Transportation Index suggests extreme volatility should be expected from the markets over the next 60+ days.
First, let’s discuss what creates a gap in price and why it is important for Technical Analysis. A Gap in price occurs when some major price event takes place between bars – causing a complete price void to take place (a Gap) in price. Typically, this type of price activity is common as volatility expands and/or as price becomes very illiquid in trading. Generally, Gaps do not occur often in trading as liquidity and price exploration normally provide enough depth to allow price to operate without Gaps.
Large bar Gaps are something we need to pay very close attention to as Technical Traders. These types of price Gaps happen because of extreme fear or greed with heavy volume while trading. They are completely different than low volume, low volatility price gaps that are a result of very illiquid market price activity.
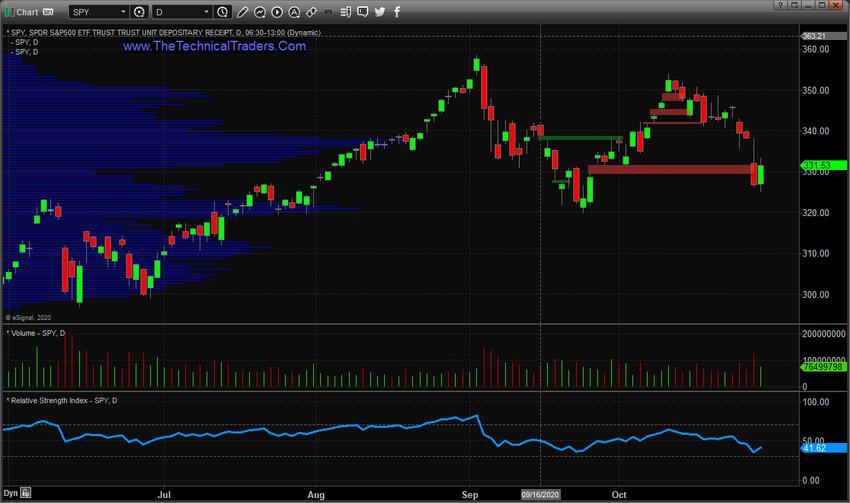
SPY GAP ACTIVITY
We can see a number of Gaps fill to the downside on the SPY Daily chart below. We have highlighted the Upside Gaps with RED Rectangles and the Downside Gaps with GREEN Rectangles. What I have found interesting is that the recent rotation in the SPY price over the past 60+ days has filled almost all of the recent Gaps in price and has recently closed a big Upside price Gap that originated near the end of September. If the trend continues lower, downside trending may continue to seek out lower gaps from these levels.
INDU GAP ACTIVITY
The INDU (Dow Jones Industrial Average) Daily chart below highlights the same type of Upside and Downside price Gaps. You can see how nearly all of the recent Upside price Gaps have been filled by the current downside price move. Yet, a new Downside price Gap was created by the big breakdown in price on October 28, 2020. This massive Downside price Gap suggests downward trending was severe as fear drove a huge price void overnight. Yet it also suggests that, at some point in the future, price will attempt to recover to “fill this gap”.
What is also interesting is that we can see an original gap (RED Upside Price Gap) was also skipped by the October 28, 2020 price gap. This creates a “Double Gap” setup on this chart which indicates a potential for a very strong downside price trend at the current moment and suggests that these Gaps will be filled by upside price activity at some point in the future. As long as these gaps stay Open, they represent a very key price level for future price activity and suggest this “Price Void” is a key price trend level.
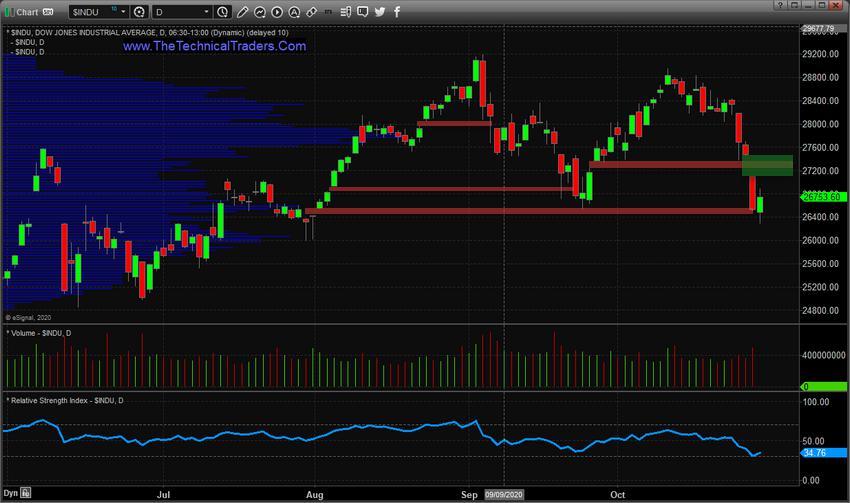
Additionally, pay attention to how the INDU Daily chart was able to establish a new lower low price level recently compared to the previous low price trough. When we take into consideration the failure of the recent price peak to break the previous price peak high, this suggests a bearish price trend may be tart to initiate based on simple Fibonacci Price Theory.
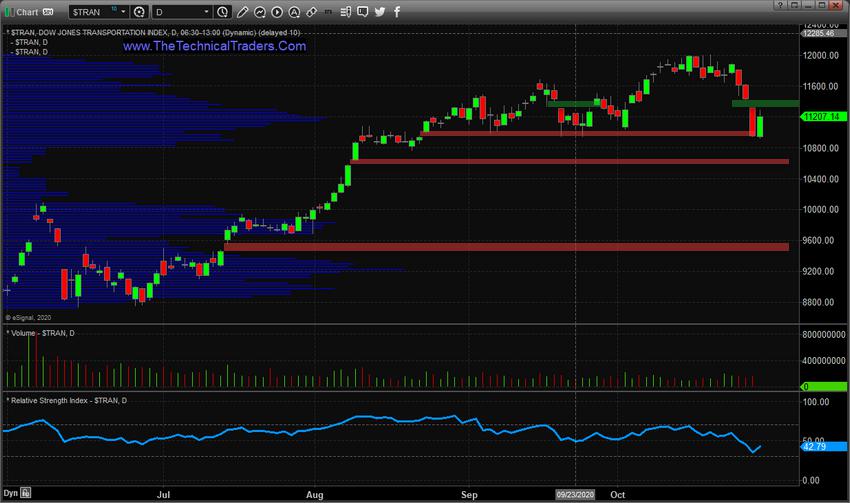
TRANSPORTATION INDEX GAP ACTIVITY
The following Daily Transportation Index also shows the same October 28, 2020 price Gap as the INDU chart. My research team believes the uniformity of these Gaps suggests that price trending has entered a new phase as we head into the November Elections. The TRAN chart highlights really only one Downside price Gap, which is a critical level on the chart for traders. The 11,420 level will likely become critical resistance at some point in the near future.
Also, pay attention to how the Transportation Index setup a new lower low price recently. Although it may be difficult to see on this chart, the new lower low price confirms an attempted downside price trend is setting up and confirmed simple Fibonacci Price Theory that suggests the markets may be poised for big trends soon.
We have highlighted the 26,000 level on the Dow Jones as critical support. It is important that this level continues to act as a floor for price. This would translate to a level of 315 for the SPY and 10,650 for the TRAN.
Any future price breakdown below these levels would indicate the markets have broken key support levels and are attempting to head lower. Currently, though, the market price levels are still above these key levels. This suggests the recent price Gaps will likely be filled as price attempts to find a bottom and resume an upward price trend after the elections.
One thing is certain, this extended volatility and price rotation presents some real opportunities for skilled traders as long as one properly addresses risk and volatility concerns. To learn how we are tackling these price trends, visit www.TheTechnicalTraders.com to sign up for your daily pre-market report, walking you through the charts of the major asset classes.
Chris Vermeulen
Chief Market Strategist
www.TheTechnicalTraders.com
NOTICE AND DISCLAIMER: Our free research does not constitute a trade recommendation or solicitation for our readers to take any action regarding this research. It is provided for educational purposes only – read our FULL DISCLAIMER here.
********

Chris Vermeulen has been involved in the markets since 1997 and is the founder of Technical Traders Ltd. He is an internationally recognized technical analyst, trader, and is the author of the book: 7 Steps to Win With Logic
Through years of research, trading and helping individual traders around the world. He learned that many traders have great trading ideas, but they lack one thing, they struggle to execute trades in a systematic way for consistent results. Chris helps educate traders with a three-hour video course that can change your trading results for the better.
His mission is to help his clients boost their trading performance while reducing market exposure and portfolio volatility.
He is a regular speaker on HoweStreet.com, and the FinancialSurvivorNetwork radio shows. Chris was also featured on the cover of AmalgaTrader Magazine, and contributes articles to several financial hubs like MoneyShow.com.


