Global Stock Markets Are Due For A Tumble


 Surely all 12 charts shown below are Bearish Barometers for stocks worldwide…and will NOT go unnoticed by institutional investors (like large mutual funds, pension programs and bank trust departments). Only the ignorant and gullible hoi polloi will suffer loss. To ignore all the compelling charts and data below is irresponsible…and will surely cause one severe financial loss. BEWARE: Investor complacency in the past nearly always led to a stock market crash.
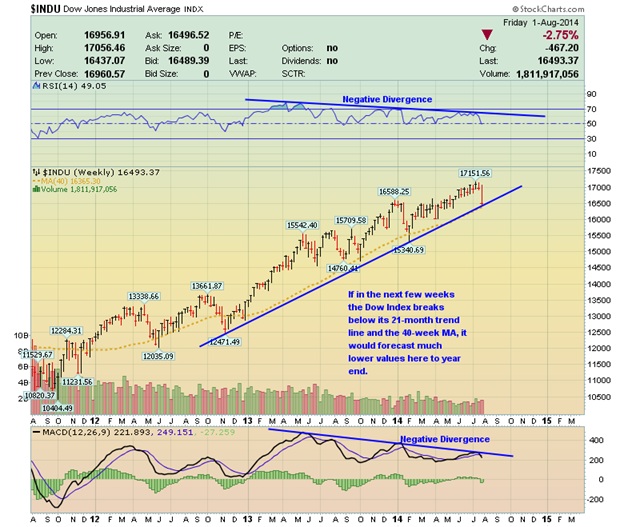
Dow Stock Index threatens to fall below its 21-month uptrend and its 40-week MA, which probably drive stocks downward.
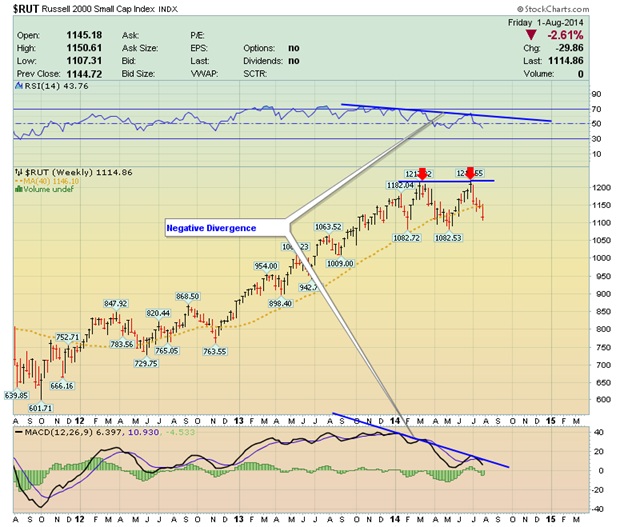
Russell 2000 Stock Index shows a very bearish double top and threatens to fall below its 21-month uptrend. Moreover, the technical indicators demonstrate very negative divergence (heralding lower values ahead). It is imperative to notice the Russell 2000 Index has already fallen below its 40-week MA…indeed a very ominous omen predicting much lower prices ahead.
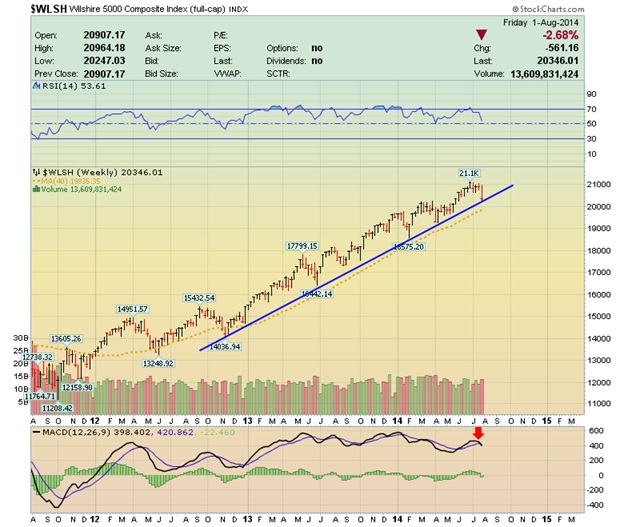
Wilshire 5000 Stock Index also threatens to fall below its 21-month uptrend. Moreover, the technical indicators MACD and RSI are heralding lower values ahead.
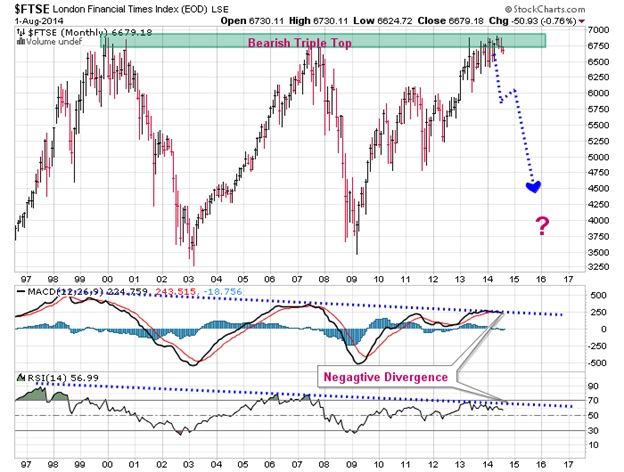
UK’s FTSE Stock Index has bear signs clawing all over its chart: Firstly, there is a bearish triple top, and; Secondly, there is marked negative divergence of the technical indicators.
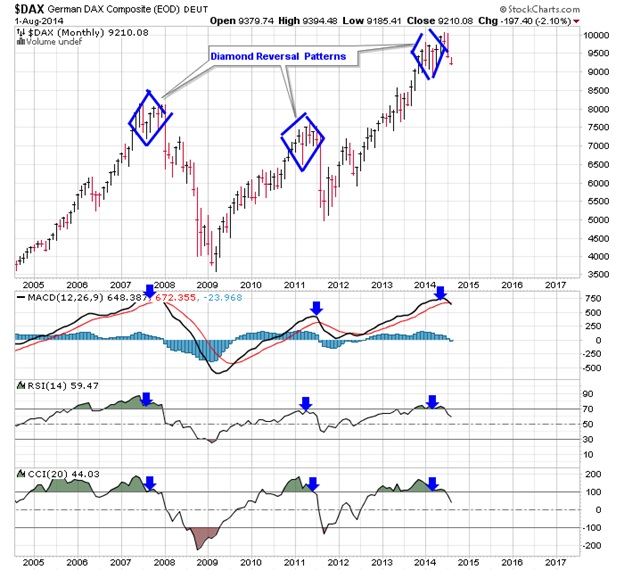
Germany’s DAX Stock Index is replete with bearish sell signals, including a diamond reversal formation (2007, 2011 and most recently). Moreover, TA indicators of MACD, RSI and CCI are all screaming sell, Sell, SELL.
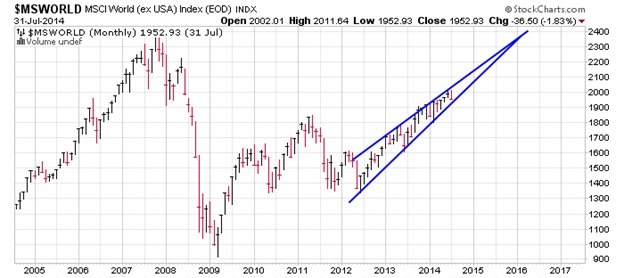
MSCI World Stock Index (sans USA) clearly shows a bearish tising wedge. And if the MSCI breaks below the rising wedge, the World Stock Index might plummet to 1400 support.
********
Other Compelling Sell Signals:
"The 'Recovery' Is A Mirage" Mark Spitznagel Warns, "With As Much Monetary Distortion As In 1929"
"Today there is a tremendous amount of monetary distortion, on par with the 1929 stock market and certainly the peak of 2007, and many others," warns Universa's Mark Spitznagel.
Spitznagel offers the following chart in support of his bearish prediction. Specifically, it is the ratio of corporate equities divided by net worth.
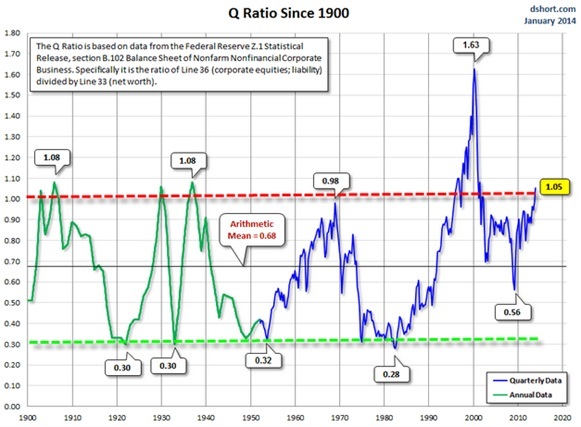
It is imperative to appreciate the accuracy of the above curve in signaling the beginning of bear markets in stocks:
- In 1907 it peaked at 1.08, which was followed by the Panic Crash of 1907 (where Dow fell nearly 50%)
- In 1929 it peaked at 1.06, which was followed by the Great Crash of 1929 (where the Dow Index eventually lost 89%).
- In 1937 it peaked at 1.08, which was followed by the Panic Crash of 1937 (where the Dow Index lost 49% in only 12 months).
- In early 1970 it peaked at 0.98, which heralded the 1972-1973 Crash (where the Dow lost 38%)
- In 2000 it peaked at 1.63, which was followed by the Crash of 2000-2003 (where the Dow dropped 45%).
- And today the ratio is peaking at 1.05.
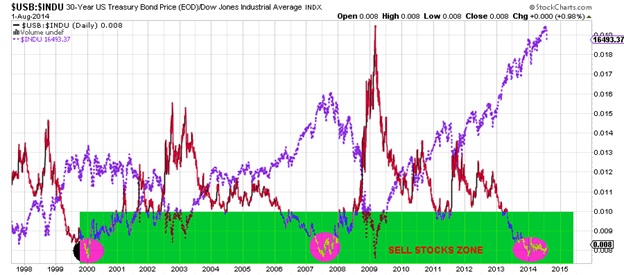
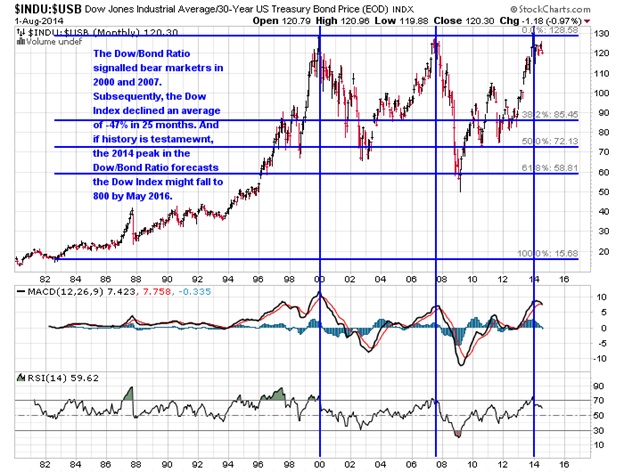
US T-Bonds/Dow Ratio
Another financial “barometric” chart indicating a bear market in stocks is forming. This is the tell-tale trend of US T-Bonds/Dow Ratio. The logic behind this indicator is the following. When a bull market in stocks becomes euphoric, investors blindly and irrationally pile into stocks, and tend to reduce their investments in US Treasuries. Hence the US T-Bonds/Dow Ratio trends lower and lower. However, when irrational investors become too greedy, stocks are bid to delusional, unsustainable levels. This is exactly what happened in 2000 and 2007, which caused the US T-Bonds/Dow Ratio to fall to the bottom of the chart (see pink circle marking the bottoms). Needless to say, both periods pin-pointed when the Dow Index topped out.
FAST-FORWARD to 2014 to see the US T-Bonds/Dow Ratio has again bottomed, thus announcing stocks are topping out – and preparing to correct. Please note the Dow Index is super-imposed on the graph.
------------------------------------
Perhaps another more clear way to visually appreciate that stocks are topping out is to view a chart of the Dow/US T-Bond Ratio. Please see a very bearish triple top:
-----------------------------------
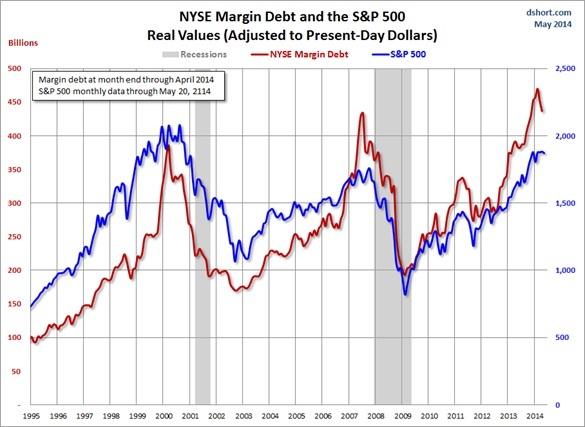
NYSE Margin Debt At An All-Time Record High
Another infallible indicator showing stocks are grossly over-valued and may be approaching a market dangerously topping out is NYSE Margin Debt. Actually the NYSE Margin Debt is one of the principal causes why stock ultimately must face egregious correction.
Observe how the NYSE Margin Debt peaked in 2000 and 2007, when the S&P500 peaked and subsequently suffered horrific losses (-53% and -54%). The theory behind this phenomenon is simple. After stocks have risen for years on end, investors throw caution to the wind and buy stocks on ever increasing margins. Eventually and inevitably all liquidity dries up, and there is practically no new money available to bid prices higher…ERGO, SMART INVESTORS BEGIN TO TAKE PROFITS…and the market prices reverse sharply downward. Eventually and inevitably the bear market feeds on itself as imprudent investors dump stocks and flee to safe havens (ie cash, bonds and or gold).
Here is the NYSE Margin Debt At An All-Time Record High with the S&P500 Index super-imposed:
------------------------------------
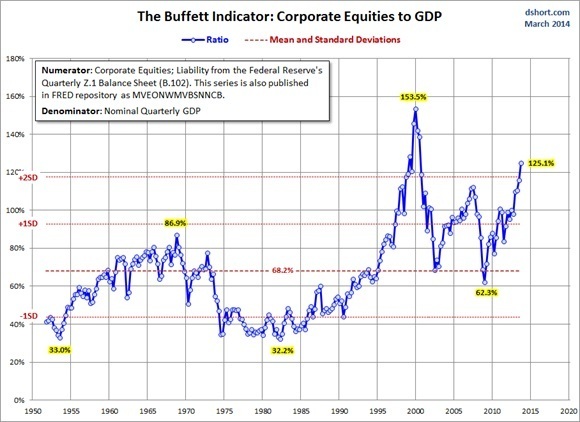
Warren Buffett’s Favorite Evaluation Metric: Total Market Value/GNP
The richest man in the world, billionaire Buffett has oft repeated that one of his most trusted metrics to determine relative valuation is total market value/GNP…to wit: Are stocks over-valued or under-valued?
The total market value/GNP chart below shows peaking in 1966, 1972, 2000 and 2007. Each peaking heralded the beginning of a bear market correction in stocks. And it is vitally important to notice the total market value/GNP has just recently forged the second highest peak since 1950.
Now we know why Buffett’s flagship company (Berkshire Hathaway) has been going to cash. His company has the highest cash level ($40 Billion) since 2007 (just before the stocks crashed). Surely Buffett knows!
********
Related Analysis:
Market Crash: https://www.gold-eagle.com/article/market-crash
The Coming Stock Market Crash Prediction
Stock Price Forecast When The Fed Stops QE3
Bear Market Forecast Via 7 Compelling Charts
********
Stock Market Forecast: Stocks worldwide are hell bent for leather topping out. In fact large prudent institutional investors are most probably taking profits by currently unloading their portfolios to the unsuspecting and complacent proletariat who traditionally end up holding the empty bag.
Monumental investor complacency today translates to global pervasive ignorance, which is best characterized by this photo of a naïve ostrich “hiding from imminent danger”:
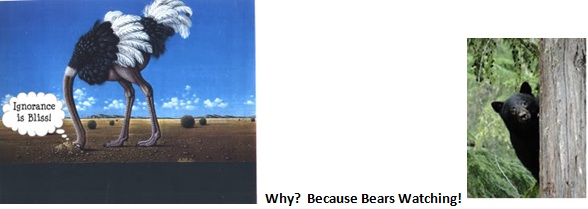
********


