Gold’s Days of Extreme Volatility: 1970 to Today


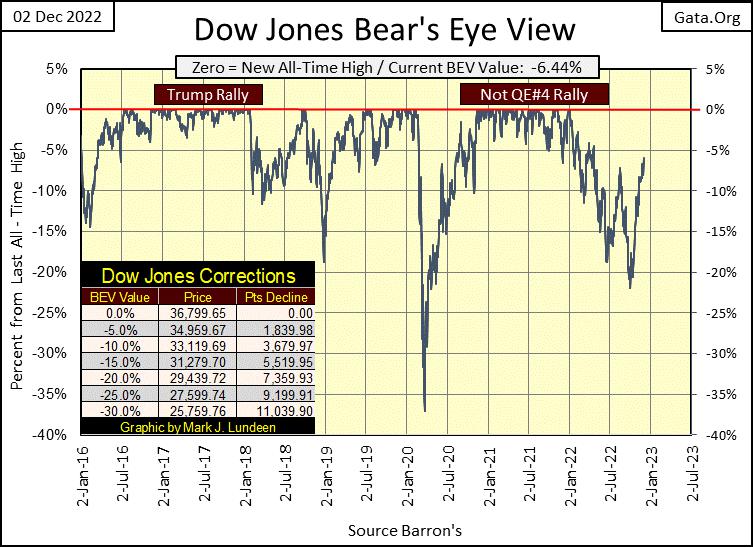
The trend is your friend, and right now the trend for the Dow Jones is up from its bottom of September 30th. Finishing the week just a hair away from closing in scoring position --> somewhere above its BEV -5% line. Why “scoring position?” If you look at a big-market advance in Bear’s Eye View chart, not everyday is a BEV Zero (0.00% = new all-time high). Most daily closes in a bull market advance are between the 0.0% BEV Zero line and the BEV -5.0% line, or in scoring position. From where the bulls can easily take the market to another new all-time high. Look at the BEV chart for the Dow Jones below during the Trump & Not QE#4 rallies to see what I mean.
What’s next? Should the Dow Jones close a few days in scoring position next week, I’d say we could see some historic market action from the Dow Jones.
But the Dow Jones is a construct of only thirty big blue-chip, dividend-paying companies, not the entire stock market. So, how is the entire market doing? For that we go down to my table listing the BEV values for the major market indexes I follow, and key market indexes are lagging behind the Dow Jones since September 30th.
For example, on September 30th the S&P500’s (#8 below) BEV was -25.25%. Today, the S&P 500’s BEV has advanced only about 10BEV points in the past two months. The NASDAQ Composite (#18) and NASDAQ 100 (#17) both on September 30th had BEVs of -33%. This week they both closed only a bit above that.
Is it possible for the stock market to be in another bull market advance with these key indexes falling so far behind the advance in the Dow Jones? Maybe, but I doubt it. Either these indexes are going to catch up to the Dow Jones, and hopefully advance above it, or the Dow Jones is going to lose steam, and come back down in the list below. It’s isn’t normal seeing the Dow Jones, thirty boring old industrial companies, in the #2 position in the table below.
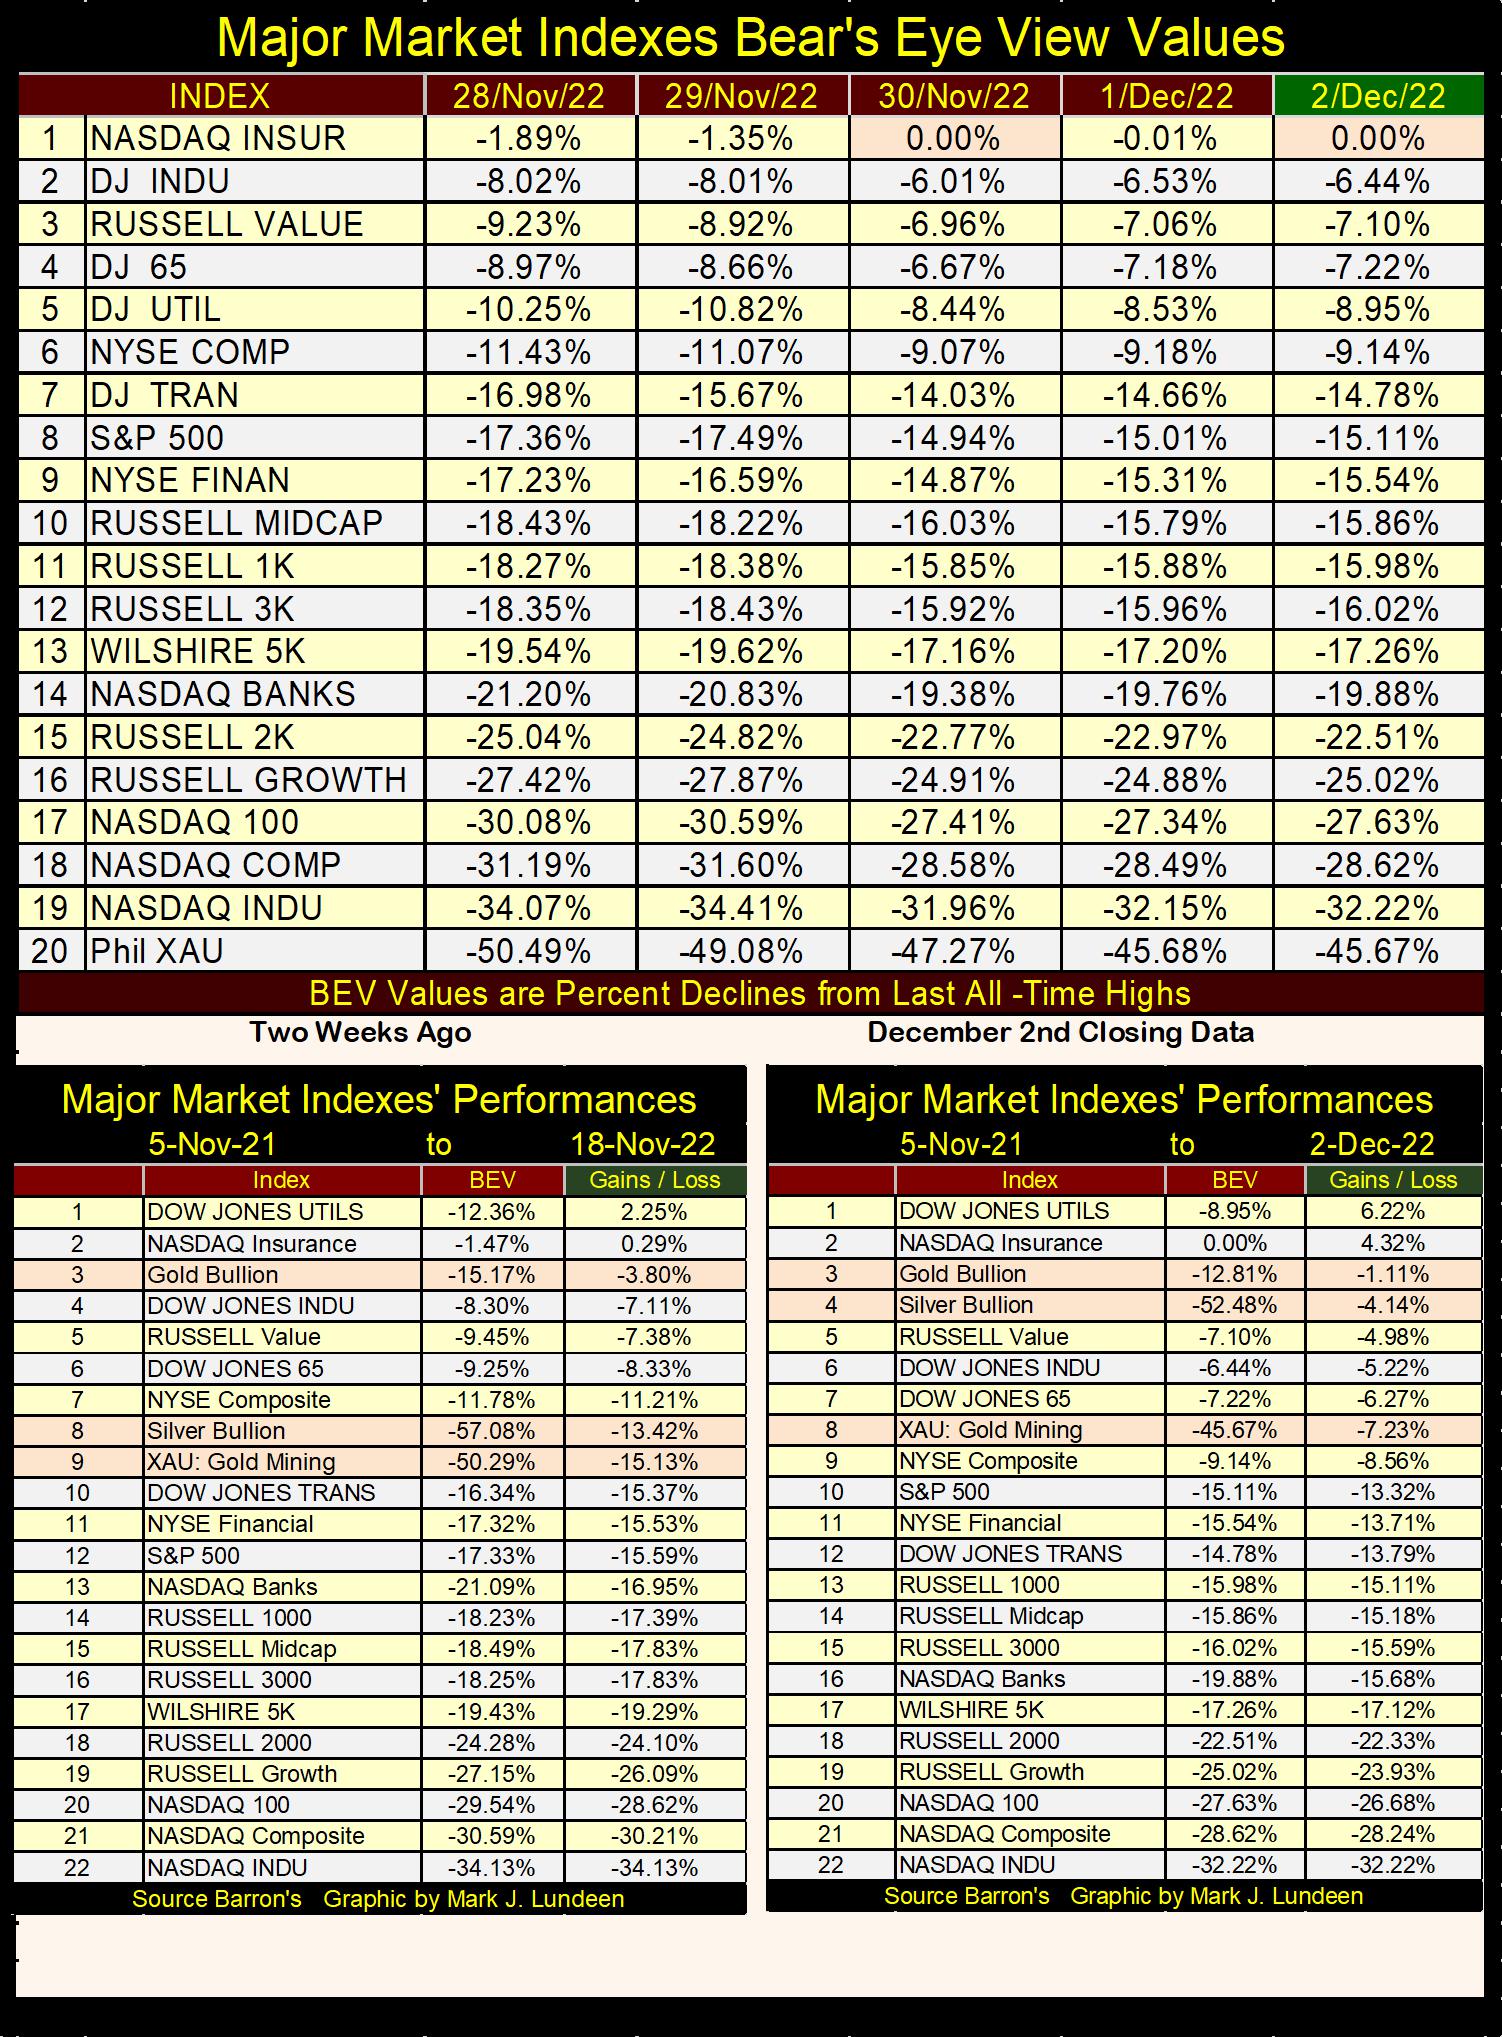
Is there a stealth bull market in precious metals assets? That is what is suggested in the two tables above. Data from my last article is seen on the left, this week’s data on the right, and this week silver kicked out the Dow Jones from the #4 position. Precious metal investments remained within the top 10, and up some for silver and the XAU.
The gains and losses (Green Tabs) for these tables are based on the closing prices for 05 November 2021, but their BEV values (Red Tabs) are based on their last all-time highs. It’s remarkable seeing the BEV values for the XAU at week’s close, at -45.67% from its last all-time high of April 2011. Silver’s BEV at week’s close is at -52.48% from its last all-time high of January 1980, forty-three years ago!
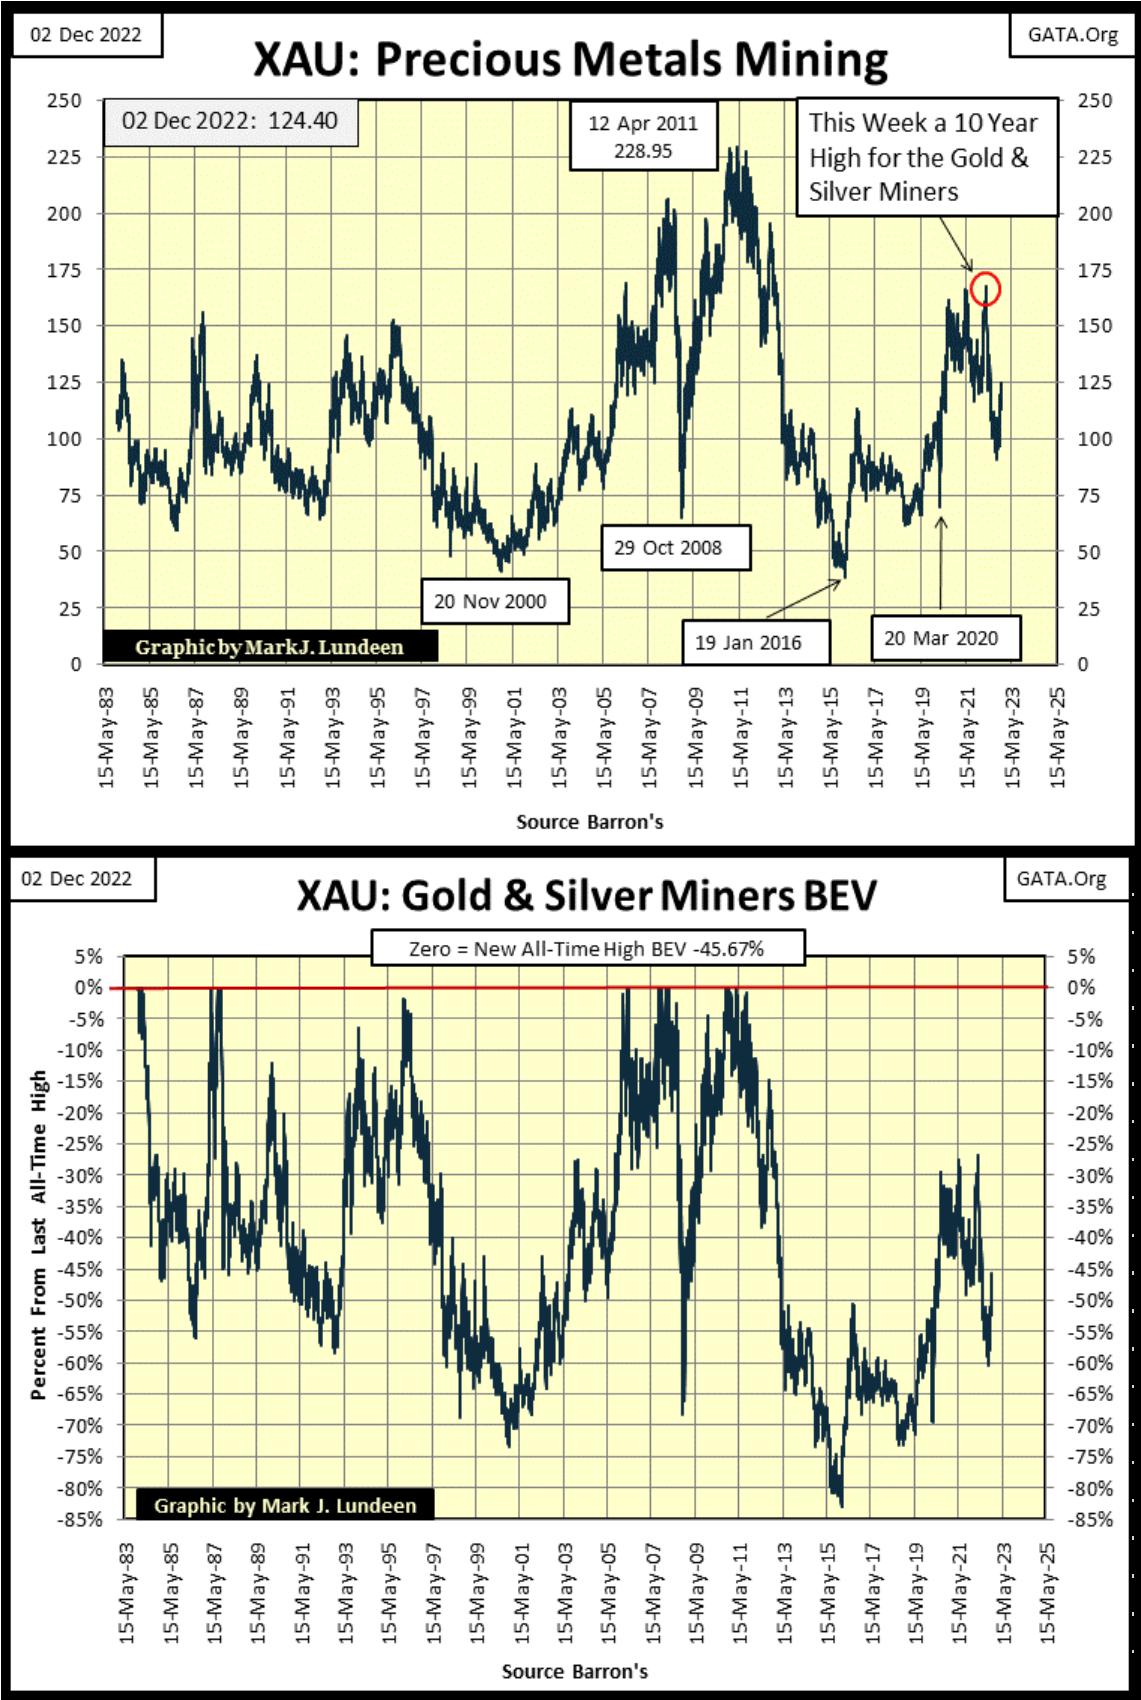
Let’s take a look at the XAU, which began trading on 20 December 1983. Upper chart (below) is in dollars, bottom chart in BEV format.
On its first day of trading, the XAU closed at 107.06. At week’s end the XAU closed at 124.40, for a thirty-nine-year gain of $17.34. String beans at the grocery story have increased in price more than that since 1983. Not much of a recommendation for mining shares. Except in December 2022, every sector in the stock market has a problem the mining shares don’t; they’ve been greatly leveraged with debt and derivatives. In the coming economic unpleasantness, there will be panic in the financial markets because of counterparty default due to the leverage other market sectors now have; panic I believe will pass-over precious metal assets.
Gold and silver miners must be the most compelling asset class in the stock market, but they’ve done nothing for investors since the early 1980s, as seen in the chart for the XAU below. Unfortunately, they have become the re-occurring bad decision that many investors were happy to forget.
For example; last March, the XAU hit a 10 year high, which to many, for example me, looked like blue skies and sunshine for the gold miners for the rest of 2022, only to have its valuation savaged in the following months. Since the Dow Jones began its current bull market in August 1982, this has happened many times for the gold miners. But the 2022 decline ended in late September, and once again the XAU is making a move to the upside.
But will it be any different this time? As seen below, since 1983 there have been many times the XAU was advancing, only to have the advance bushwhacked by those who want no excitement in the precious metals markets. But this is a game that can’t continue forever. It’s reasonable assuming the forty-year bull market in bonds topped out in early 2020. That plus the stock market has been going up since August 1982. The best part of the advances seen in stocks and bonds must be behind us. If financial assets aren’t rising, what else can they do?
They can also go down in a massive bear market, and that is what I expect they will do in the years to come. If so, money now invested in Wall Street will begin flowing away from deflation, seeking inflation somewhere else in the market. I anticipate this inflation will be found in commodity and energy prices, as well as gold and silver bullion, and the valuations of companies that mine precious metals.
I can’t see into the future. But in my studies of the markets of the 20th century, I’ve found the best time to buy any investment is when it is cheap. And cheap means a particular investment is widely scorned by the public and professional money managers. That pretty much describes the gold and silver miners as 2023 comes into view.
To make my point that I believe this time should prove to be different, let’s look at the XAU in the Bear’s Eye View format above. Since 1983, seeing the XAU decline 65% from an all-time high, was a very solid signal that the worst was over, and better times were ahead. But look at the XAU in January 2016; it broke below its BEV -80% line. That was seven years ago; seven years where the XAU has so far failed to break above its BEV -25% line in the chart above. What’s keeping the gold and silver miners down?
That plus, its last all-time high was in April 2011, over eleven years ago. That is a long time in the markets. Many billions-of-dollars of debt have been added to the US National Debt, and CinC (paper-dollars in circulation) as seen in the table below.
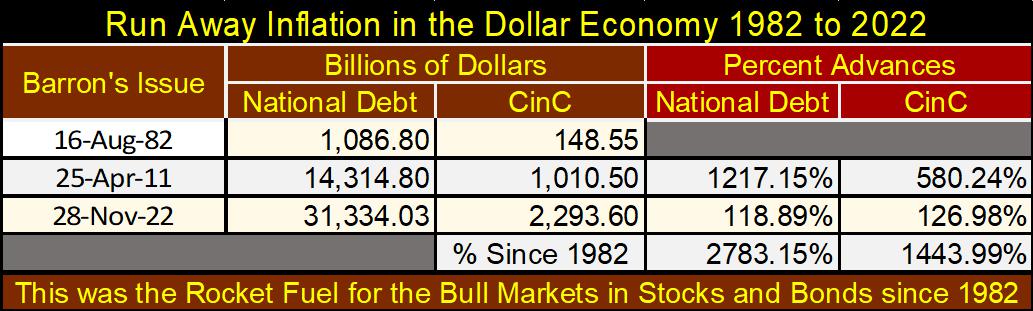
This flood of monetary inflation seen above is not only the stuff of a banana-republic government’s finance, it’s also what fueled the bull market on Wall Street since the early 1980s. Somehow, all of it missed the valuations of the gold and silver miners.
But precious metal assets are counter-cyclical to financial assets; for example, since 1982 stocks and bonds enjoyed huge bull markets as the miners in the XAU did little these past forty years. Let’s see what happens to the XAU when Mr Bear really begins deflating all the above inflation from the financial markets. I expect it will be something amazing!
But Mr Bear is AWOL on Wall Street. So far anyway, as seen below with the Dow Jones in its daily-bar chart below closing above 34,500 on Wednesday. Like I said, the trend is your friend, and for now the trend for the Dow Jones is up. But can it make a new all-time high on its current advance? Something above 36,799, if the NASDAQ and S&P 500 don’t begin catching up to the Dow Jones. And if so, what kind of bull market would that be on Wall Street?
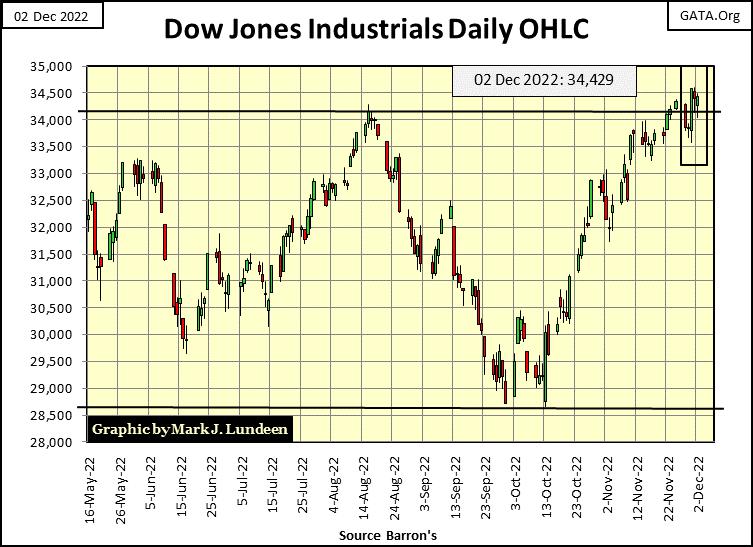
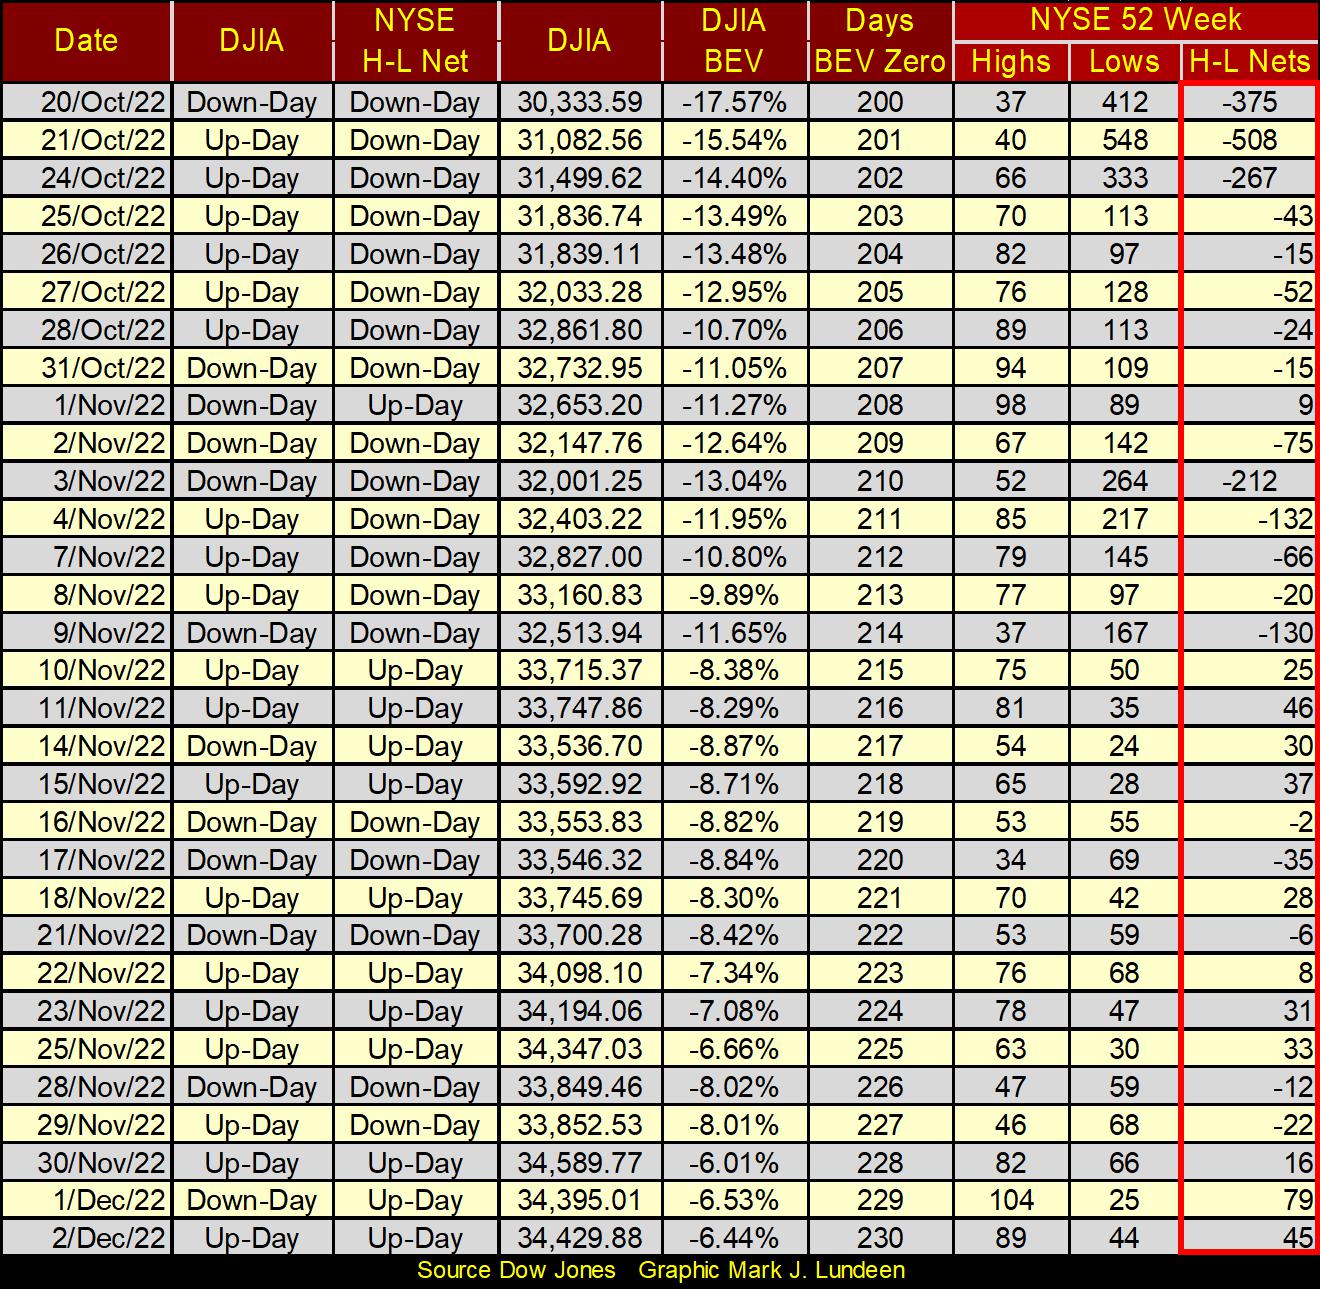
Another sore spot for the bulls are the 52Wk High – Low Nets at the New York Stock Exchange. The market bottomed on September 30th; forty-five NYSE trading sessions ago, lots of time for the 52Wk highs to once again dominate the trading on the NYSE. But with the Dow Jones now only 6.44% from making a new all-time high, since October 20th the bulls have failed to generate a 52Wk H-L Net of over +100 (table below).
That’s a problem the bears haven’t had. They managed a H-L net of -212 as recently as November 3rd. This is a very weak market, a market that is best observed as a spectator’s sport, high above the playing field in the market’s cheap seats. But if you’re actually making money in this market, keep doing what you’re doing. Just don’t fall in love with your positions, as this market could turn around fast.
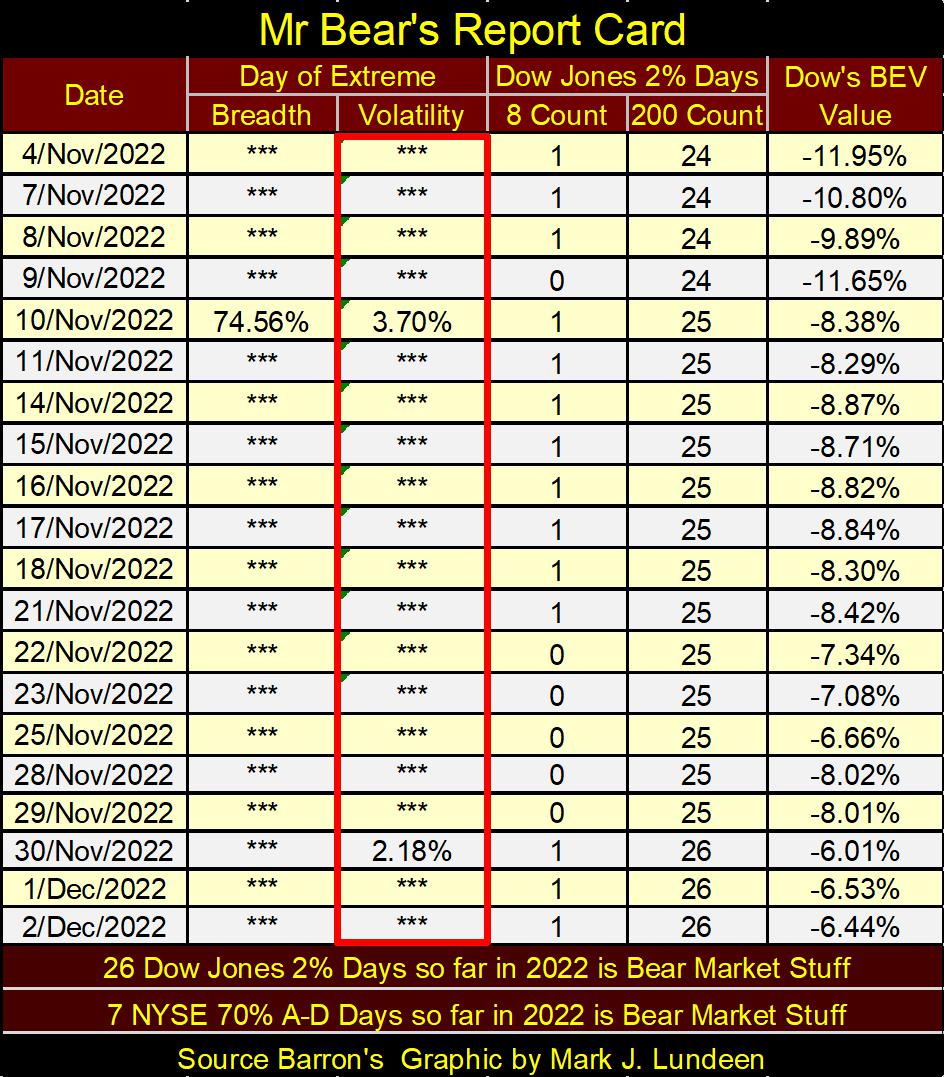
Looking at Mr Bear’s Report Card below, things have calmed down since October. But this week on Wednesday, we saw another day of extreme market volatility, a Dow Jones 2% day. That the Dow Jones advanced 2.18% from one day’s close to the next isn’t necessarily bullish. As 2022 so far has seen 26 Dow Jones 2% days, I’d say any day of extreme market volatility at this point is only one more precursor to a pending market decline.
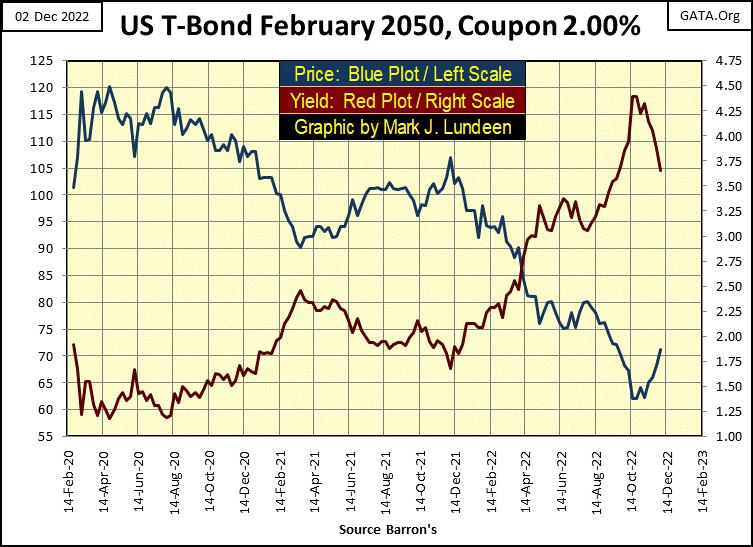
Here's a 30Y T-Bond issued in February 2020. It had a coupon of 2% at issuance, but in the past three years it has seen its yield (Red Plot) increase to just under 4.5% in October, as its valuation (Blue Plot) deflated from 100 to 61, a 39% decline. For the widows and orphans who own these T-bonds, this wasn’t supposed to happen.
Since its October lows, this bond has seen a nice rebound, but I wouldn’t buy it. The secret to true happiness in today’s debt market is to not purchase any T-debt whose maturity is more than a year away. And what about corporate bonds? Unless someone really knows the corporate bond market, they should be avoided.
Too many corporations have badly damaged their balance sheets since the credit crisis of 2007-09, with too much debt, and weighed down with derivatives. Sure, there are good companies amongst the many losers, but unless one is an accountant, how can an investor know who is who. And anyway, bonds are in a bear market. Rising yields will punish all bonds, good or bad.
Is it just me, but I don’t see anyone in the financial media boasting about the full faith and credit of the United States Treasury anymore. No, that doesn’t make me happy. I’m actually damn angry how Washington and Wall Street have abused the public’s trust.
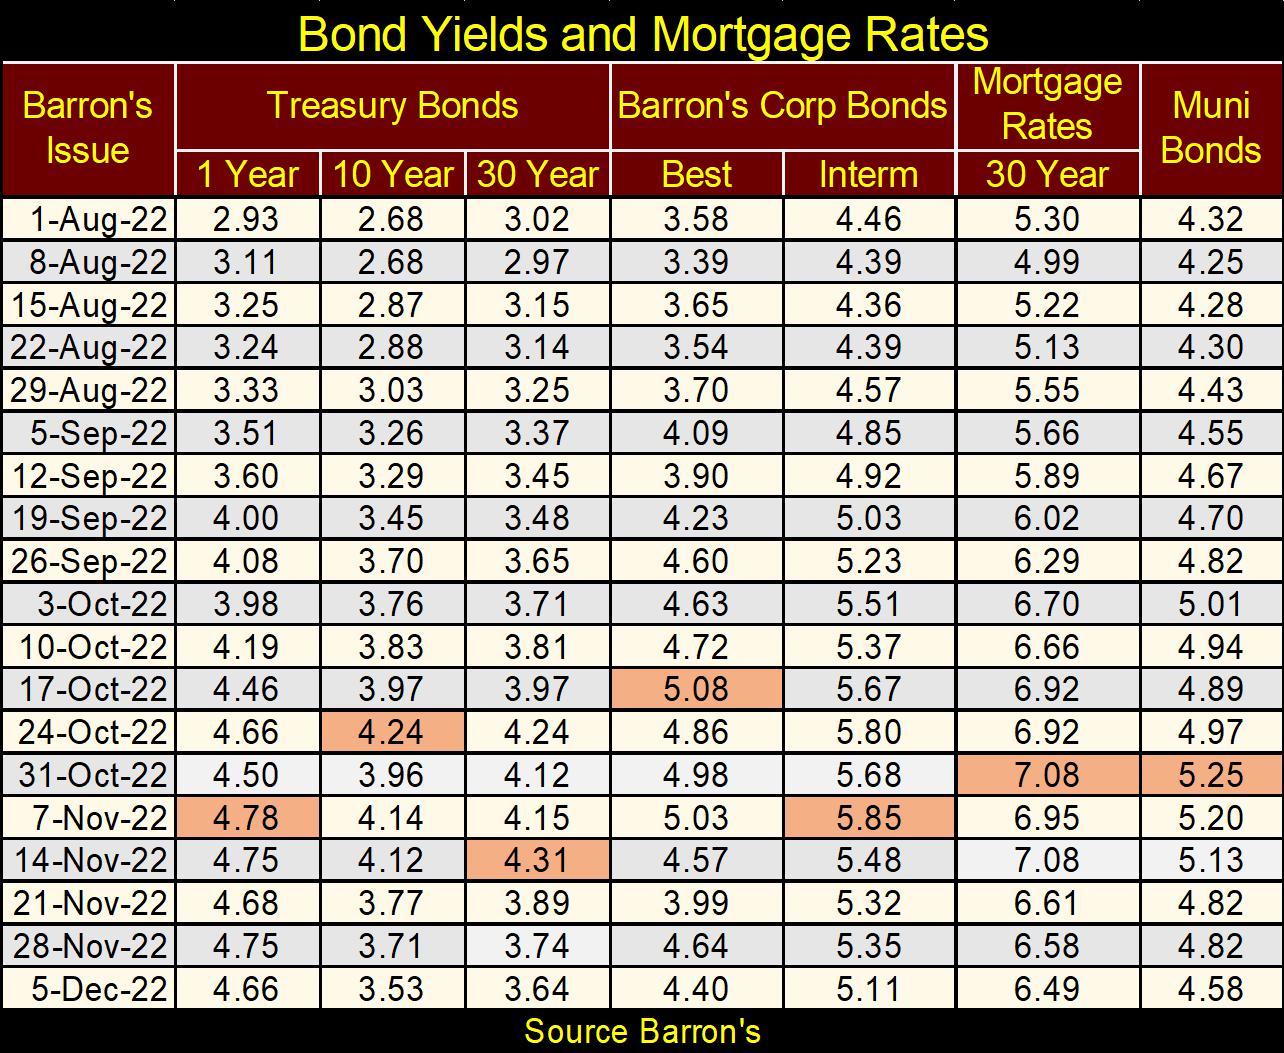
Here is a table listing yields for various bonds and mortgage rates. I highlighted the recent highs in the yields, and all of these bond yields have declined from their highs. But the bear market in debt still has a long way to go before it’s over. And the massive losses seen in bonds (Blue Plot chart above) have only begun, and that isn’t good for the bulls in the stock market.
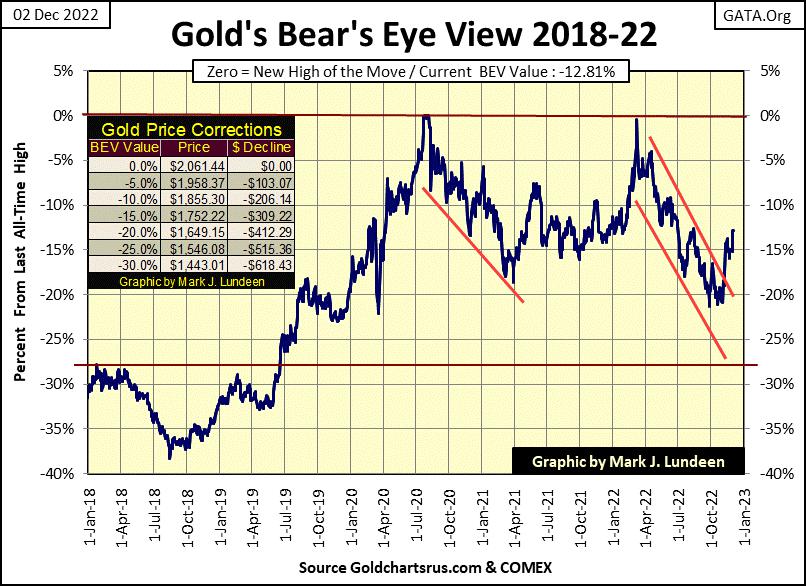
Let’s move on to gold’s BEV chart, gold being a historic counter-cyclical asset to the stock and bond markets.
And what do we see below? Gold, as I feared it might two weeks ago, didn’t go for its BEV -20% line, but is now advancing boldly towards its BEV -10% line. I still suffer from battered-bull syndrome (BBS), so as good as that appears to be, something deep inside me is having nothing of that, but keeps its laser-like focus in gold’s BEV -20% line.
Maybe I need to go back into my room and resume my fetal position until next week. The stress of advancing gold, and silver and the mining shares is taking a toll on me.
Then, maybe I should grow a backbone, and look a little deeper into the gold market going back to 1969. Like examining gold’s days of extreme volatility, which for gold are 3% days, days the price of gold increases or decreases 3% or more from a previous day’s closing price. Like the 2% days for the Dow Jones, the 3% days for gold are a threshold value. So, a 5% daily move (up or down) in gold is considered as a 3% day in this, and all future articles.
Gold is still considered a volatile market, but since 1982 much of gold’s volatility disappeared, as seen in the chart below. What happened? I blame this post 1982 volatility quiescence on the “policy makers”, who were fully committed to see their monetary inflation inflate bubbles into stock and bond valuations – not in gold and silver prices, or mining share valuations.
I’m not an expert on the subject, but that is my opinion, an opinion I believe market history will validate in due course.
When did the XAU first trade? * December 1983 *. That may become an interesting fact as we move on.
Pre 1983, gold’s 3% days were not only frequent, but frequently over 5%. Something lacking since 1983. So, what happened? The US Treasury discontinued the Bretton Woods $35 gold peg in August 1971, and began intensifying its monetary policy of inflation. By the early 1980s, bond yields were all double-digits, as was consumer price inflation. It’s hard to believe today, but when market volatility for gold frequently saw 3% days of over 5% moves from one day to the next, the stock market was a mug’s game.
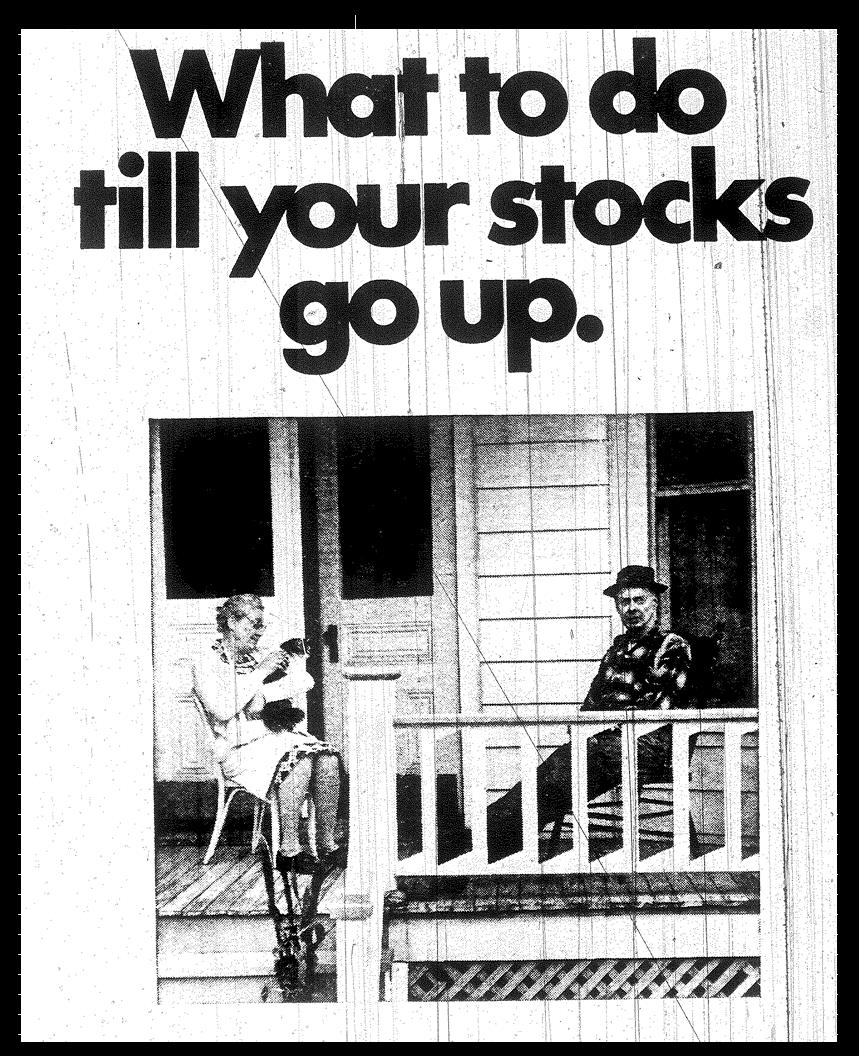
Here is an ad from Barron’s for investing in commodities during the 1970s, hinting investing in the stock market was one way, and not a very smart way of growing old. So, why not speculate in soybeans and copper contracts? And the ad was right – back in the 1970s.
But as the stock and bond bull markets began in 1982, as CPI inflation began coming down, soon extreme market volatility departed from the gold market. The second post August 1971 bull market in gold began in 2001, and it lacked the volatility seen in the first bull market in gold. But post 1983, when the gold market did see extreme volatility, it could create panic at the highest levels of central banking, as it did in August 1999, as GATA’s Chris Powell reported in the quote below.
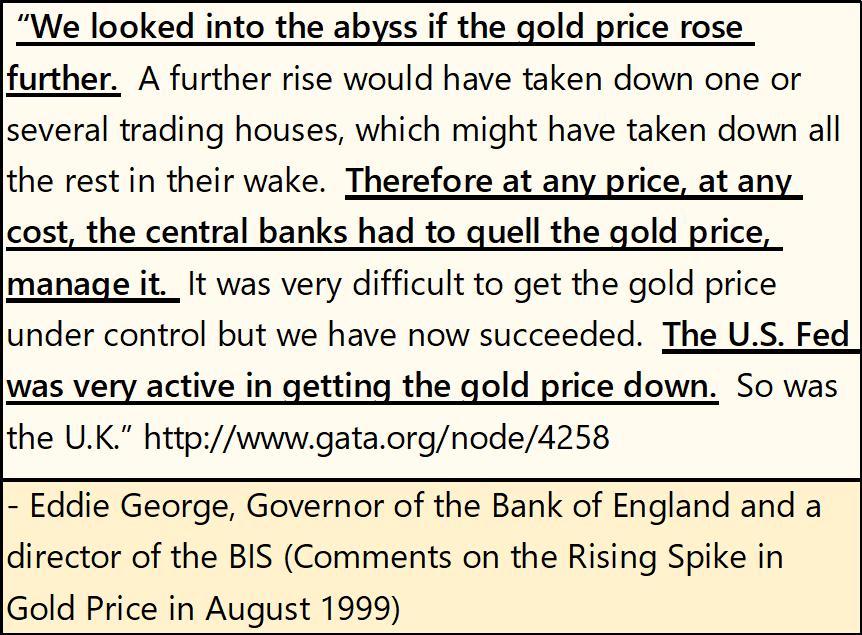
https://www.gata.org/node/4258
So, central banks, as well as the US Federal Reserve do manage the price of gold. And they like the price of gold as low as they can manage it. How long have they been doing that? Looking at gold’s days of extreme volatility in the chart below; I’d say just about when the gold market stopped seeing frequent 3% days: post 1982, not long before the XAU began trading.
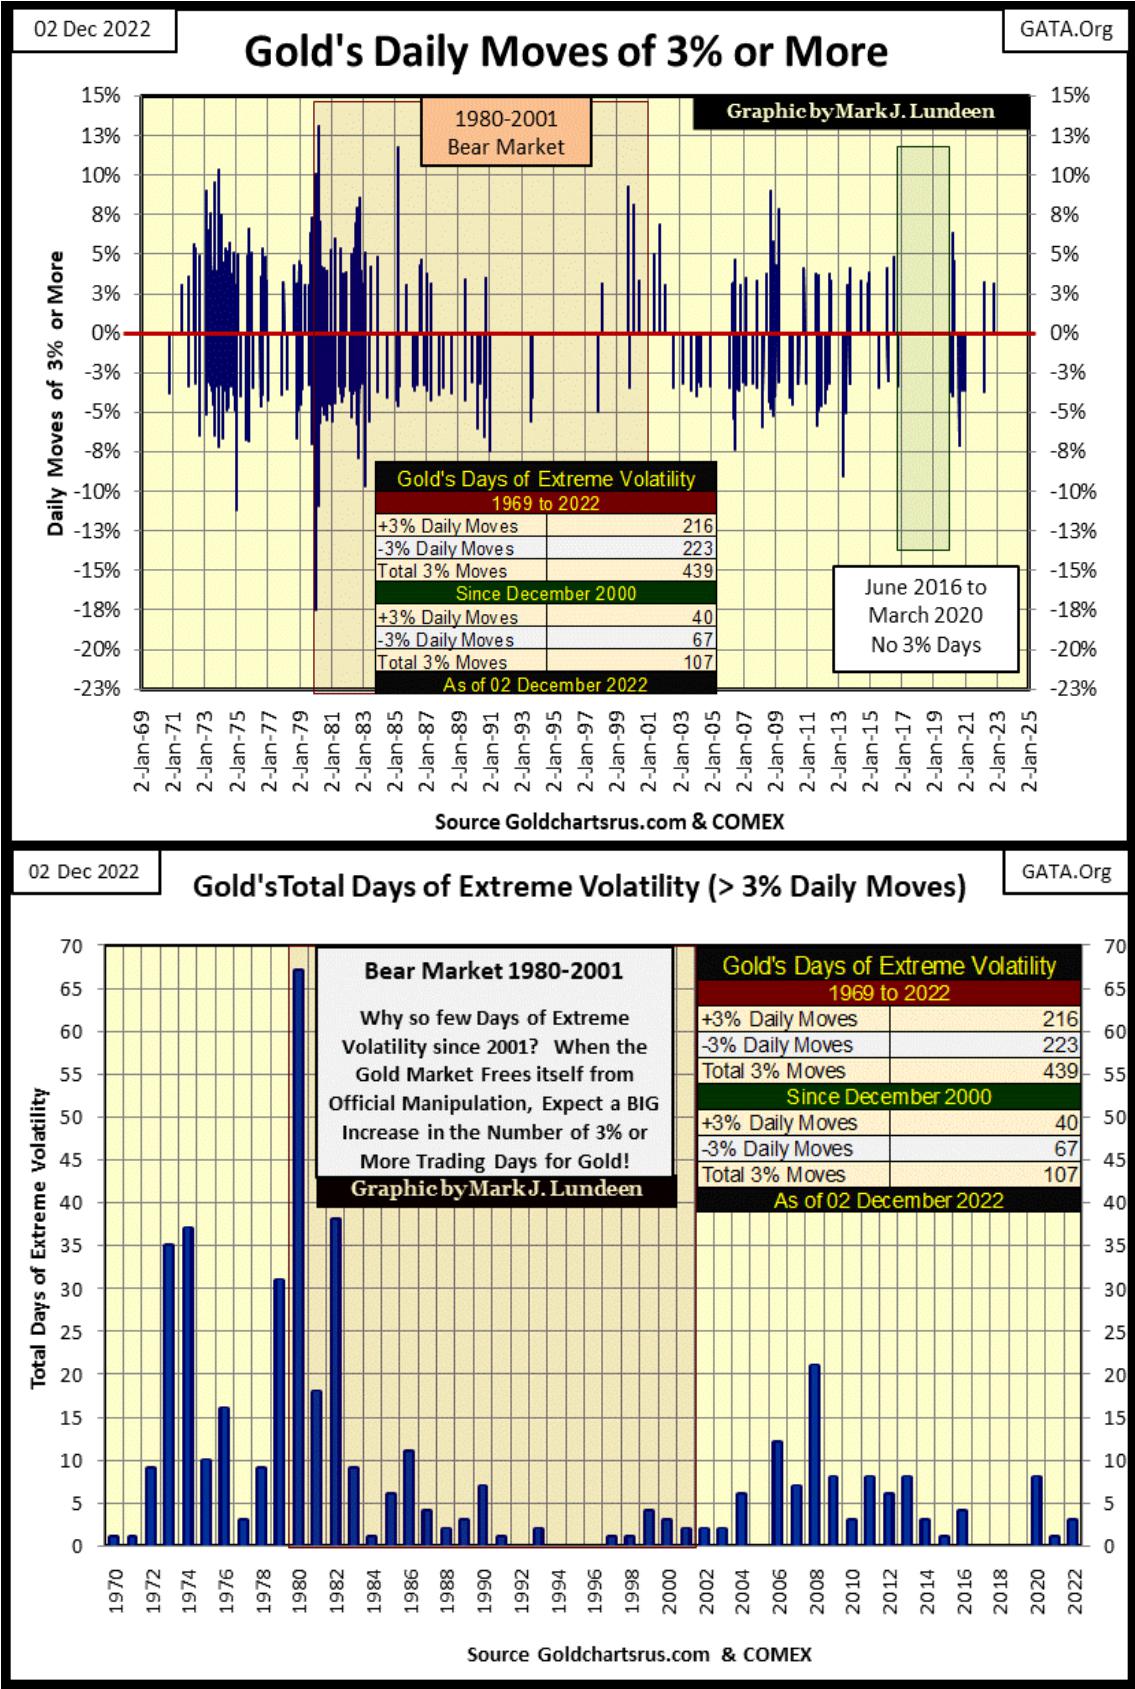
The chart above is the same data seen in the above graphic’s upper chart, but plots a count of gold’s 3% days per annum. The chart above is an excellent display of the volatility differences between the two gold bull markets; the 1970 to 1980 bull, and the 2001 to the present gold bull market. After 1982, the gold market was greatly changed in terms of daily volatility, and I’m pointing a finger at the central-banking cartel for making that happen.
For our current bull market in gold, post 2001, the year with the most extreme volatility for gold was in 2008, the year the sub-prime mortgage bubble became a central-banking crisis. That wasn’t a coincidence.
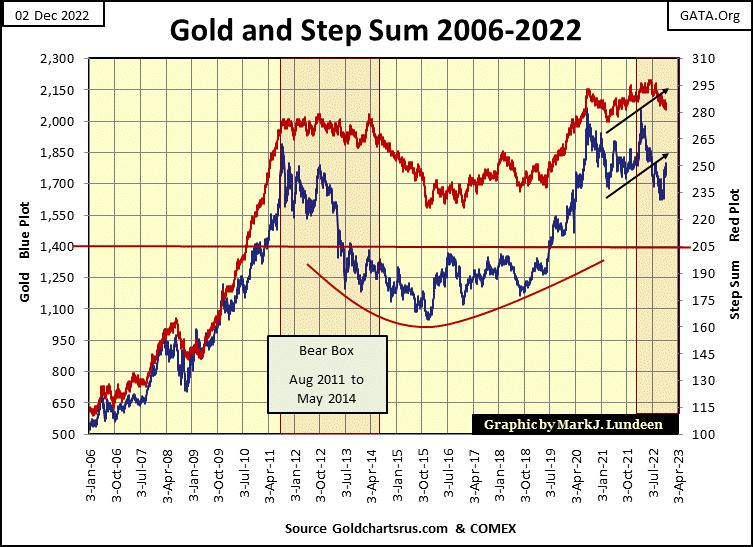
Here is gold’s step sum chart. About the bear box, I’m getting ready to close it as I think it’s about played out. Gold peaked last March, and began going down as its step sum continued rising for the next four months. Now in December, gold has been advancing since September as its step sum continued going down; which is what a bull box is.
It’s never simple and clear cut, but it seems this bear box’s days are numbered. I’ll give it a few more weeks to see what else will happen, but it won’t be as dramatic as gold’s bear box from August 2011 to May 2014, also seen in the chart below.
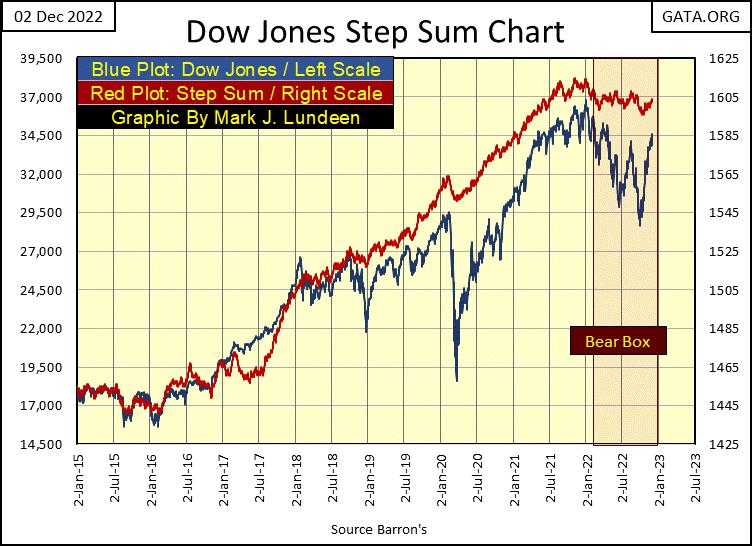
The bear box in the Dow Jones below also seems to have its days numbered. From the Dow Jones’ bottom on September 30th, this bear box suggested the stock market was approaching a major market decline. But the recovery in the Dow Jones since then put that idea out of mind. Like with gold’s bear box, I expect this box too is pretty much played out. But I’ll give it a few weeks before I officially close it.
With gold’s step sum table below, since October 28th gold has advanced 9.30%, even though thirteen of the past twenty-five trading days were down. I like that; nothing spectacular, but solid market action by the bulls. Also, gold with its 15-count of +1 is not overbought. That plus its daily volatility’s 200D M/A is slowly rising. I guess that’s good. But what the bulls in the gold market really need are some 3% days, those big daily moves in excess of 5% like we saw before 1983.
If this advance in gold is real, its step sum should soon advance well above its current 285. Time will tell all.
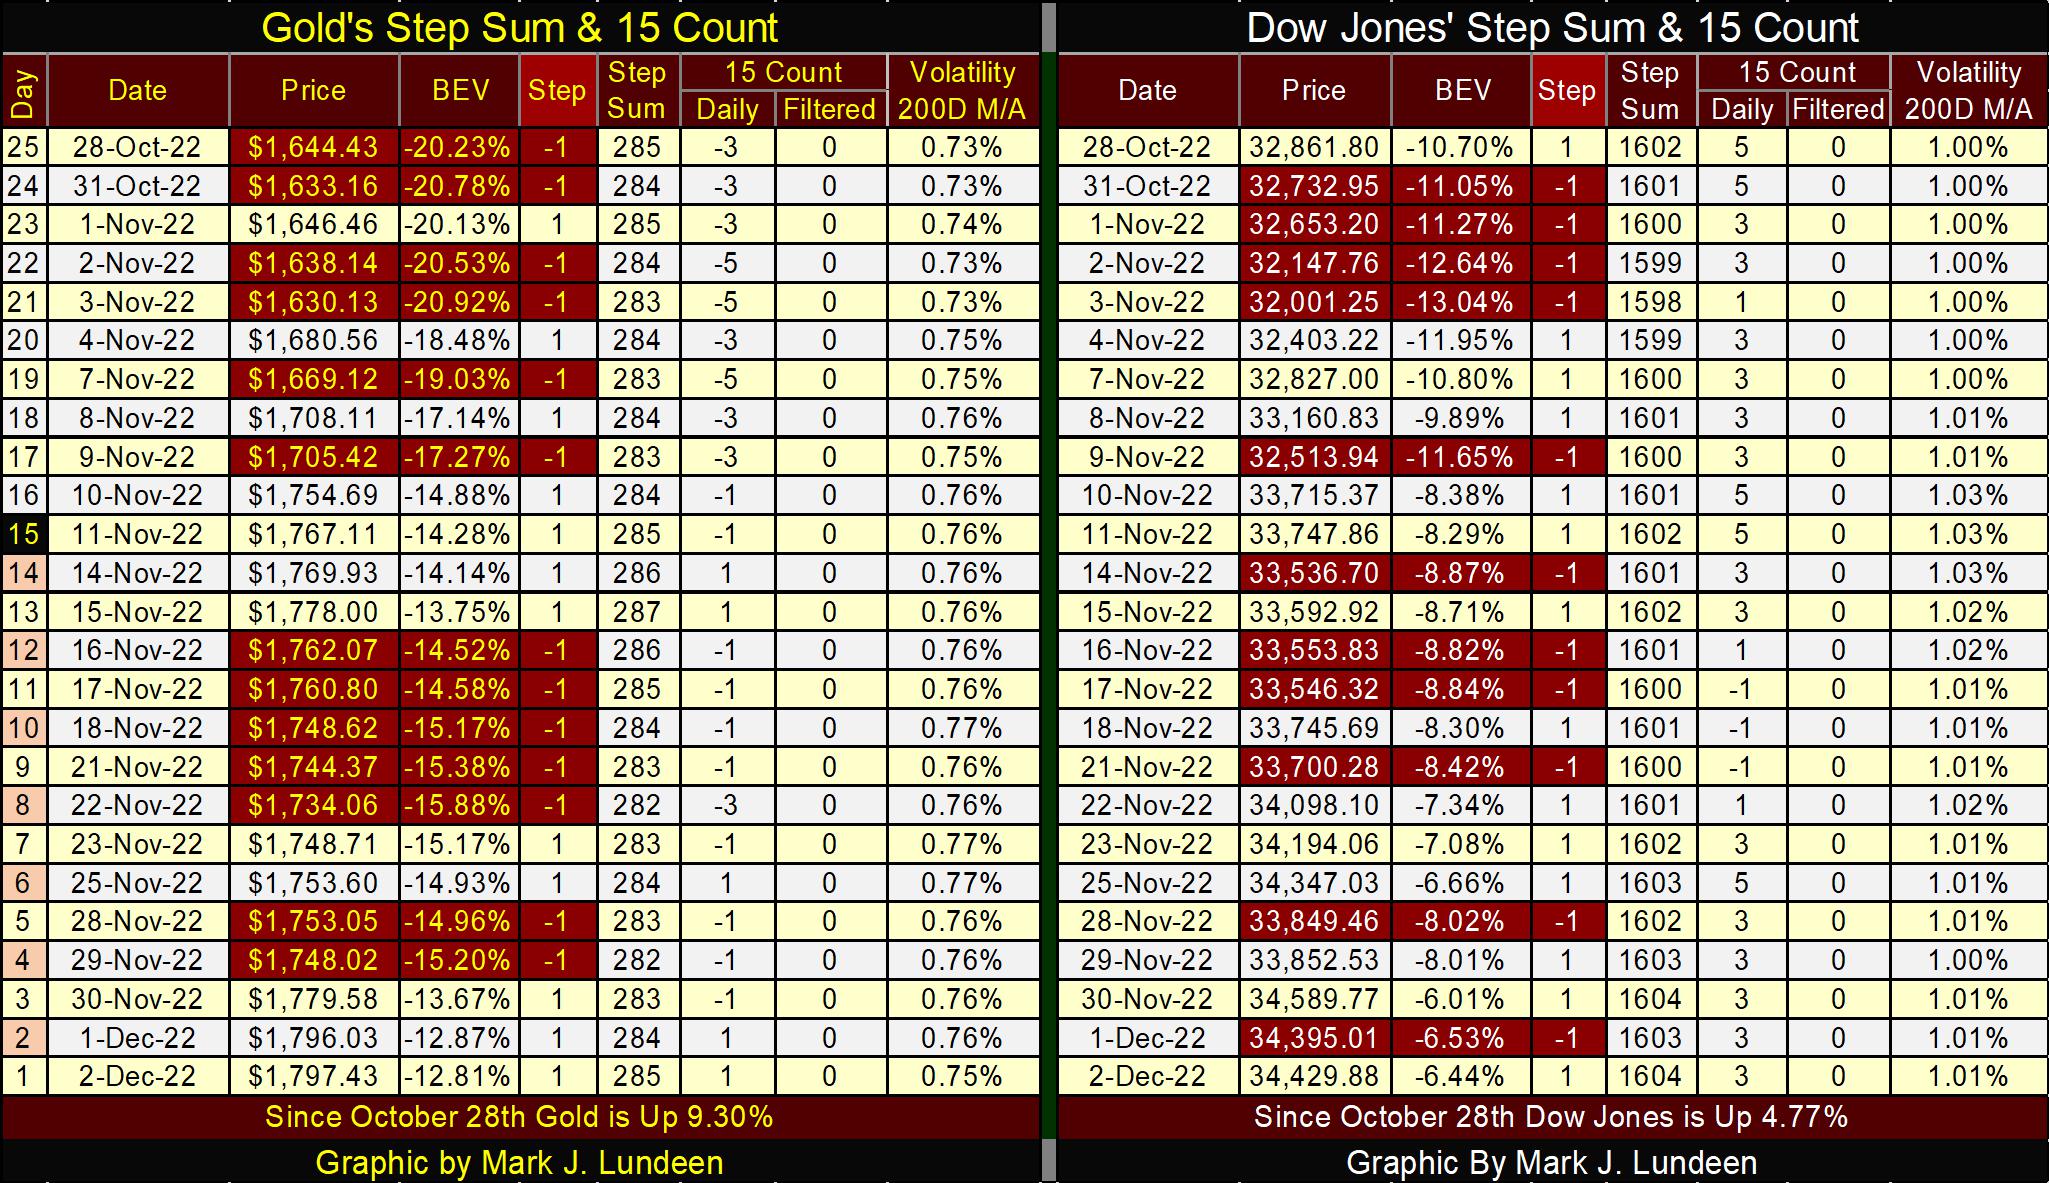
The Dow Jones’ step sum table is looking good too, but not as good as gold’s. Since October 28th, the Dow Jones has advanced 4.77%, with only eleven down days. Gold advanced about twice that with fewer advancing days. The Dow Jones’ step sum is also advancing, good. And its daily volatility’s 200D M/A has stopped increasing, meaning the Dow Jones 2% days are no longer coming in fast and furiously. If this advance in the Dow Jones is real, we’ll see its daily volatility come down significantly in the months to come.
First there was news the IRS was hiring 87,000 new employees for auditing American tax returns, with every new agent required to meet certain physical fitness requirements and undergo weapons training. No doubt America’s 600 billionaires were greatly upset at that news.
But the good news is that Bill Gates and Warren Buffet have no fear of being surrounded by hundreds of armed IRS agents as their tax returns were audited. No, that honor belongs to anyone who was making a few bucks on the side, and receiving payment via PayPal, or some other payment service. They’ll only begin to use cash once again for payment of these tax-free services that union members and handymen traditionally used for payments.
The next thing on Congress’ agenda is to cease issuing dollars as paper scrip (Federal Reserve Notes) and begin using Central Bank Digital Currency. Such a shift in “monetary policy” would have the advantage (to the government) of stripping all privacy from the public-at-large from any economic activity they would choose to take part in.
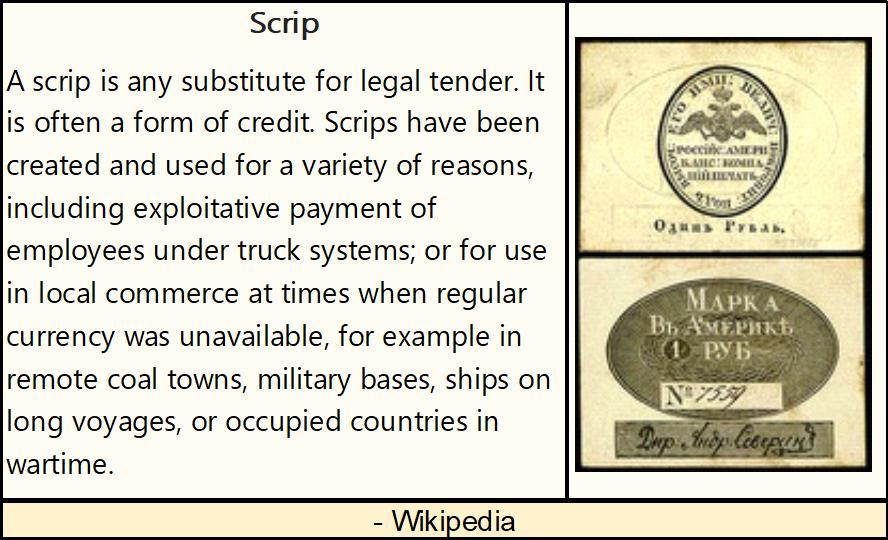
This central bank crypto currency would pretty much put an end to the guys debauching themselves with nights of booze and broads, funded from dubious untaxed sources, unless they are members of Congress or other high-government employees.
These people just never give up in bringing about the New World Order, a new world order where life will become hell for people like us.
Mark J. Lundeen
*********


