Gold’s First Down Year Since 2000
 share
share
 share
share
 share
share
 share
share
 share
share
Sorry for writing this before the last gold price of 2013 has been posted by the markets. But on New Year’s Eve I’ll be busy with more pressing matters than writing this article, using the actual last price of the year. I expect nothing exciting will happen in the PM markets between now and the end of the year (two trading days from now), so gold’s December 27th closing price is good enough for now.
As seen in the table below, it can no longer be denied; for the first time in thirteen years (2000-2013) gold will close below its previous year’s closing price. That’s an impressive thirteen year record that to my knowledge is unmatched by any other bull market. Silver, too, is closing this year with a loss, as it did in 2008 and 2011, making 2013 only the third year since 2000 in which silver closed below its previous year’s closing price. During a secular-bull market, an occasional down year is no big deal. The Dow Jones during the first thirteen years of its 1982 – 2000 bull market (1981-1994) closed down for the year three times, as we’ll see in a table later in this article. But members of the financial media will ignore this fact, and in the main dwell on the bearish implications of gold ending 27.59% below its 2012 closing price. However, with the stock bulls running wild at the NYSE, the financial media may not cover this topic at all.
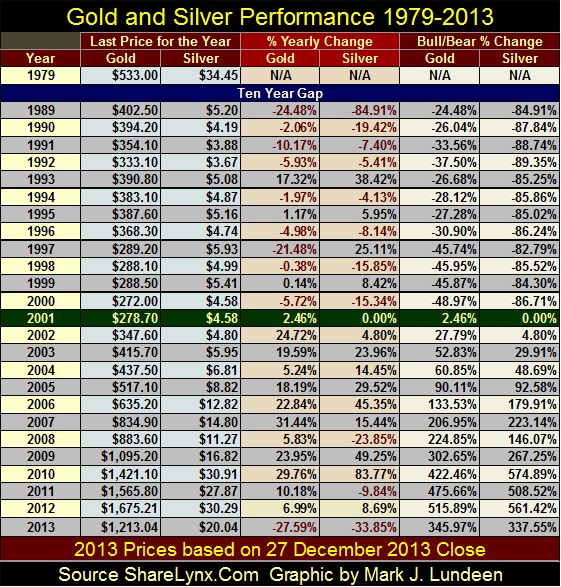
The 2013 year-over-year percentage declines for gold and silver may be large; larger than most of the yearly declines seen during their 1980-2001 bear market in the table above. So how can anyone still believe gold and silver are in a bull market? Because the precious metal bears in the paper futures markets have been cheating more than usual this year. Expect these big banks’ mindless shorting of paper metal in 2013 to cost them dearly with record percentage advances in the precious metals market for 2014 or 2015. Something like a 100% advance for gold and 200% for silver year over year in 2014. You understand I can’t guarantee that, but the market for physical gold and silver is extremely tight, no matter what the cascading COMEX prices during 2013 would have us believe. If you’re a bull who likes to buy low, the table above provides ample evidence that now may be the best buying opportunity since 2000 to enter the gold and silver bull market.
Gold’s step sum chart (below) is also interesting. To refresh my readers’ memory, the blue plot below (left scale) displays the price of gold in the Bear’s Eye View (BEV) format, where every new all-time high is displayed as a Zero %, and never any more. Any price not a new all-time high is displayed as a precise percentage decline from its previous all-time high. The BEV plot displays corrections within bull markets and bear market declines in percentage terms, while ignoring bull market advances that exceed previous all-time highs. But then this is Mr Bear’s view of the market; where every new all-time high counts only as a big fat Zero. The big furry fellow is only interested in how many percentage points he can claw back from the bulls on each all-time high (BEV Zero%), and that is exactly what we see below.
Gold’s step sum (Red Plot / right Scale) is a single item Advance/Decline Line that uses the daily advances and declines in the price of gold. Advancing days add a +1 to the step-sum line; declining days add a -1 to it. A point of interest is that come bull or bear markets, the number of up days are about the same as the number of down days. Since January 1969, there have been 11,300 trading days at the COMEX, yet the step sum below ranges from only -30 to +270 (300 day swing) from 1969 to today. This is not much of a signal, but it’s there. During bear markets there is a slight bias in the step sum for down days, as there is a slight bias for up days in a bull market; but this is not always so.
From 1987 to 2001 we see gold’s blue BEV plot (percentage decline in the price of gold) decline from 40% to 70% from its January 1980 all-time high. But notice that from 1987 to 1995 gold’s red step sum trended sideways. In the face of declining gold prices, the bulls refused to accept that they were on the wrong side of the market for a long time. It wasn’t until 1996 that the step sum began its catastrophic collapse to the downside, indicating that the gold bulls had finally accepted the fact that gold was in a bear market. Note how in 2001, both the price of gold and gold’s step sum plot reversed vigorously to the upside as the bull market began over a decade ago.
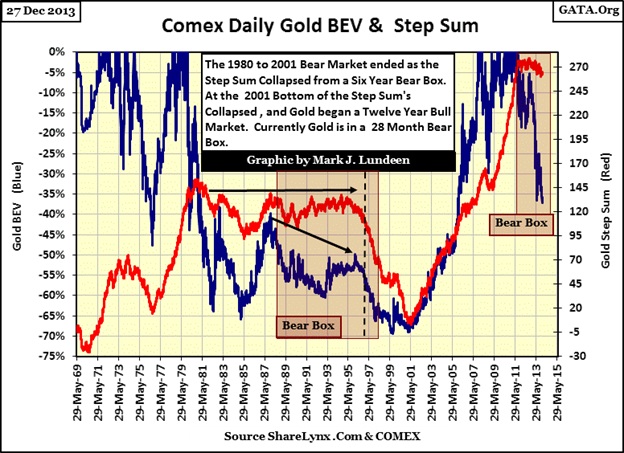
Since August 2011, gold has formed another step sum bear box, with the price of gold declining 37% as its step sum refused to follow the price of gold downward. This wasn’t a good sign for the bulls in the 1990s, but the 1990s was a bear market decade for gold, and in bear markets, the bulls are wrong. I anticipate seeing the current bear box resolved in the bulls favor, because in a bull market, the bears are wrong. As a gold bull I would not be surprised if the red-step sum plot began to drift down a bit from here, but the chances of seeing it decline sharply as it did in 1996-2001 is doubtful.
One more thing on the chart above; as volatile as everyone believes gold has been since 2001, our bull market has been a real pussy cat of a bull market when compared to the 1969 to 1980 gold bull market. Our current, and most severe correction (August 2011 to present) has seen a 36.5% decline from a previous all-time high (BEV Zero). But the BEV plot above shows that the gold bulls in the last bull market endured a 47% correction from 1974 to 1976. Since 2000, that hasn’t happened to the price of gold.
For many years, I’ve studied the gold market, and I really doubt that many retail (and even professional) investors showed much in the way of profits investing in gold during the 1969 to 1980 bull market; it was an insane time plagued with crazy volatility. When the bull market finally ended (January 1980), the bulls were so conditioned to expect deep declines in the price of gold that even after the 62% decline in 1982, they still expected the price of gold to go on to new all-time highs in a year or two. It wasn’t until gold’s step sum plot began to fall catastrophically in 1996 that we see that the gold bulls finally got the message of the market that Elvis had left the building over a decade before and their party was over.
Investing in gold and silver from 2001 to 2011 has so far been really easy. All anyone had to do to profit from investing in precious metals was to:
- Buy it
- Hold it
- And not watch CNBC.
However, for anyone who purchased silver after April 2011 and gold after August 2011, that hasn’t been true. Well, over time making money in the markets is frequently frustrating and never easy as market psychology encourages people to buy at the tops, and sell at the bottoms. For instance, at the close of 2013 it’s easier for most people to purchase stocks as the Dow Jones goes on from one new all-time high to another, and sell their gold after its 37% decline from an all-time high of two years ago. But I suspect that come December 2014, the smart trade of the coming year would have been to sell stocks and use the proceeds to purchase gold and silver.
I cannot make guarantees of what the future holds, but the chances of outsized gains for gold and silver in the year to come are outstanding. Over the next year I expect the physical gold market (Shanghai), where actual gold is purchased and then actually delivered, will overwhelm the regulated fraud committed daily in New York and London, where the gold traded is mainly a legal fiction and delivery of actual metal from the seller is seldom demanded by the buyer.
Next is a table comparing the first thirteen years of the Dow Jones’ 1982-2000 bull market with gold’s 2001 – 2013 bull. Prices are closing prices for the year. Note: the #1 year (Green and Gold Row) is 1982 for the Dow Jones and 2001 for the gold market. This works out nicely for gold as year #1 is 2001, which makes year #13; 2013. The table is divided into three categories;
- Last price for the Year
- % Yearly Changes
- Bull Market Advance
The thing I note about this data is how gold in its first thirteen years has seen more, and larger double digit years than did the Dow Jones. Also, from year #6 to #13 the gold bull market moved up faster than did the Dow Jones. Even after the -27.59% correction in 2013, we see in the Bull Market % Advance data that to date the gold bull mark is still ahead of the Dow Jones 1994 close during its bull market year #13.
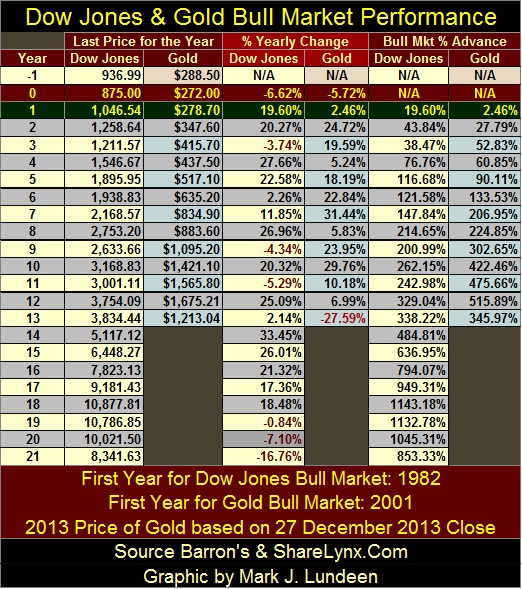
The table above also shows the results of the Greenspan Fed’s “monetary policy”; the yearly gains for the Dow Jones from years #14 to #18 (1995 to 1999) were all big double-digits advances. However the real action in the late 1990s was seen in the high-tech stocks traded at the NASDAQ. The NASDAQ Composite Index saw a year-over-year gain of 40% in 1998 and an 87% gain for 1999. Will gold in its current bull market see its year #14 with a 30% plus gain? If the Western Central Banks, which includes the Federal Reserve, run out of monetary gold to deliver to the Chinese in 2014, I expect we’ll see the price of gold do a double (100%) at a minimum. But like me, you’ll just have to hang around to see what actually happens.
I’m going to have my tumor removed on New Year’s Eve (December 31), and will be in the hospital for about a week. I don’t know how I’ll feel after that so I may not write again until later in January or early February. From what the doctors have told me about my condition, I have a darn good chance of seeing whether I’m right or wrong about the gold market in 2014. So Jesus willing, I expect to publish updated tables for 2014 next December.
Mark J. Lundeen
27 December 2013
share
share
share
share
share
More from Gold-Eagle