Gold’s Long-Term Trend: Up
 share
share
 share
share
 share
share
 share
share
 share
share
There is no stopping the rise in the price of Gold. As long as world Central Bankers continue to increase the quantity of fiat currencies, because Gold’s production is limited, a simple supply and demand equation predicts Gold must go higher. Hyperinflation pushes Gold’s value higher. Demand for Gold is also increasing as it is a key component of technological electronic products, an increasing product line worldwide. Gold also acts as a safe haven during times of war and political crisis.
The government held the $35 per ounce price until August 15, 1971, when President Richard Nixon announced that the United States would no longer convert dollars to Gold at a fixed value, thus completely abandoning the Gold standard. FDR tried to balance the amount of printed currency with U.S. Treasury Gold Reserves, limiting the amount of currency. Nixon’s action meant there is no limit to the printing of U.S. Dollars, and meant Gold could rise as high as it wants to, in relation to the quantity of Fiat currency in circulation.
Since 1971, we have seen a meteoric rise in Gold’s U.S. Dollar value. Below we show a long-term Elliott wave mapping for Gold since 1965. Gold exploded inside a Cycle degree wave I up Bull market that ended in 1980 right above 800. It then corrected that multi-decade Bull market as Cycle degree wave II down worked Gold lower through July 1999, bottoming around 250. Since then, Cycle degree wave III up has been driving Gold’s valuation higher. Elliott waves must be proportional to each other within a degree of trend. The Bull market in Gold from 1999 through September 2011 took Gold up to 1,923, but on a logarithmic scale was not proportional to the Bull market through 1980. Neither has been the corrective decline from September 2011 through now here in September 2018. This tells us that the Bull market through 2011 and correction through 2018 are one degree lower than Cycle degree. They are therefore Primary degree moves, wave (1) up and (2) down. What this means, is Gold remains inside a powerful Cycle degree wave III up Bull market. Significantly higher upside is coming to Gold. Next is Primary degree wave (3) up. This should be impressive.
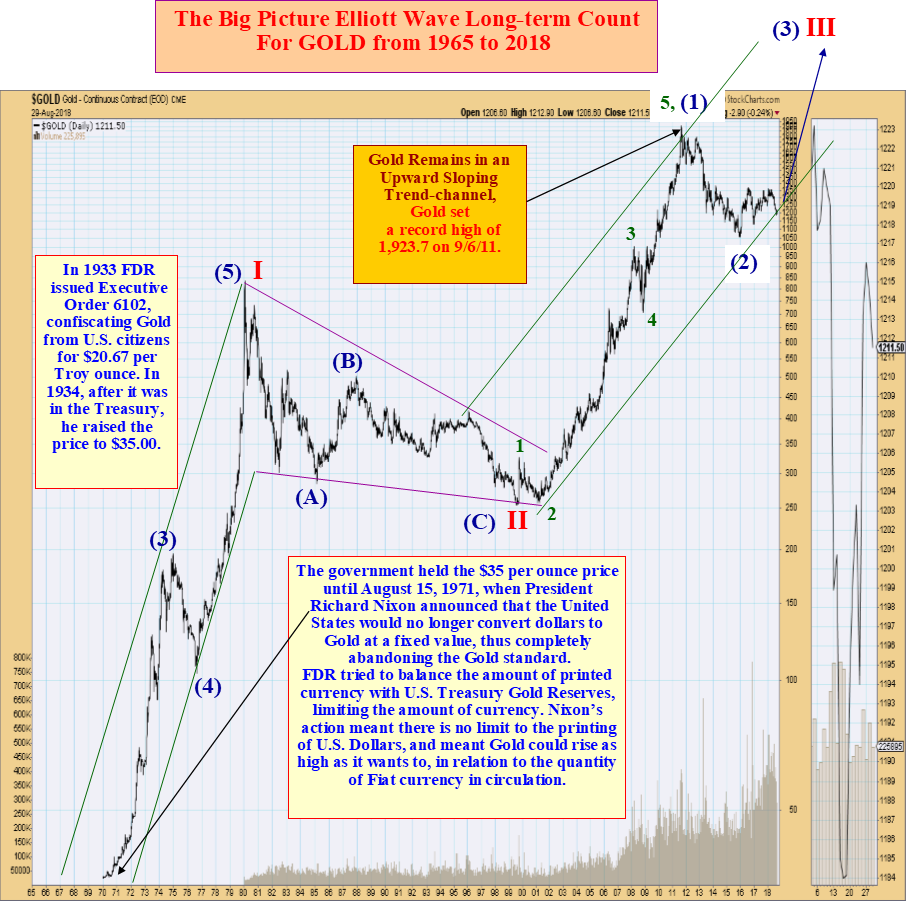
The big picture shows that Gold is rising inside a long-term ascending trend-channel for III Up. The first primary degree leg up, wave (1), topped in September 2011. Since then Gold has been inside a corrective primary degree wave (2) down. Next will be wave (3) higher.
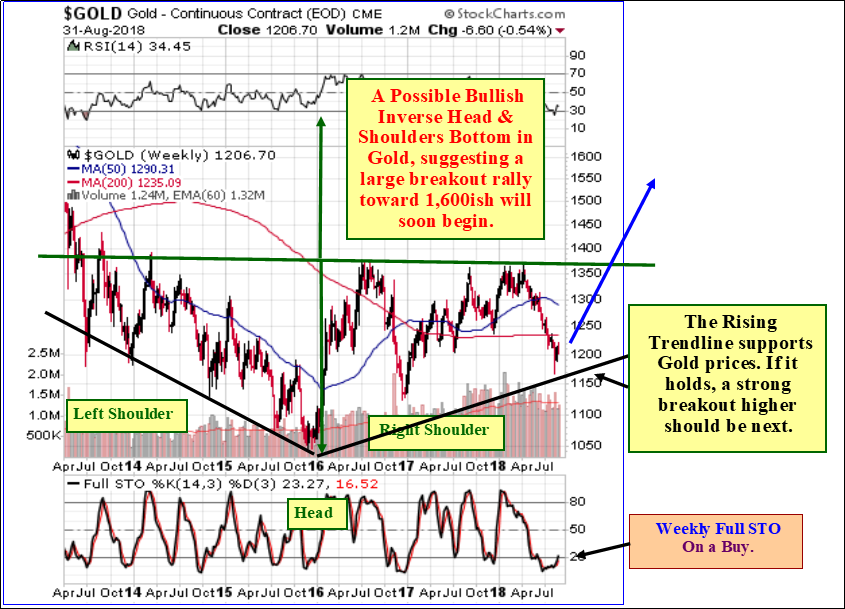
The next chart below is fascinating and very Bullish. Gold has formed a long-term Inverse Head & Shoulders bottom, with well defined trend-lines acting as boundaries for all the significant bottoms since 2013. Gold just fell to the rising bottoms trend-line from its low in 2016. If this trend-line holds, Gold is about to enjoy a long and powerful Bull Market. Of interest also from this chart is the Weekly Full Stochastics are deep oversold, supportive for a strong breakout higher. The Upside price target for this pattern is 1,600ish.
Gold prices have a strong correlation with Mining stock prices. At www.technicalindicatorindex.com we have developed several proprietary indicators that help us identify when the next significant move is starting for Mining stocks, and in which direction the move will develop. We publish these indicators in every Daily Newsletter to subscribers. When we get new Buy signals in our HUI Mining stock key trend-finder indicators, we will have high confidence the next major Bull market in Mining stocks, as well as Gold, is starting.
Let’s examine what those Mining stock key indicators are telling us at this time.
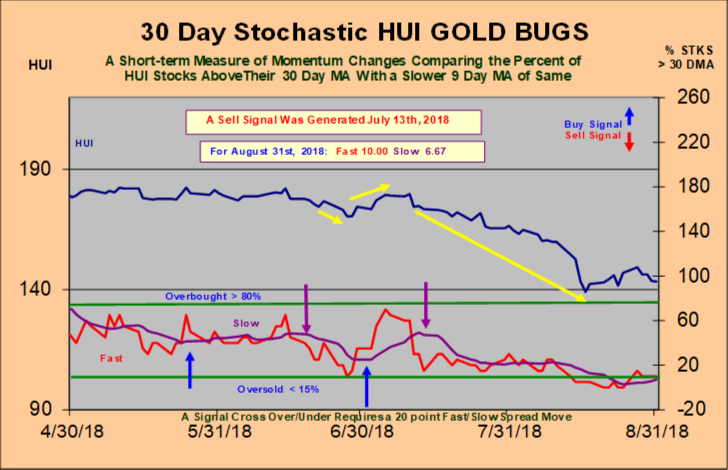
Mining stocks moved to a new Key Trend-finder Sell signal Friday, July 13th, as the HUI 30 day Stochastic joined the HUI Purchasing Power Indicator on a Sell.
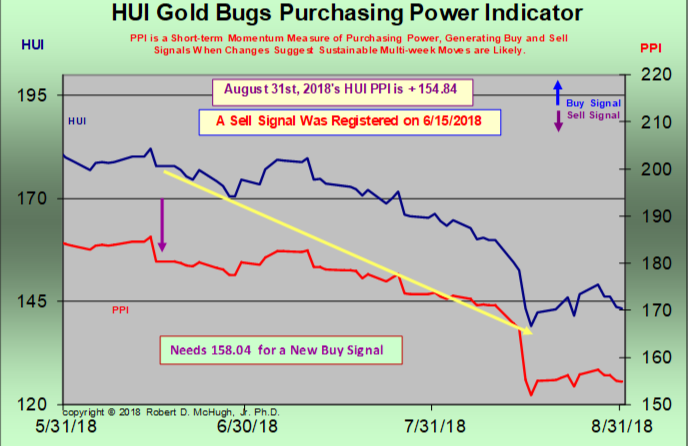
The Purchasing Power Indicator shown below is a momentum measure that identifies when momentum is powerful enough to expect the object in motion, price, to continue in motion, either up or down. It last triggered a Sell signal back on June 14th.
Volatility has picked up in August, after being absent for Mining stocks over the previous five months. This is a good sign that the next Bull market is approaching. After a lengthy absence, Buying interest is rising.
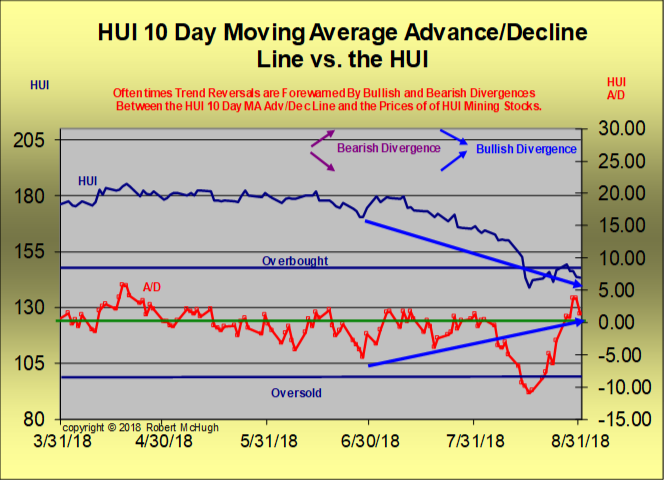
The next chart below compares the HUI 10-day average Advance/Decline Line Indicator to the HUI price index. What we are looking for are divergences, either Bullish or Bearish between these two measures. When we spot them, they can be nice early warnings of a coming price trend change.
We are now seeing a Bullish divergence occurring, suggesting a new large degree rising trend is not far off.
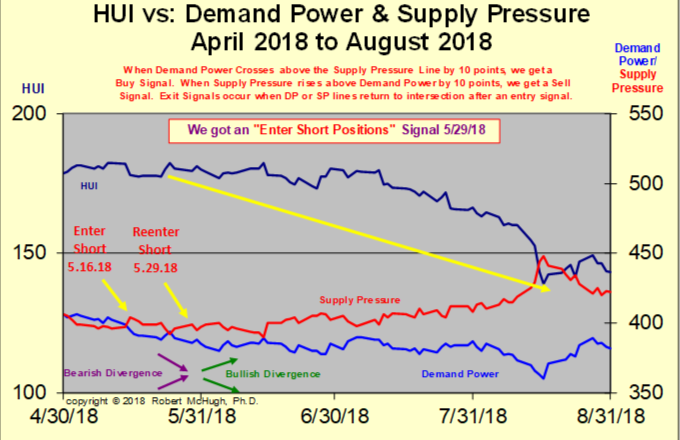
The next chart shows our proprietary HUI Demand Power / Supply Pressure Indicator, which gives both Buy and Sell signals. At this time, this indicator remains on a Sell signal. This chart also can give Bullish and Bearish divergences as early warnings of a coming price trend turn. What we focus on is comparing Demand Power versus the HUI price index. While at this time we do not see any clear and obvious divergences, we do note that there has been convergence between Demand Power (rising) and Supply Pressure (declining) which could be an early indication of a coming trend turn higher.
Once we get new Buy signals in our key indicators, we will have confidence that the next Bull market is starting.
What the technical charts and analysis is telling us is that there is an impressive rally phase, a strong Bull market, not far off for Gold bugs to enjoy.
*********
At McHugh’s Market Forecast Services at www.technicalindicatorindex.com we will be watching this development carefully and will report to our Subscribers when the Bull market begins. As traders and investors, we want to be ready and not miss this once in a decade opportunity.
share
share
share
share
share
More from Gold-Eagle


