Gold’s Mania Phase, Debt Collapse and War
 share
share
 share
share
 share
share
 share
share
 share
share
The current gold bull market continues to track the one of the 1970s and appears to be in the mania phase. Here is an update of my 1970s gold bull market comparison:
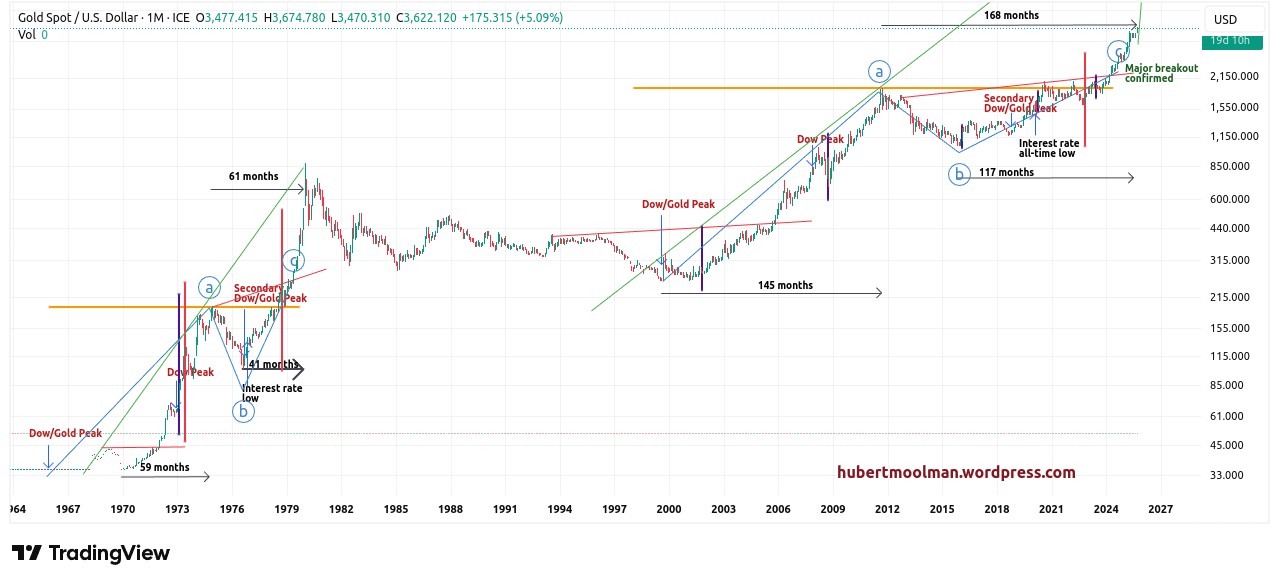
I have marked out two patterns that show how the recent breakout puts gold in the acceleration phase of the bull market.
Both patterns start at the Dow/Gold ratio peak (1966 and 1999 respectively). After the Dow/Gold ratio peaks, gold went on strong bull run, which continued even after the 1973 and 2007 Dow
peaks , respectively.
After the peaks at point a, the chart formed a cup-type pattern. During this consolidation (the cup) there was a secondary Dow/Gold peak and also interest rates made an important low.
The structure of the 1970s pattern was such that after the bottom (point b) during the cup phase, price moved relatively slowly up at first, but once it broke out at the red line it moved up quite fast. Even current geopolitical risks (as they relate to the US dollar) suggest that this is plausible.
The current pattern is following that same type of progression. The move since the low of the cup phase (point b) has been slow, and now that price finally broke out at the red line (in 2024), we are seeing an accelerated increase in price.
Now, this comparison shows beautifully the similarities between now and the 1970s. However, what it is not showing, is these differences that make the current times (which gold and silver is warning of) so dangerous.
1. Debt bubble
During the 1970s, the US and the world had a completely different debt profile than today. Debt levels were much lower than today, and GDP was growing faster than debt, as is evident in this post. Today, major sovereign debt defaults are inevitable (based on the unsustainable debt levels), and gold is probably trying to tell you that.
2. Stock Market Bubble
There was no stock market bubble during the end of the 70s. In fact, during 1979, at the height of the gold bull market, the stock market was virtually at the end of its correction that started in 1973. Relative to GDP, the stock market was at its lowest levels relative to GDP (see the chart below).

Currently, the stock market is definitely in bubble territory. Only during the Great Depression was the stock market more overvalued based on GDP.
3. World War
During the late 1970s there was certainly no world war raging. The invasion of Afghanistan was the closest thing to a world war. Currently the world is, by some measures, certainly engaged in a world war, and this is not even counting the trade (tariffs) and monetary wars (BRICS and de-dollarization).
Even the financial charts suggest that we are at the door, or even in World War 3.
There is no way that the current gold and silver bull market will end like the early 80s. Expect the end of the current world monetary order and lots of chaos.
You can continue to track the gold and silver bull market with this kind of analysis at my premium gold and silver blog or my Silver Long-term Fractal Analysis Report.
********
share
share
share
share
share


