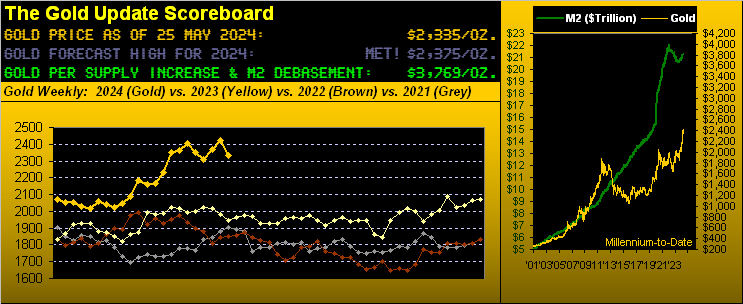
Gold’s Marginal High and Habitual Cry


We start with this from the “Pat on the Back Dept.” Per the prior missive penned a week ago (“Another Gold All-Time High is Nigh”), ’twas therein stated that Gold (then 2420) was exhibiting sufficiently daily trading range such that one could reasonably expect a fresh All-Time High (above 2449) to occur as soon as last Monday … which is precisely what happened, the yellow metal trading up to 2454 … but that was it.
So let’s thus transit from that department to the “Pass the Hankie Dept.” as Gold’s new All-Time High was at best “marginal”. And All-Time Highs recorded by Gold since at least the COVID years-to-date have then — oft with promptness — seen price go through “habitual” selling. To wit: following Monday’s 2454 high, the yellow metal this past week hastily traded down -128 points to as low as 2326 before settling yesterday (Friday) at 2335. So yes, you may cry.
Yet we offer this broader-based solace. Century-to-date, Gold has amassed 5,887 trading days, of which All-Time Highs have been registered on 268 occasions. For those of you scoring at home, that means across these past 24 calendar years, Gold averages a fresh All-Time High every 22 trading days, which essentially is once per month, albeit that is far from linear: for the nearly nine-year stint from 07 September 2011 to 27 July 2020, nary an All-Time High was notched, price in that duration dropping as much as -46% down to 1045 on 03 December 2015.
‘Course more recently, not every incremental All-Time Gold High since the COVID outbreak in 2020 has then been swiftly sold off. And yet, an inevitably habitual pattern of selling certainly is made manifest by the following chronological table of just how far Gold — following a run of All-Time Highs — has then declined within one month:

And the low row in the above table reflects last Monday’s All-Time High at 2454. Note therein the decline with only four trading days having since passed, price already having come off by as much as -5.2%.
Now hardly are we bearish on Gold: but ‘twould not be untoward to see price glide lower still given Gold having just crossed below our Market Values “smooth valuation line” for the first time since 28 February. As you seasoned website followers know, eclipsing that line to the downside (be it for any of the five primary markets which comprise BEGOS, i.e. the Bond / Euro / Gold / Oil / S&P) regularly leads to further selling as we below show. Note this latest negative price crossover as encircled in red, (the lower panel oscillator being price less valuation):
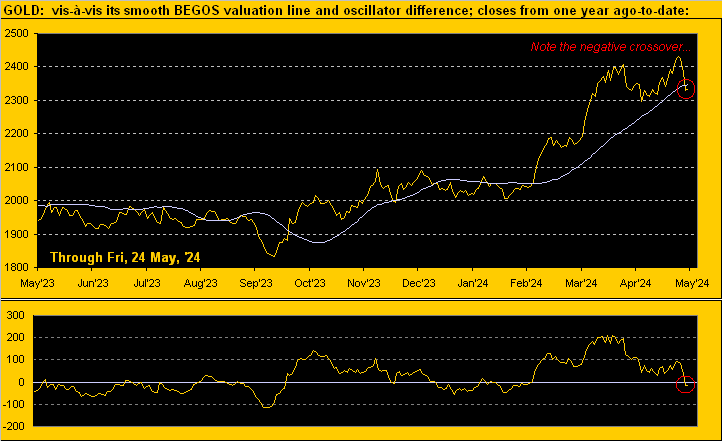
Specific to the current crossover, ’twas confirmed as of Thursday’s close at 2331. Year-over-year, ’tis the ninth such downside crossover. For the prior eight, the average negative penetration within one month is -65 points, (the median being -56 points). Thus in that vacuum alone, we’d see Gold 2275-2266 over the near term. ‘Course, rarely is “average” reality: there is pricing congestion for Gold from 2364-2285 to at least initially limit any truly material downside from here (2335). Still, we’re again placing for perspective purposes the underlying structural support zone of 2247-2171 on Gold’s weekly bars graphic — the crybabies notwithstanding — from one year ago-to-date. (Note at lower-right an Investing Age of Stoopid intruder…):
“Yeah, it snuck right past me, mmb“
Well, Squire, they’ll do anything and everything to convince you to dump Gold for “GameFlop” (GME, p/e 950x). But true to ongoing form, such Investing Age of Stoopid continues to run its inevitably-ending course, the “live” price/earnings ratio of the S&P 500 (aka “Casino 500”) now 39.4x and yield 1.380% versus the U.S. annualized three-month rate of 5.245%. The S&P’s market-capitalization is now $46.3T supported by a liquid U.S. Money Supply (M2) of only $21.3T. ‘Course when you WestPalmBeachers are sufficiently shaken to sell along with the rest of the herd, your brokers shall all be good for the money, right? (Recall, too, the ten stock market crash catalysts itemized in Gold Update no. 712 from last 08 July: today, all ten remain firmly bona fide).
Speaking of crash catalysts, we’ve some good news as regards the StateSide economy. Incoming metrics this past week for the Economic Barometer were so sparse (just five inputs), that it suffered limited additional damage. Next week is again rather light as well with just nine metrics due, notably including the Fed-favoured inflation gauge of Personal Consumption Expenditures for April which is not expected to have slowed from March’s annualized pace of +3.6%. But net-net by consensus, the Baro looks to be lower still in a week’s time as stagflation creeps ‘cross the nation:
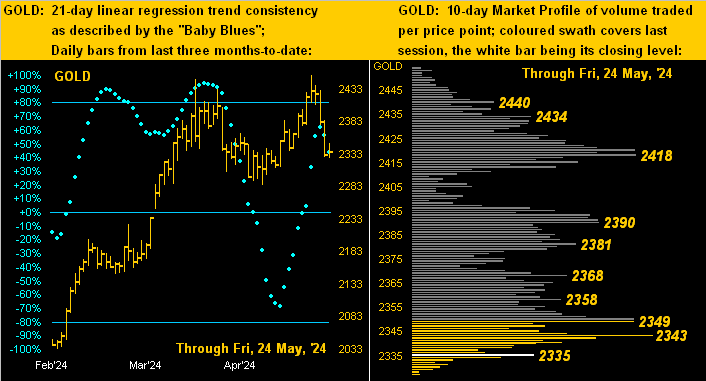
Hardly was Gold’s decline this past week at a crawl. The yellow metal’s net two-day drop (from Tuesday’s settle at 2425 to that for Thursday at 2331) was -94 points: that ranks ninth-worst by points for any two-day span century-to date; (the like -3.9% drop has been worse on many two-day occasions, the most extreme being -13.3% in mid-April 2013). Still, the week’s fallout was enough to drive price from nearly the top of its 10-day Market Profile toward the bottom per the below right hand panel. The left-hand panel of Gold’s daily bars from three months ago-to-date depicts the baby blue dots of trend consistency having just turned lower. Again as aforementioned, the 2364-2285 area is price-congestive, and thus for now, supportive:
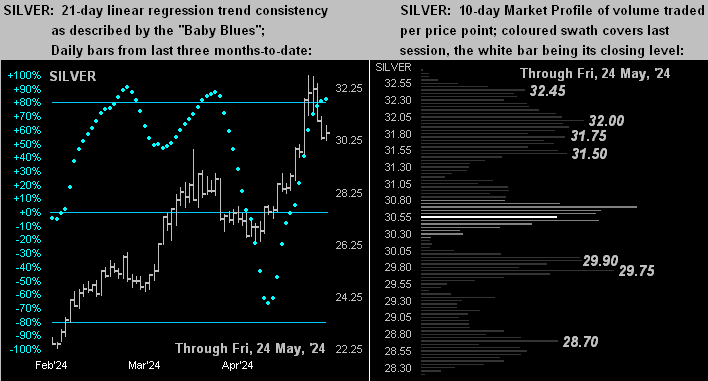
As for Silver, her two-day (Tue-Thu) drop was -5.8%. But unlike Gold, hardly did she hoover her whole Market Profile, basically finishing in the center of that two-week stack (below right). Too, her “Baby Blues” have (yet) to lurch lower per the three-month stint (below left). Indeed ’tis heartening to see Silver Silver getting some degree of respect lately. Further, she remains quite cheap relative to Gold, even as the Gold/Silver ratio (as noted a week ago) has moved sub-80x. Today ’tis 76.5x … however the century-to-date average is 68.3x. So priced at that average with Gold at 2335 today, Silver would be +12% higher than her current 30.54 level at 34.21:
Our takeaway is: ‘twould be folly not to anticipate lower Gold prices near-term. In addition to price having just crossed beneath the aforeshown smooth valuation line, we’ve the following technical negatives: Gold’s daily Parabolics flipped from Long to Short effective yesterday’s open as did the MACD (moving average convergence divergence); the daily Price Oscillator is dwindling and the Moneyflow is nearing a cross from inflow to outflow.
Still, with prudent cash management always paramount — and acknowledging that “shorting Gold is a bad idea” — let’s wrap with the stack:
The Gold Stack
Gold’s Value per Dollar Debasement, (from our opening “Scoreboard”): 3769
Gold’s All-Time Intra-Day High: 2454 (20 May 2024)
2024’s High: 2454 (20 May 2024)
Gold’s All-Time Closing High: 2430 (20 May 2024)
10-Session “volume-weighted” average price magnet: 2385
Trading Resistance: various per the Profile from here at 2335 up to 2440
Gold Currently: 2335, (expected daily trading range [“EDTR”]: 38 points)
10-Session directional range: down to 2326 (from 2454) = -128 points or -5.2%
Trading Support: none per the Profile
The Weekly Parabolic Price to flip Short: 2263
Structural Support: 2247-2171
The 2000’s Triple-Top: 2089 (07 Aug ’20); 2079 (08 Mar’22); 2085 (04 May ’23)
The 300-Day Moving Average: 2046 and rising
2024’s Low: 1996 (14 February)
The Gateway to 2000: 1900+
The Final Frontier: 1800-1900
The Northern Front: 1800-1750
On Maneuvers: 1750-1579
The Floor: 1579-1466
Le Sous-sol: Sub-1466
The Support Shelf: 1454-1434
Base Camp: 1377
The 1360s Double-Top: 1369 in Apr ’18 preceded by 1362 in Sep ’17
Neverland: The Whiny 1290s
The Box: 1280-1240
‘Course the bottom line is, regardless of its marginal high but then habitual cry, don’t miss out when Gold goes to the sky!
Cheers!
…m…
www.TheGoldUpdate.com
www.deMeadville.com
and now on “X”: @deMeadvillePro
********

Mark Mead Baillie has had an extensive business career beginning in banking and financial services for two years with Banque Nationale de Paris to corporate research for three years at Barclays Bank and then for six years as an analyst and corporate lender with Société Générale.
For the last 22 years he has expanded his financial expertise by creating his own financial services company, de Meadville International, which comprehensively follows his BEGOS complex of markets (Bond/Euro/Gold/Oil/S&P) and the trading of the futures therein. He is recognized within the financial community of demonstrating creative technical skills that surpass industry standards toward making highly informed market assessments and his work is featured in Merrill Lynch Wealth Management client presentations. He has adapted such skills into becoming the popular author each week of the prolific “The Gold Update” and is known in the financial website community as “mmb” and “deMeadville”.
Mr. Baillie holds a BS in Business from the University of Southern California and an MBA in Finance from Golden Gate University.


