Gold’s Triangle Formation: What Is Next?


Gold is inside a long-term Bull market. But recently, gold has formed a Parabolic rise. The problem for gold bugs is Parabolic rallies usually do not end well. The Parabolic rise has paused by forming a Triangle pattern. With gold down almost 10 percent, more could be coming over the short-run. It depends upon one of two possible outcomes from the conclusion of this triangle.
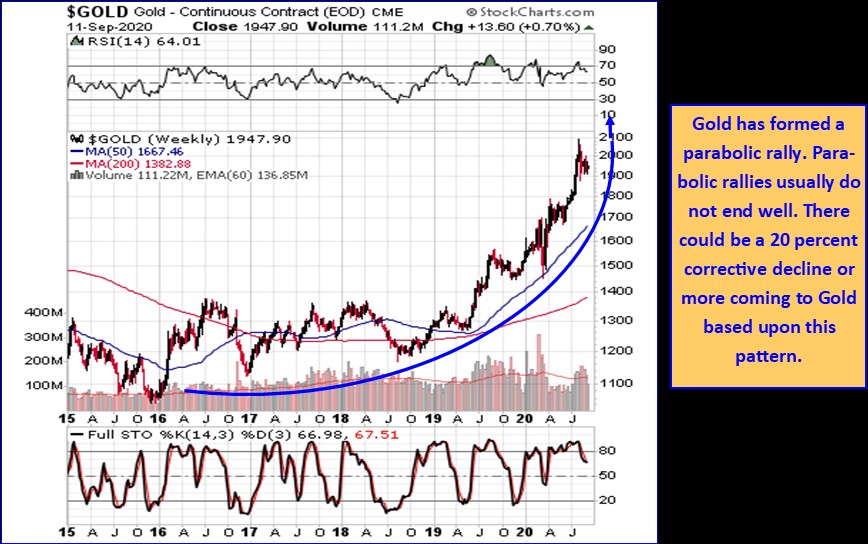
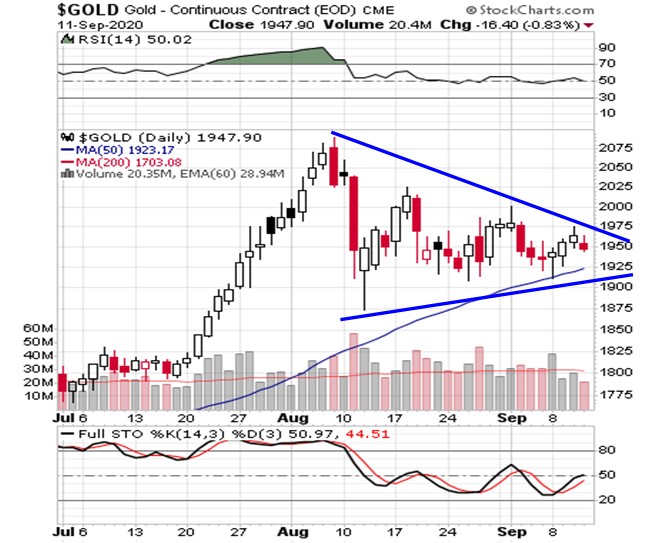
In the study of how markets move based upon Elliott Wave patterns, rising trends typically progress in waves 1-up, 2-down, 3-up, 4-down, and 5 up. Corrective moves within a larger degree trend are typically a-down, b-up (or sideways triangles) and c-down. Triangles almost always appear as either wave fours (which can be labeled d waves) or wave b’s. They are continuation patterns. So, given the obvious triangle pattern since early August, shown above for gold, the question becomes, is this a wave 4 (wave d in this case) sideways move within wave (1) up, or is this a wave B sideways move within wave (2) down? It matters for several reasons.
If wave 4 or d, it means the triangle pattern is nearly complete, and Gold is about to continue its parabolic rally and explode higher in the final wave e up of 5-up move for this rising progression to complete primary degree (1).
If wave B, and we will show how this is possible, it means next will be a fairly strong short-term decline in gold, wave C-down of primary degree wave (2) down.
So let’s explore.
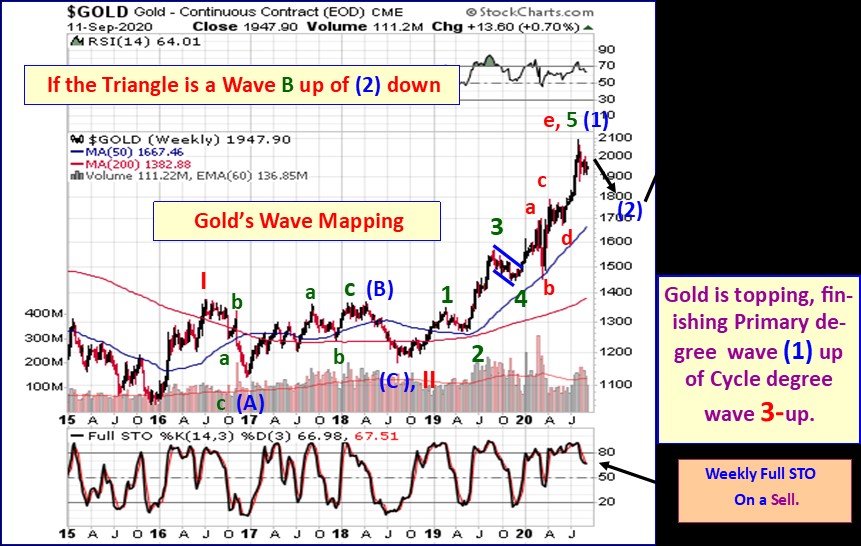
Above we show the larger degree perspective if gold is inside corrective primary degree wave (2) down. If this is the case, then gold’s triangle is sideways wave B-up of an A-down, B-up, C-down move for Primary degree wave (2) down.
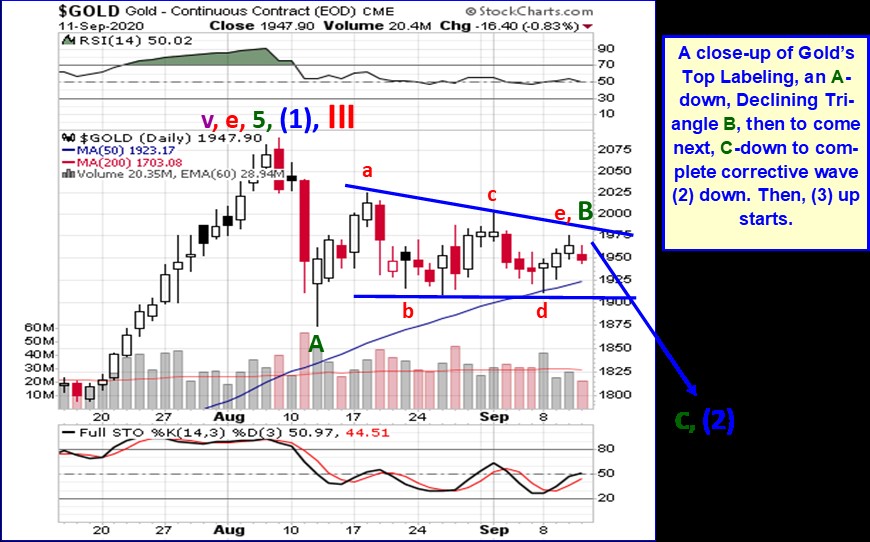
The next chart below shows a close-up of the pattern for the Triangle wave B scenario. In this case, the triangle is finished and will lead to a downside break. This triangle has formed as a Descending Triangle, which usually sees a breakout to the downside. Also in this scenario, the mapping has a more perfect triangle, as all five touch points connect perfectly to the upper and lower triangle boundary lines.
Now let’s look at the scenario where the triangle is merely a fourth subwave d-down move, which would be followed by an upward breakout.
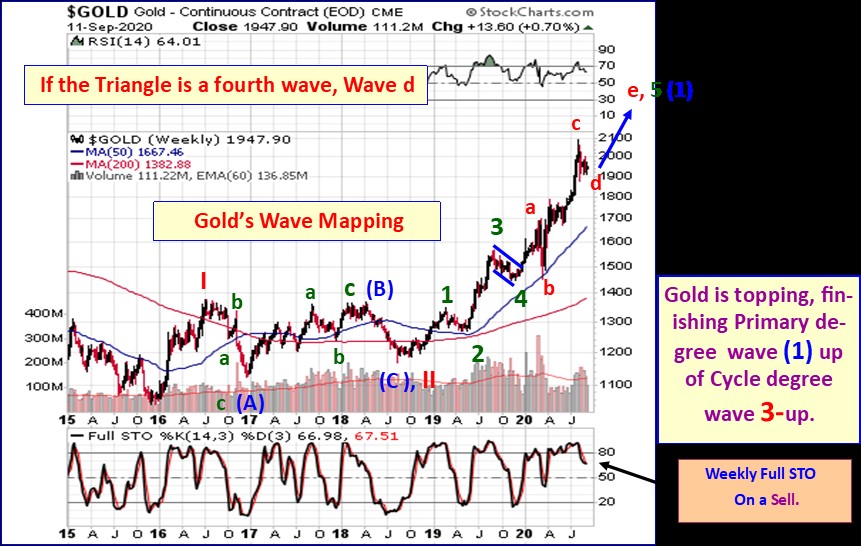
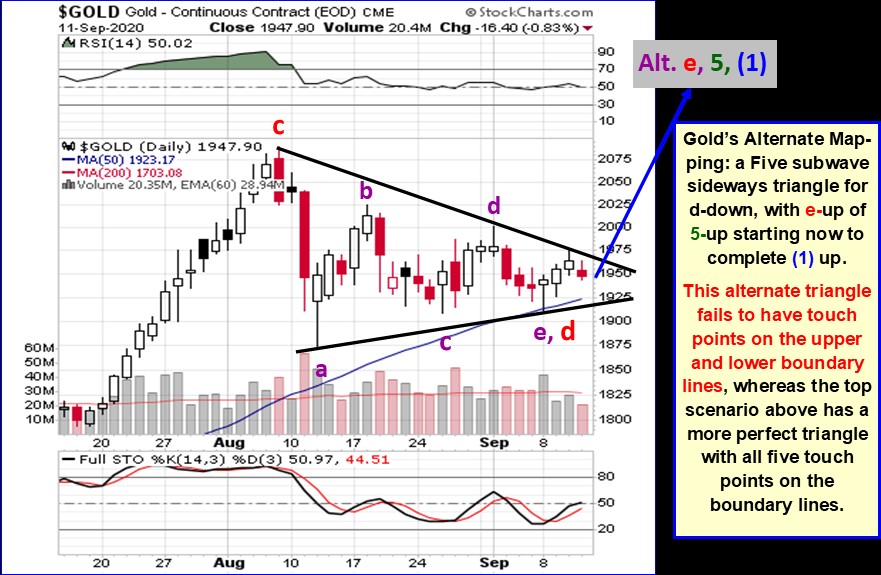
In this case, the sideways triangle is wave d-down, and next is a breakout from the triangle to the upside, wave e-up of 5-up to complete (1) up. One concern with this scenario is that not all the touch points for the triangle reach the upper and lower boundaries of the drawn triangle. Subwaves b-up and c-down fail to touch the boundary lines. This increases the odds slightly that the first mapping is the correct one, and gold could need another down leg before starting its next rally leg up.
In either case, we should know soon which direction gold plans to take in the short-run, and the move could be strong. An initial breakout above or below the triangle borders will tell us the direction.
Also, in either case, the overarching large degree trend remains up for gold, and we can expect significantly higher prices over the intermediate and long-term.
---
At McHugh’s www.technicalindicatorindex.com we track the short-term waves that make up these larger degree trends, and chart them in our forecast newsletters, and have developed several proprietary Buy/Sell indicators that help us identify when the next significant move is starting for Gold, Silver and Mining stocks, and in which direction the move will develop. We publish these indicators in every Daily Newsletter to subscribers.
********
More from Gold-Eagle


