Gold’s Ultimate Confirmation


Although it didn’t appear to be a breakdown, silver just closed the day (and week) at a new yearly low. Remember the day when silver moved briefly below $14? Ultimately, silver futures closed at $14.15 on that day, and they just closed at $14.14 on Friday. So little, yet so much. Breakdown confirmed by weekly closes is something very significant and yet, it’s not the most important thing that we will comment on in today’s analysis. The key details will come from the gold market. Let’s move right to it (charts courtesy of http://stockcharts.com).
Gold moved back and forth lately as it’s been consolidating after the recent sharp decline that took gold to the medium-term support levels (even a bit below some of them) and the declining thin black support line (based on the previous lows).
The yellow metal moved close to its 50-day moving average (staying below it) and it’s still far from the declining black resistance line, which suggests that the trend remains down and that everything that we saw recently is just a pause within a bigger decline.
The RSI indicator was very oversold on a short-term basis during the recent volatile bottoming pattern, but it recovered since that time, and it recently even moved above 50, thus indicating that the situation is far from being very oversold on a short-term basis.
The Stochastic indicator already confirmed that the major short-term top is already in - and we just saw another move lower in it, after it moved above the middle of its trading range.
Moreover, gold already broke below the consolidation pattern marked with dashed lines and even though it moved very briefly back into the pattern, it closed the last two sessions visibly below it.
Some will say that what we’re seeing is just a prolonged bottoming pattern - and what we have now is the first post-bottom pause. But we disagree. Based on multiple other factors, including severe underperformance of gold stocks, the gold price projection remains strongly bearish. The yellow metal appears ready to decline once again.
But, we don’t have to convince you that the above is the case. The odds are that you already convinced yourself, without realizing it.
What has been will be again,
what has been done will be done again;
there is nothing new under the sun.
- Ecclesiastes 1:9-10
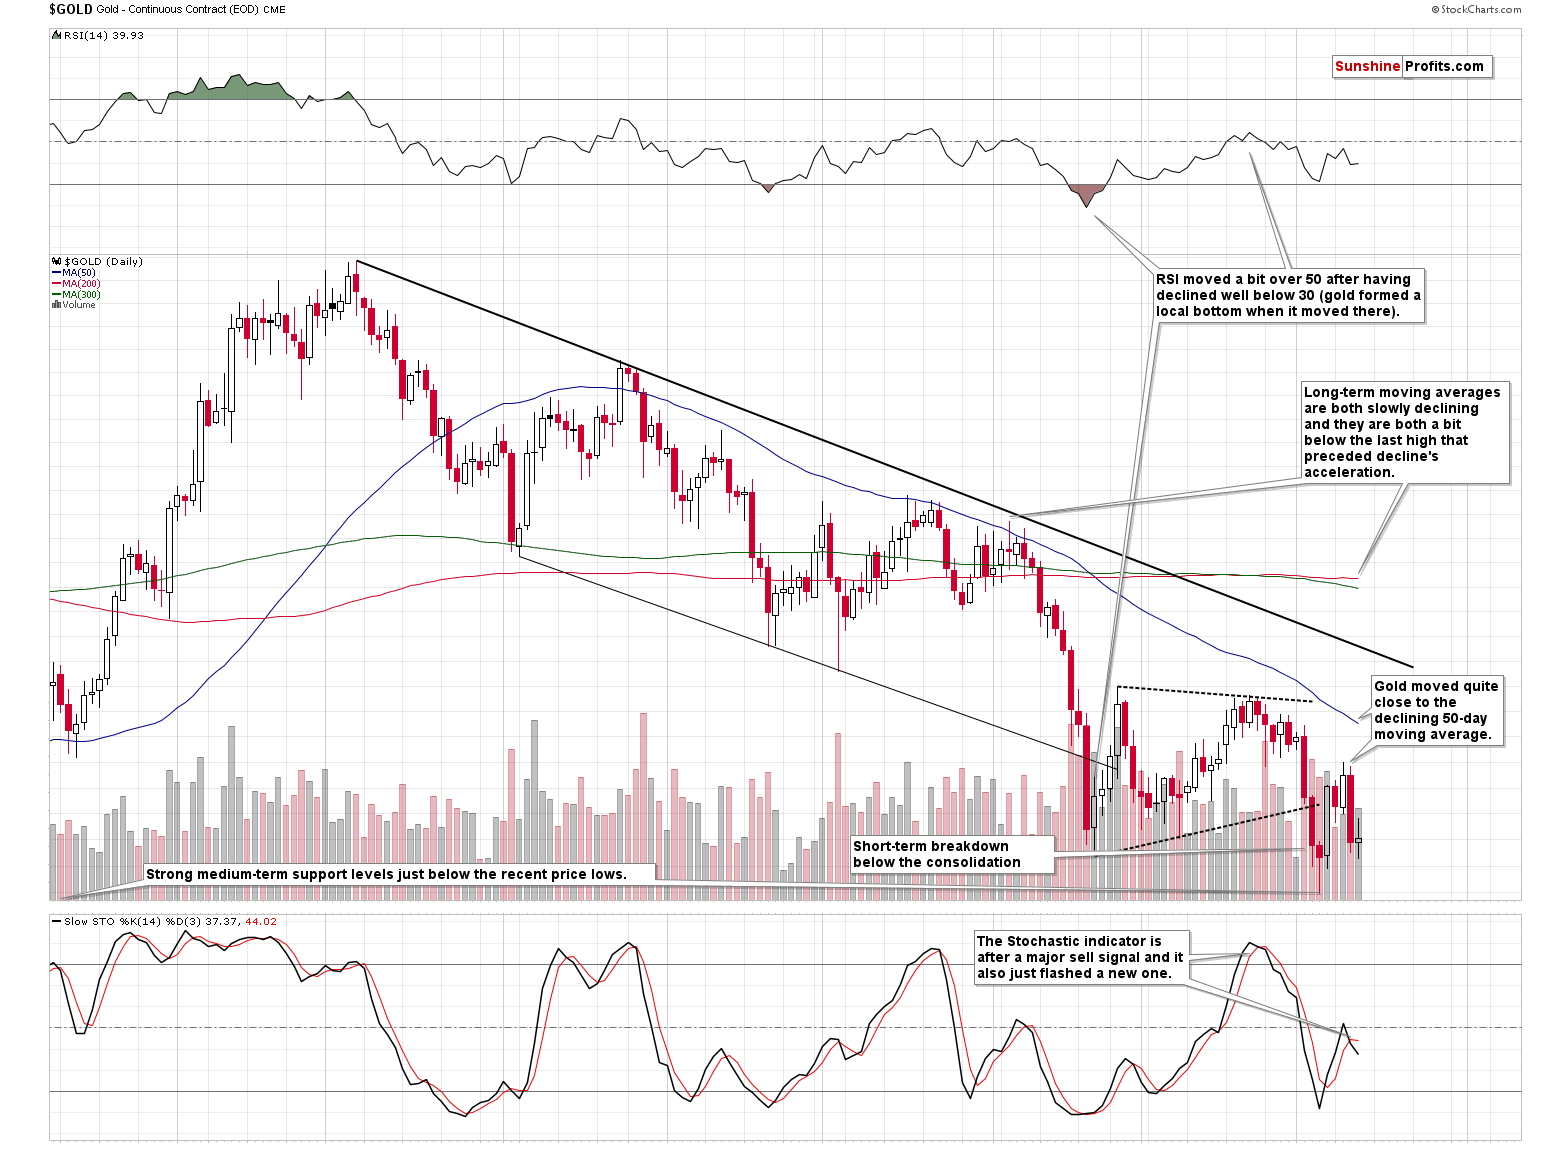
Did you notice the dates and price levels on the above chart?
You didn’t notice them, as they are not there, and the reason they are not there is that we wanted you to focus on the shape of the price movement and many other factors. The above chart does not feature the current price of gold.
Everything that we wrote above is true and correctly describes the current situation on the gold market, but… It features a different period from the past. Here’s what the current gold chart looks like:
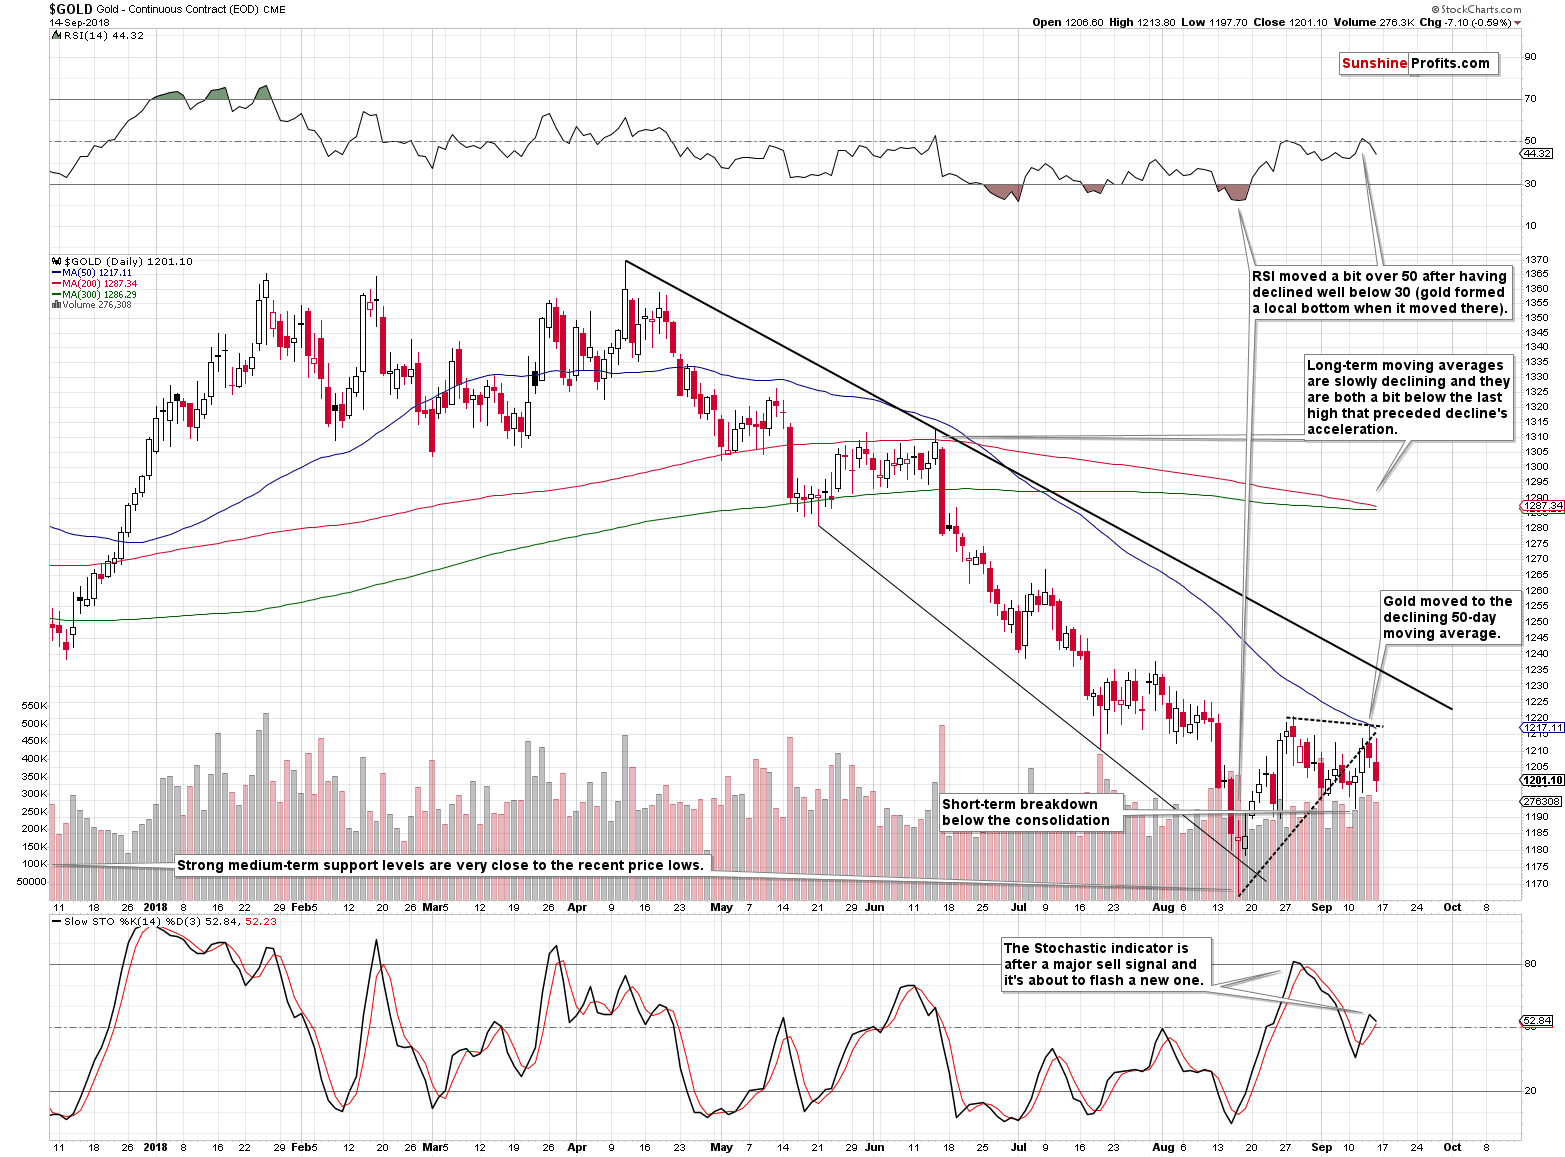
Please re-read everything that we wrote on the previous gold chart. It all applies to the current gold chart as well. Everything. Not just the position of indicators, proximity to the support and resistance lines, situation regarding the consolidation pattern, and the 50- a day moving average. Even the 200-, and 300- a day moving averages (marked with red and green) are slowly declining and are just below the local top after which the decline accelerated.
Shocking, isn’t it?
The more similar a given price pattern is, the stronger the implications are. And while it’s usually best to have multiple patterns that are similar to the current one that are followed by the same outcome, this doesn’t seem necessary right now. The similarity is simply so big that even the single case can make a certain outcome very, very likely.
The million (billion?) dollar question is what kind of action followed the still-unknown self-similar pattern in gold in the past.
And… We’ll leave it up to you to find the final piece of this puzzle. The final hint is that it was not more in the past than 10 years ago. The implications are bearish, but in order to find out just how bearish things can be, you’ll have to do some chart digging. Or perhaps you already know what the first chart represents? Maybe your friends would also enjoy this riddle? Please feel free to forward this article to them. If you want to check your answer and/or be 100% certain that the implications are really what you think, you can easily do so in our latest Gold & Silver Trading Alert that includes the full version of the above analysis. We are currently ending a promotional offer during which, you can access our Alerts for just $1 for the first week, and if you’re quick, you can still take advantage of it.
Przemyslaw Radomski, CFA
Founder, Editor-in-chief, Gold & Silver Fund Manager
Sunshine Profits - Gold & Silver Investment
* * * * *
All essays, research and information found above represent analyses and opinions of Przemyslaw Radomski, CFA and Sunshine Profits' associates only. As such, it may prove wrong and be a subject to change without notice. Opinions and analyses were based on data available to authors of respective essays at the time of writing. Although the information provided above is based on careful research and sources that are believed to be accurate, Przemyslaw Radomski, CFA and his associates do not guarantee the accuracy or thoroughness of the data or information reported. The opinions published above are neither an offer nor a recommendation to purchase or sell any securities. Mr. Radomski is not a Registered Securities Advisor. By reading Przemyslaw Radomski's, CFA reports you fully agree that he will not be held responsible or liable for any decisions you make regarding any information provided in these reports. Investing, trading and speculation in any financial markets may involve high risk of loss. Przemyslaw Radomski, CFA, Sunshine Profits' employees and affiliates as well as members of their families may have a short or long position in any securities, including those mentioned in any of the reports or essays, and may make additional purchases and/or sales of those securities without notice.
 Przemyslaw Radomski, CFA, is the founder, owner and the main editor of SunshineProfits.com. You can reach Przemyslaw at: http://www.sunshineprofits.com/help/contact-us/.


