Gold $1000 Quest
 share
share
 share
share
 share
share
 share
share
 share
share
Big round numbers are irresistibly alluring. There is some kind of psychological gravity about them that captures people's attention. Remember when the Dow 30 first breached 10k (March 1999) or oil first exceeded $100 (February 2008)? These were majorfinancial-media events that spilled widely into the mainstream consciousness.
I suspect the next great big round number to be achieved will be $1000 gold. While gold did indeed close slightly above $1000 for two days in March 2008, it has never been able to sustain this key psychological milestone. Even at the climax of its late 1970s bubble in January 1980, gold only hit $850 in nominal terms (about $2300 in today's dollars). Gold's quest for $1000 has proven exceedingly elusive.
With this tantalizing target perpetually eluding gold, why is it finally within reach now? A powerfully bullish convergence of fundamentals, technicals, and sentiment has rendered it all but a fait accompli. Gold's fundamentals, declining worldwide mine production in the face of growing global investment demand, are the primary reason why gold will soon exceed $1000. I wrote a comprehensive essay analyzing the bullish gold fundamentalslate last year if you'd like to get up to speed on them.
Today I want to focus on the technical and sentimental aspects of gold's quest for $1000. While fundamentals can give us a rough idea of which way a price should move on balance (up) and for how long (many years), they are too abstract to offer much insight on trade timing. That's where technicals and sentiment come in. And they are suggesting gold $1000 will be decisively breached soon, probably within months and almost certainly before 2009 gives up its ghost.
Given gold's troubled history around $1000, a technical wasteland where rallies die violently, I realize it seems foolhardy to most traders to expect sustained $1000+ gold anytime soon. Yet I think if you compare gold's technicals today with its technicals at previous $1000 attempts, the bullish case for a near-term decisive $1000 breakout is very compelling. Walk through the charts with me and then decide yourself.
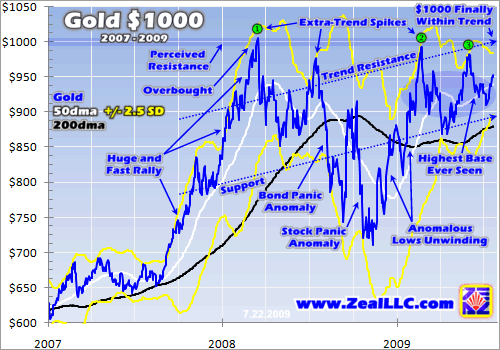
Despite the feeling that gold has been struggling with $1000 forever, this quest is actually pretty new. March 2008, just 16 months ago, marked the first-ever $1000 attempt. Since then there have been two subsequent attempts in 2009, both unsuccessful. But for a variety of technical reasons (which help drive sentiment), each subsequent attempt has a higher probability of finally breaking the $1000 shackles.
The first attempt at $1000 had its roots back in August 2007. Gold had spent much of that year consolidating between $650 and $700, and by mid-August it was again languishing near $652. At the time, most traders were very bearish on gold. Its highs were drifting lower and calls abounded for a steep washout selloff. But this excessive bearishness proved to be fertile soil from which the biggest gold upleg of this entire secular bull emerged.
Gold initially shot to $835 by early November, a stellar 28% gain in less than 3 months. Then it consolidated around $800 for about 6 weeks, before heading off to the races again in late December. On the first trading day of 2008, it closed at $857 to achieve a new all-time nominal high. This garnered widespread media coverage and got many new investors excited about deploying in gold, an important precedent for the coming $1000 breakout.
Gold continued surging on balance, rarely looking back after blasting through its January 1980 high. By March 2008, gold briefly climbed over $1000 for the first time ever. But its $1005 close had the misfortune of happening the day before Bernanke's Fed cut interest rates by 75 basis points instead of the expected 100bp. This took pressure off the US dollar and sparked a sharp commodities selloff. Over the next 3 days after the Fed's "moderation", gold plunged 9.3% and hopes for $1000+ were quickly crushed.
But the circumstances of gold being repelled at $1000 on its first attempt aren't anywhere near as relevant as the rally leading up to it. Between August 2007 and March 2008, gold had rocketed 54% higher! This was a stupendously big and fast move dwarfing anything that came before it in this bull. It works out to a 0.4% per day average gain. Yet in gold's entire secular bull before this, since April 2001, its average daily gain had only been 0.1%. After such an epic run to $1000, traders were understandably wary.
Less than a year earlier, they had perceived $650 to $700 as being "normal" for the gold price. So $1000 then looked way overbought to almost everyone, even many hardcore gold bulls. In addition, as you can see above, $1000 was way above gold's uptrend's resistance. It is tough, if not impossible, to sustain new highs in such a scenario. After any abnormally large rally to new highs, backing and filling is necessary to gradually get traders comfortable with the new prevailing levels.
This high consolidation after a huge and fast rally helps redefine norms for a price. There is a tug-of-war between sellers and buyers as everyone is trying to understand whether what once seemed like crazy-high levels are now sustainable. The longer a price consolidates high, the more traders come to accept these levels as the new norm. In gold's case, it consolidated around $900 for several months after this first $1000 attempt. Going from a $675 base a year earlier to $900 was a big jump.
But traders soon acclimated to the new higher prevailing gold levels. In July 2008 as commodities prices surged to record highs, gold caught a bid and was driven over $975. But this extra-trend spike fizzled out before it became a full-blown $1000 attempt. It didn't come within 2% of $1000. Commodities were correcting and gold started plunging in the bond panic anomaly preceding the stock panic.
A year ago this month, there was a panic in the bond markets as the massive US GSEs (Fannie and Freddie) backing mortgages were on the verge of bankruptcy. Big foreign investors rushed to sell bonds and bought US dollars (to buy US Treasuries), kicking off the biggest and fastest US dollar rally ever witnessed over such a short span of time. The result was gold got crushed, first by the bond panic and then by the stock panic. I wrote about this crazy episode in depth in October and May if you want some more background on its gold impact.
These back-to-back panic anomalies were the result of pure fear, not fundamental weakness in gold. So once the fear bubble started abating in stocks, gold started climbing back up into its trend. The first true stock panic in 101 years must be viewed as an anomaly in commodities including gold. The hyper-fearful sentiment spilled over from the stock panic, but soon after that gold's anomalous lows quickly unwound. Realize the sole reason a second $1000 attempt didn't happen sooner was this panic.
Between mid-November at its panic low to late February, gold again blasted 40% higher. Not only was this a huge move, but it was also very fast. It averaged 0.6% per day, 6x this gold bull's average pace prior to August 2007! The lion's share of this spike was driven by heavy GLD gold ETF buying by stock investors, and it was enough to carry gold to $992 by late February. But again external factors short-circuited gold's ascent before $1000 could be breached.
The stock markets were slumping into despair in late February, spawning fears of a renewed panic. Washington, instead of helping investors, was targeting us for radically higher taxes, suffocating new regulations, new government bailouts of bad players who should fail, and much other anti-free-market pro-socialism nonsense that sapped confidence. So investors again fled all markets, including gold.
But regardless of the reasons it failed, again the most relevant aspect of this second attempt is where gold came from technically. It had rallied hundreds of dollars an ounce in a very short period of time. It looked overbought on a short-term basis at $1000 and it was above trend. Extra-trend spikes seldom lead to sustainable highs because a price is naturally so overextended after such a move.
But since that second attempt, several remarkable things have happened. First, gold didn't collapse after it. Instead it consolidated high, averaging $927 since February in its highest base ever witnessed. Second, gold actually made a third attempt at $1000 in early June. The time between $1000 attempts compressed dramatically. This is the natural result of gold's uptrend inexorably pushing it ever closer to $1000. The rising support line, sans panic anomaly, clearly shows this trend.
And $1000 gold is finally within trend! This is a really big deal. The great majority of investors and speculators use technicals, they consider recent price action within chart context before making buy and sell decisions. And a price within trend, no matter how psychologically significant it is, is always more comfortable than a price out of trend. Traders are not likely to sell until resistance is hit, and now that $1000 is finally under resistance the odds of it being decisively breached have never been higher.
Provocatively these technicals are fractal in nature, they appear similar and work similarly at many different scales. The first gold chart above looked at gold's technicals over years, showing gold getting ever closer to breaking above $1000. Interestingly, if we zoom into each of these 3 previous attempts on multi-month charts, the same phenomena become apparent at this scale too. Until now, $1000 was always overextended and above trend.
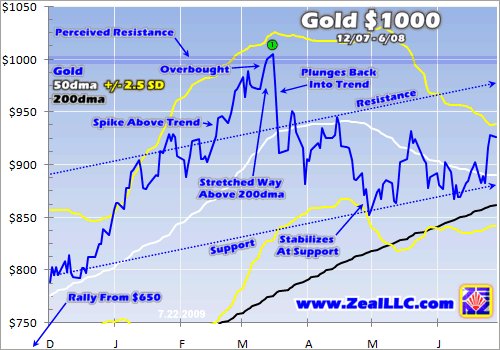
Gold's initial March 2008 attempt at $1000 was well above its short-term uptrend. $1000 was a technically uncomfortable place then, too far outside of normal price levels at the time and hence likely to spark technical selling. Even without the Fed's surprise decision that hammered commodities the day after gold peaked, gold was just too far above its uptrend's resistance and 200-day moving average then to sustain $1000.
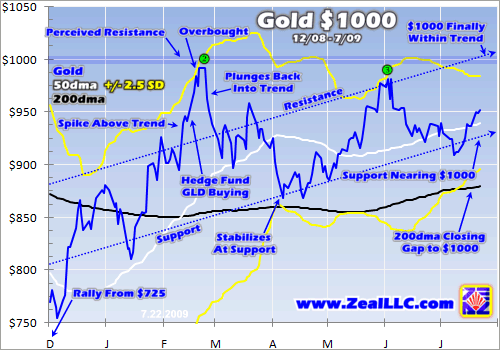
Gold's second attempt at $1000 almost a year later in February 2009 looked similar on short-term charts. It was a spike well above trend driven by heavy hedge-fund buying in GLD. But after soaring 22% higher in just 5 weeks, a staggering average rate of ascent of 0.9% per day (9x this bull's average), there is just no doubt that gold was looking overbought on a short-term basis. And indeed it soon plunged back into trend.
The third attempt in early June was much less extreme. Gold simply did not rally as far (just 13%) or as fast (6 weeks or 0.4% per day on average) as it had in its first and second attempts. And not surprisingly given this more modest ascent, gold's post-attempt pullback was much milder in recent weeks. Since it wasn't overbought, and since it remained within trend, there were no technical reasons for traders to sell aggressively so gold just modestly drifted lower.
And now, just like in the first multi-year chart, $1000 gold is finally within trend for the first time ever! Gold's next $1000 attempt will not require an unsustainably big or fast rally nor will it carry gold into technically overbought territory. Because of this, and all the time gold has been spending up in the $900s basing this year, traders are not going to consider $1000 excessive like they did in previous attempts. Gold's short-term support is also nearing $1000, corralling gold ever closer to its decisive breakout.
I realize plenty of folks (but almost never speculators) discount all this technical chart stuff as nonsensical mysticism, totally irrelevant. But they are mistaken. It is sentiment (greed and fear), not fundamentals, that drives short-term price movements. And overboughtness and oversoldness creates this sentiment. And these states are only recognizable in price context, and this context is best provided by price charts. Recent price action drives sentiment, and even financial news, influencing most trading decisions.
So if you are skeptical on the incredible importance of $1000 finally being within multi-year and multi-month trends for the first time ever, carefully consider a real case study from earlier in this gold bull. It centers on gold denominated in euros. For years, gold attempted to break above the critical level of €350. And for years it failed. So €350 became a huge psychological hang-up for European gold investors. It was their equivalent of $1000 in the States today, a pivotal level that seemed impossible to breach.
I was writing many essays in the early 2000s telling investors to buy gold and gold stocks to ride the then-new-and-unknown secular gold bull. Invariably after an essay was published, European investors would e-mail me and claim that what we saw as a gold bull in the States was merely a US dollar bear. They were partially right of course, gold was rising much faster in the States than elsewhere as the dollar slumped relentlessly. But it still truly was a global gold bull even then.
I'd always ask the Europeans to not only consider the extra-trend extremes, but the preponderance of the trend. It is the center-mass of the trend that matters, not fleeting outlying spikes or slumps. I pointed out to them that euro gold's secular support was well-defined and rising, and it was driving euro gold ever closer to €350. I not only advised them that the €350 breakout was inevitable, but that it would spark huge new investment demand and usher in Stage Two of this gold bull where global investment demand, not the falling dollar, drove gold higher worldwide.
This next chart is a new update of one I ran in a euro gold €350 essay in June 2005when the breakout was finally starting. The analogies between the long quest for €350 and today's quest for $1000 are quite compelling. The €350 breakout that kicked off the current stage of our gold bull eluded investors for years, but finally happened the very first time that €350 was within trend and not overextended.
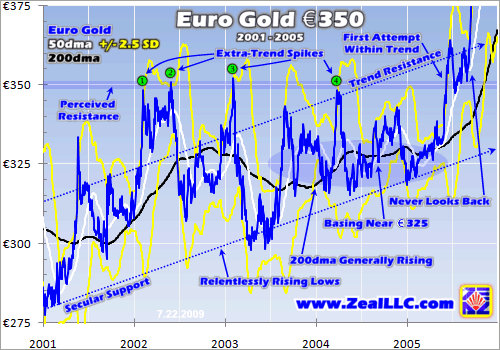
Euro gold first tried for €350 in early February 2002. But this was a big extra-trend spike, not only well above trend resistance but after a blisteringly-fast rally. Euro gold actually consolidated high after this, making a second attempt in May 2002. But these levels were too new to traders, euro gold was just too overbought, so speculators wouldn't chase euro gold higher. The psychology for a breakout wasn't there.
The third attempt happened a year after the first in February 2003. But it was again a sharp extra-trend spike well above resistance. It soon collapsed and headed all the way back down to trend support, much like we saw dollar gold do after its second attempt at $1000 in February 2009. After this third failed euro gold €350 attempt, European investors were really discouraged. They figured €350 would never fall, that European central banks would sell enough gold to cap the metal under 350 euros per ounce.
The fourth attempt was over a year later in March 2004. But €350 was still above euro gold's secular uptrend's resistance, and the metal had surged sharply to get there. Traders weren't comfortable enough that €350 was sustainable to deploy additional long positions above resistance at a level that had been a graveyard in the sky for years. European gold investors' discouragement naturally deepened.
But by late 2004, euro gold's uptrend had finally climbed over the vexing perceived resistance at €350. And interestingly, the very first time that euro gold went over €350after it was finally within trend, the long-awaited breakout happened! That was June 2005. And this breakout wasn't feeble, once it finally happened euro gold never looked back. So far in 2009 euro gold has averaged €684, nearly twice the level of its initial breakout that seemed so impossible for so many years!
This comparison's strategic parallels to $1000 today are very compelling. €350 failed for years and seemed insurmountable, just like $1000. But gradually gold was basing at higher and higher levels as its bull's support drove it inexorably higher. And when €350 was finally within the uptrend instead of being overextended and requiring overbought sentiment to get it there, gold easily punched through. We'll probably see a similar thing happen with $1000 soon.
The most important benefit of the €350 breakout was its catalytic nature. The great majority of foreign investors had not yet been interested in gold, but once €350 was exceeded the coverage captured their attention. Foreign gold investment surged dramatically, pushing gold into its global Stage Two bull. After breaking above €350, euro gold didn't take a breather until it exceeded €550 almost a year later! I suspect $1000 will have a similar catalytic effect on American investors today.
Despite gold nearly quadrupling since early 2001, it largely remains the realm of contrarians. Most mainstreamers have zero gold exposure in their portfolios, they haven't even thought about owning gold yet. But when $1000 decisively falls, the coverage of this event in the financial and mainstream media will probably be extensive. Nothing attracts in new investment like major new psychological highs, and $1000 gold sure is a big one. It will probably unleash a deluge of new gold investment, driving this metal rapidly higher.
Remember that oil didn't collapse once it broke above $100, but powered on to $145 within 5 months. And without the stock panic last year, I suspect it would still be over $100 today. Investors chase performance, and a breakout above a big psychological round number really catches their attention. All kinds of capital flocks in to ride the momentum that is suddenly obvious to everyone.
At Zeal we've been riding this gold bull in elite gold stocks since its very beginning in April 2001. And since the stock panic, we've been gradually layering in positions that have already rallied nicely. But it isn't too late to buy. Once $1000 is broken, and technicals suggest it will be soon, there will likely be a rush to buy elite gold stocks. You can subscribe to our acclaimed monthly newsletter today, see which gold stocks we are buying (and when and why), and position your own portfolio to soar in the inevitable $1000 breakout.
The bottom line is gold's quest for $1000 is nearing fulfillment. Not only are its fundamentals very bullish (including big inflation coming), but for the first time ever its technicals support such a move. $1000 is no longer overextended or overbought, but actually within multi-year and multi-month trends. It won't require much buying by traders to push it over $1000 now, and $1000 won't feel excessive given gold's high base.
And gold $1000 is not just a curiosity, but a potential major driver of large new investment demand. Big round numbers are widely reported, which drives interest among a far greater population of investors. $1000 could even prove, in retrospect, to be the point when gold investment started growing desirable among average mainstream investors. It is a critical psychological milestone with very bullish implications.
Adam Hamilton, CPA
So how can you profit from this information? We publish an acclaimed monthly newsletter, Zeal Intelligence, that details exactly what we are doing in terms of actual stock and options trading based on all the lessons we have learned in our market research. Please consider joining us each month for tactical trading details and more in our premium Zeal Intelligence service at … www.zealllc.com/subscribe.htm
Questions for Adam? I would be more than happy to address them through my private consulting business. Please visit www.zealllc.com/adam.htm for more information.
Thoughts, comments, or flames? Fire away at [email protected]. Due to my staggering and perpetually increasing e-mail load, I regret that I am not able to respond to comments personally. I will read all messages though and really appreciate your feedback!
Copyright 2000 - 2009 Zeal Research (www.ZealLLC.com)
share
share
share
share
share


