Gold $2000. Only a Matter of Time
 share
share
 share
share
 share
share
 share
share
 share
share
Gold so far has seen a very good start into the new year. Driven by an extremely tense geopolitical situation (Cold War 2.0) as well as a weaker US-Dollar and the threat of U.S. insolvency (“debt ceiling”), the price of gold was able to increase by around 110 USD or 6% to 1,937 USD. Furthermore, since the triple bottom at 1,615 USD, gold recovered significantly by almost 330 U.S. dollars or 20% in the last two and a half months! Gold $2000. Its only a matter of time.
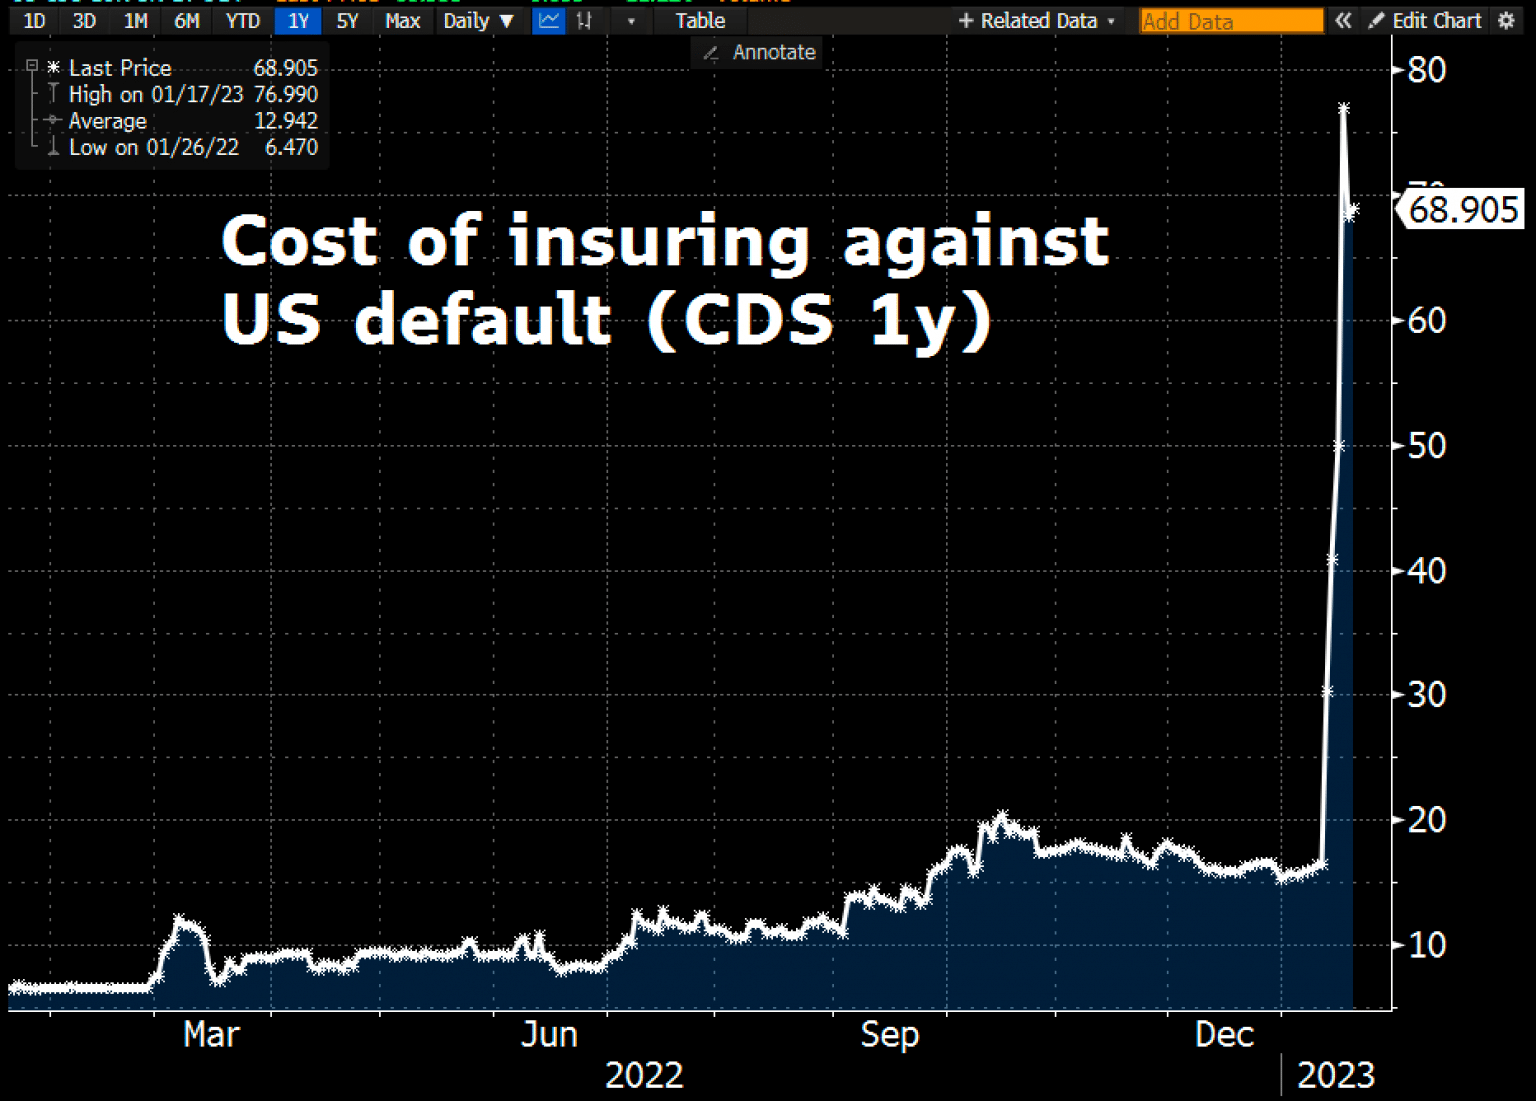
Insurance costs against U.S. default as of January 19th, 2023. ©Holger Zschäpitz
The main driver of the gold price rally for the past few days has been the surge in insurance costs against a default of the U.S.. The price for a 1-year credit default swaps (CDS) is now at 69 basis points. The last time the United States’ credit rating was downgraded from AAA to AA+ was on August 5th, 2011 and gold had seen a massive rally to new all-time highs in the weeks before.
De-dollarization gathers momentum
While China is skillfully pushing the de-dollarization of global trade flows through OPEC+, the BRICs and also by means of CBDCs, default is looming in the U.S. as Democrats and Republicans engage in a bitter dispute over the debt ceiling (currently 31.4 USD trillion). The absurd game in the U.S. Congress is actually nothing new and resurfaces every few years. In recent decades, however, disagreements over raising the debt ceiling have grown along with the size of the national debt.
Currently, growth in China is picking up, while it is slowing down in the United States. In particular, however, the growing trend to invoice oil and gas sales in renminbi is likely to have caused the US-Dollar to lose around 10% against the Chinese renminbi over the past two months. Saudi Arabia also unequivocally demonstrated its new geopolitical partnership with China back in December.
As soon as the so-called U.S. debt limit is reached (“debt ceiling”), the U.S. government may no longer borrow. It would then probably run out of money at the beginning of June. Only through extraordinary measures and accounting tricks could the U.S. Treasury then still guarantee the government’s solvency.
Market likely wants to see $2,000
The gold price naturally reacts positively to such a situation, and it seems as if the market, following the seasonal pattern, still wants to see the round psychological mark of 2,000 US-Dollars in the coming weeks. A continued rally towards the all-time high around 2,075 US-Dollars also seems possible until early spring. Finally, seasonality turns only from the end of February or mid-March. Hence, gold should probably reach the high of the current rally shortly before the start of spring and then typically should correct into early summer.
Gold in US-Dollars
Daily Chart – The round mark of 2,000 US-Dollar acts like a magnet
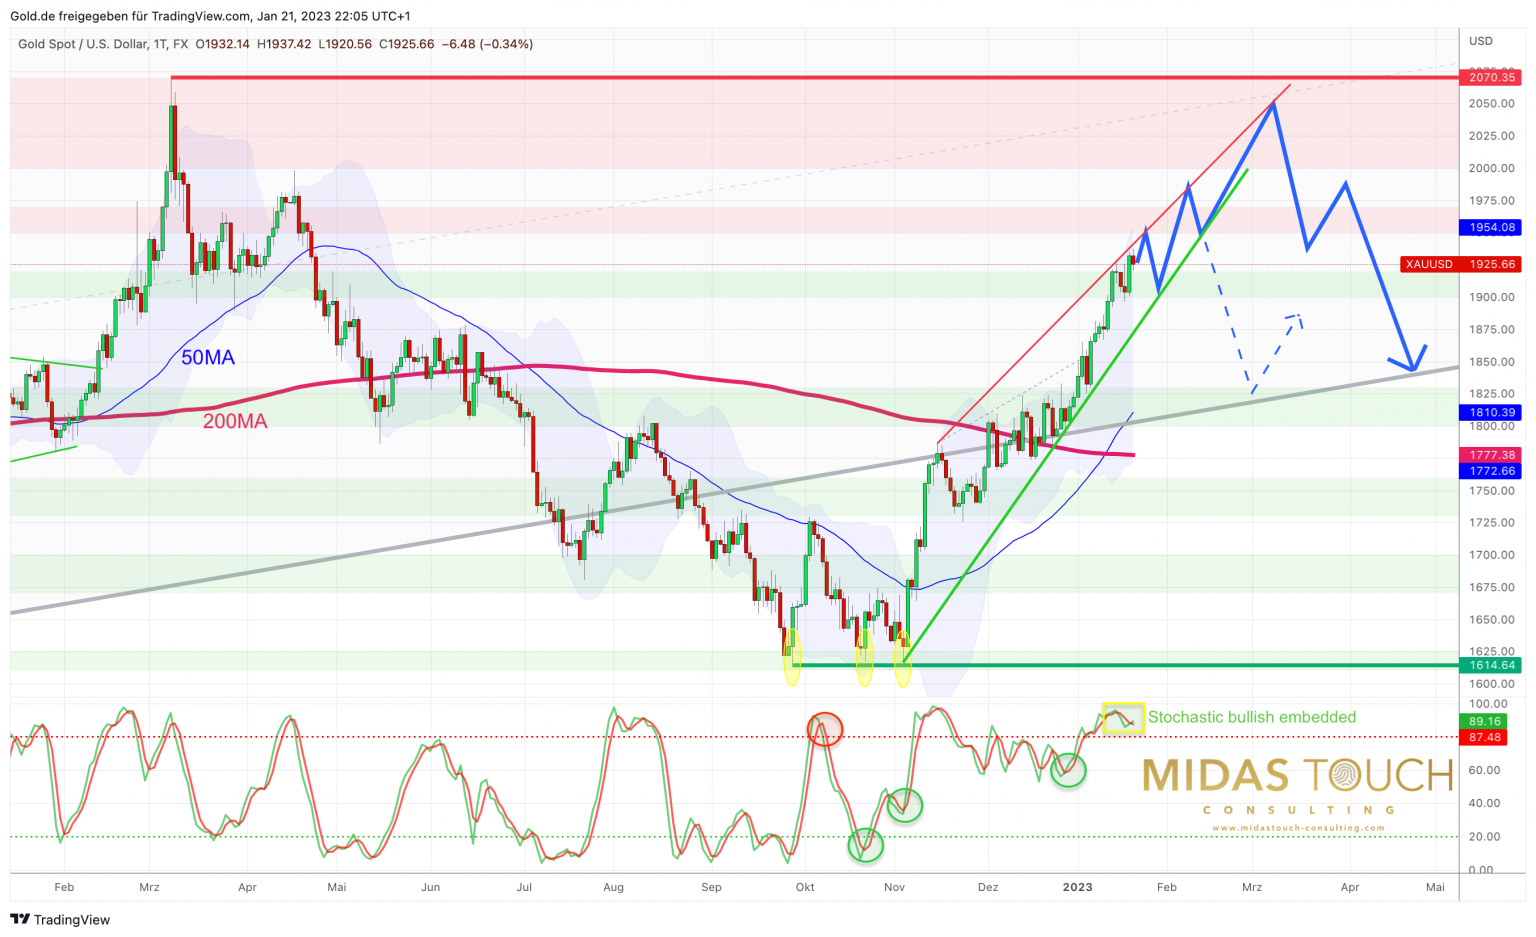
Gold in US-Dollar, daily chart as of January 21st, 2023. ©Midas Touch Consulting
Once gold had recovered from the final low on November 3rd at 1,615 USD in no time to 1,788 USD, a one-week pullback to around 1,730 USD provided once again a reasonable entry opportunity. Already from November 23rd, however, the rally quickly resumed, and led gold further up to 1,810 USD.
This marked the beginning of an extremely tricky sideways consolidation around the 1,800 USD mark, which lasted several weeks. Although it gradually yet marginally reached higher highs again and again, sharp two-day pullbacks in the order of 40 to 60 USD called the uptrend into question each time.
Bearish wedge generated too much skepticism
However, as soon as the vast majority of market participants became aware of the potentially bearish wedge formation on the gold chart, the surprise happened to the upside and the next wave up started. With a low at 1,786 USD, gold briefly tested its 200-day moving average (1,777 USD), which has been running flat in the meantime. Since then, gold prices have exploded higher.
As of last Friday, spot gold reached 1,937 USD. And despite a small consolidation at a high levels, the round psychological mark of 1,900 USD has been held so far without any problems.
Of course, after such a strong rally, gold is now clearly overbought. Hence, the air is getting a little thinner every day. Nevertheless, one must assume that this rally still should go on, reaching higher levels in the coming weeks.
Monthly Chart – Monthly close above 1,960 unlikely
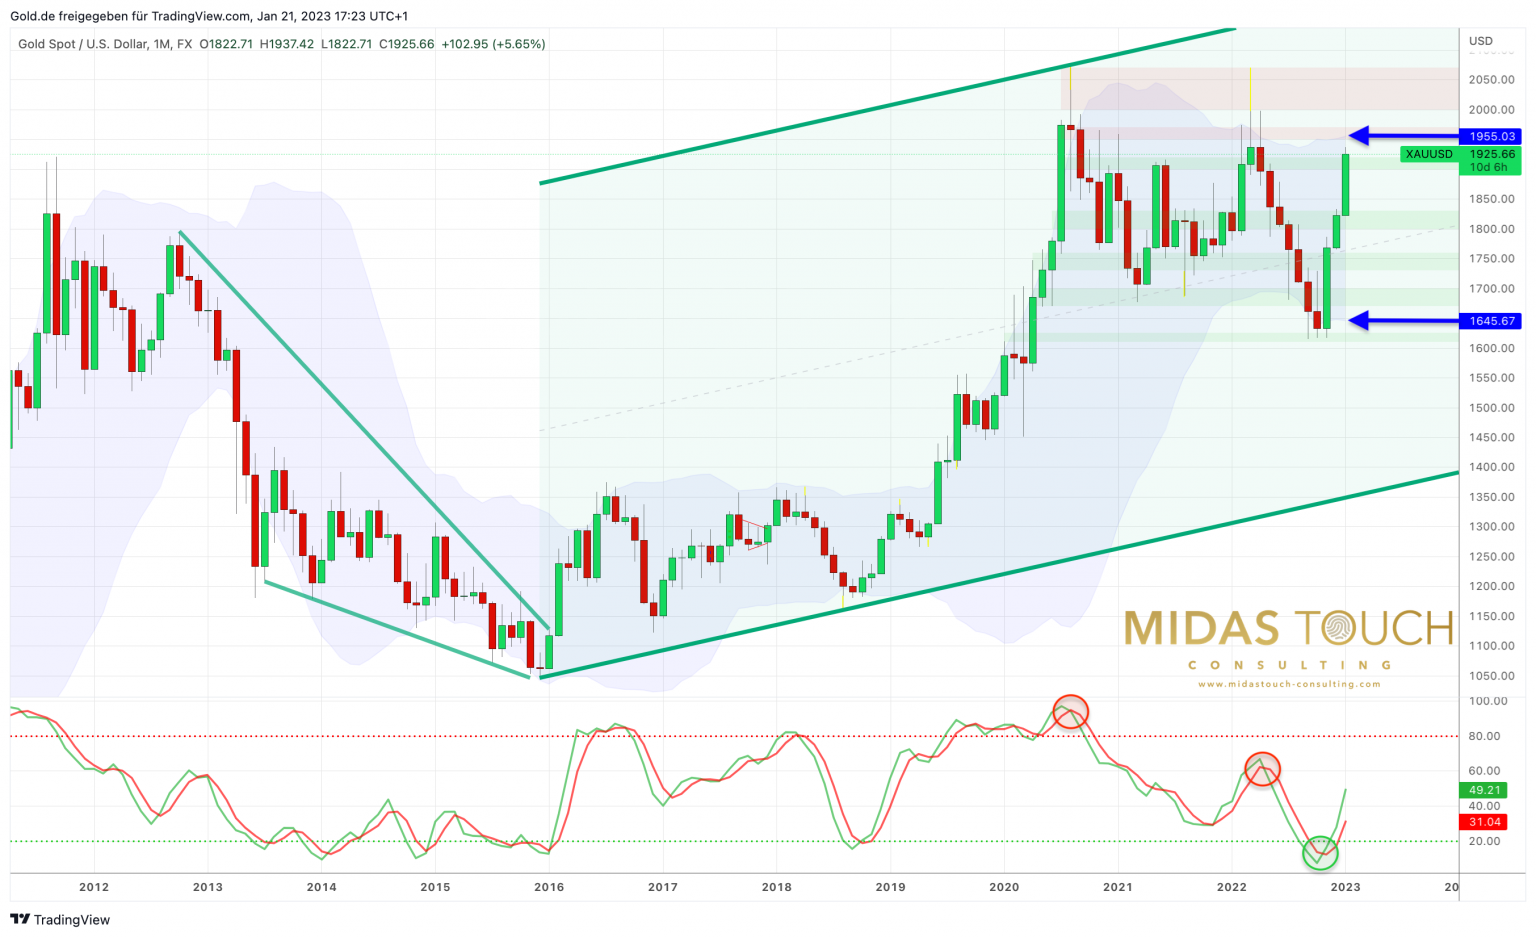
Gold in US-Dollar, monthly chart as of January 21st, 2023. ©Midas Touch Consulting
At the same time, the monthly Bollinger Band currently only allows a rise to around 1,953 USD. Therefore, a monthly closing price above this level has a maximum probability of only 5%!
Nevertheless, gold can of course explore the lofty heights around and above 2,000 USD for a few days. Also, a temporary test of the all-time high at 2,075 USD does not seem impossible.
However, experience teaches that in the next two months, typically a waterfall-like sell-off will abruptly end the rally that has been running since the beginning of November. Though it is not yet that far, and regardless of short-term pullbacks, gold should initially be able to easily trade above its 50-day moving average (1,806 USD) and also above its 18-day moving average (1,863 USD).
Conclusion: Gold – 2,000 US-Dollar, only a matter of time.
The minimum target of the current rally sits somewhere between 1,950 and 1,975 USD. Beyond that, a rise to around 2,050 USD has significantly increased chances. Subsequently, however, we expect gold to correct back to its then rising 200-day moving average. This would mean a pulling back to the area of about 1,850 USD later in spring or until early summer. Based on the seasonal pattern, we should expect a breakout above 2,075 USD only in the late summer or early fall and a rise towards around 2,500 USD in the 4th quarter 2023.
Gold in Euros: No new buy limit
Our last purchase buy limit of 1,675 Euro could be used on December 15th and 16th for additional purchases. Since then, gold prices have risen significantly in euro terms. As contrarians, we do not run after those rising prices. Instead, and from now, we exercise ourselves in patience and in the certainty that gold will pull back during the coming spring at least once.
****
Analysis initially published on January 19th, 2023, by www.gold.de. Translated into English and partially updated on January, 21st, 2023.
Feel free to join us in our free Telegram channel for daily real time data and a great community. If you like to get regular updates on our gold model, precious metals and cryptocurrencies, you can also subscribe to our free newsletter.
Disclosure: This article and the content are for informational purposes only and do not contain investment advice or recommendations. Every investment and trading move involves risk, and readers should conduct their own research when making a decision. The views, thoughts, and opinions expressed here are the author’s alone. They do not necessarily reflect or represent the views and opinions of Midas Touch Consulting.
*********
share
share
share
share
share
 Florian Grummes (born 1975 in Munich) has been studying and trading the Gold market since 2003. In 2008 he started publishing a bi-weekly extensive gold analysis containing technical chart analysis as well as fundamental and sentiment analysis. Parallel to his trading business he is also a very creative & successful composer, songwriter and music producer. You can reach Florian at: [email protected].


