Gold- The 30,000 Foot View


For our Thursday report, I wanted to zoom out and take a 30,000 ft. view of Gold & Miners. Often we get wrapped up in the day to day wiggles and giggles, forgetting to take a deep breath, step back and occasionally reanalyze.
Today, I have a few quarterly charts to view, each candlestick represents three months of time, and most of these charts go back several decades, with the gold chart reaching as far back as 1970.
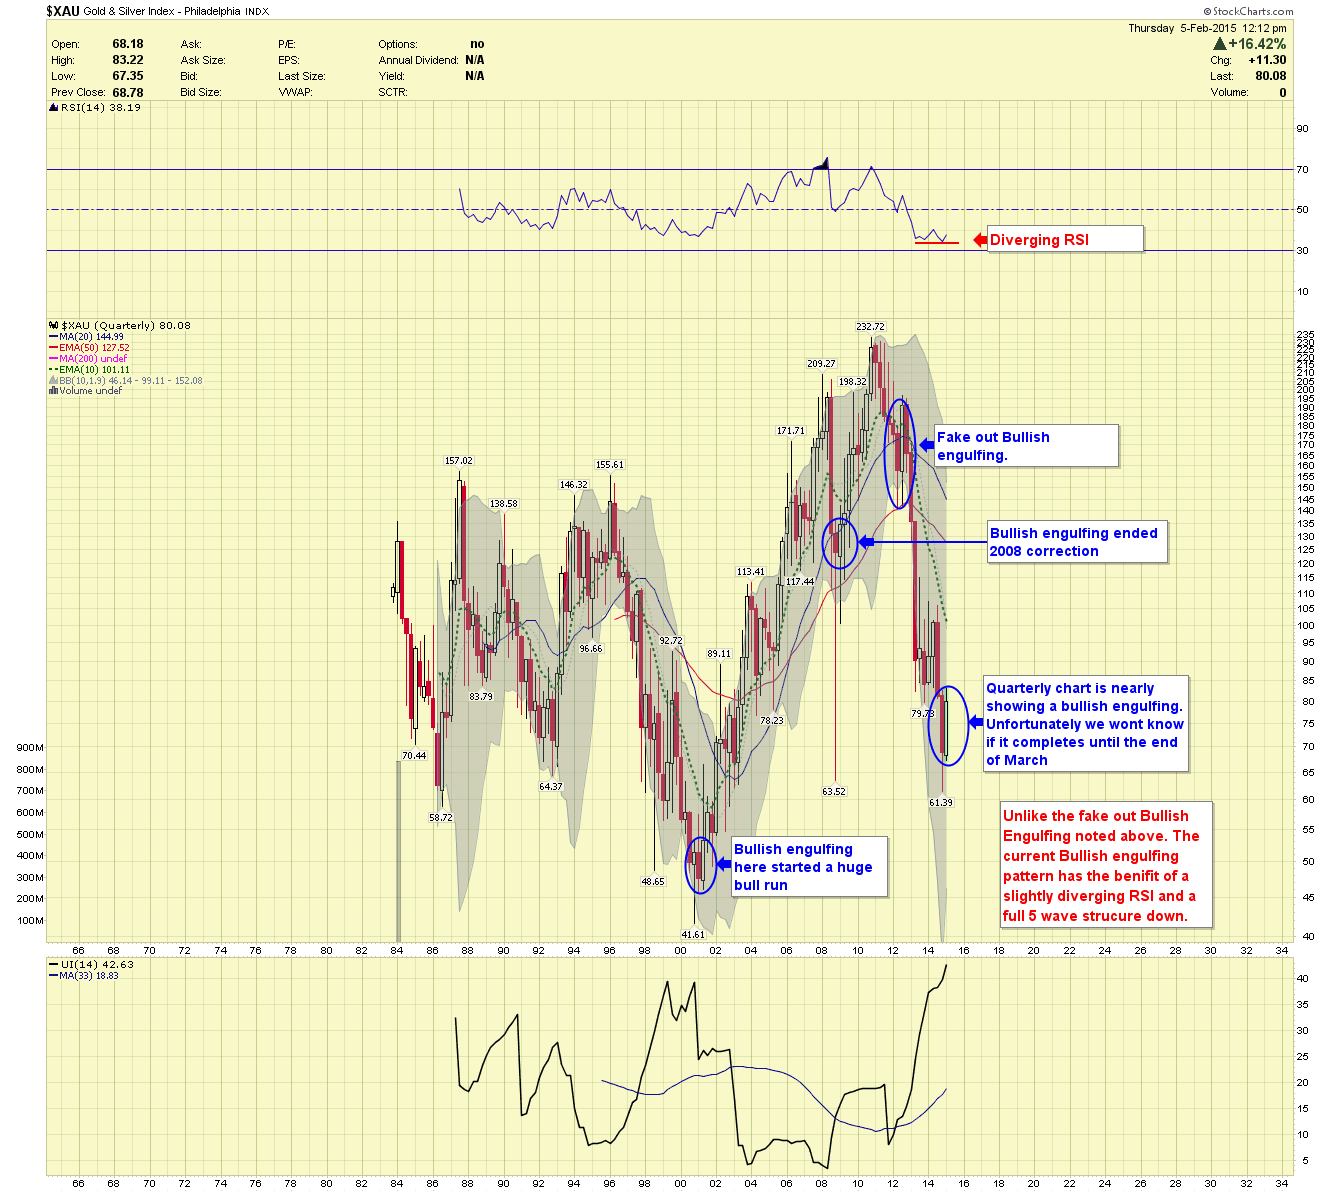
$XAU QUARTERLY- First we look at the $XAU chart, where you will see that price is nearly forming a Bullish engulfing pattern. Bullish engulfing’s ended the 2008 correction and started the major Bull Run in 2001. In 2012, there was a Bullish engulfing that proved to be a false signal. IF the XAU can close the quarter (end of March) with an actual Bullish engulfing pattern, I would seriously consider the correction over. Unfortunately, the end of March is a long way off and is also in the timing band for a Weekly cycle low in Gold. That means it’s likely not to finish the quarter as an exact Bullish engulfing but something we shall monitor.
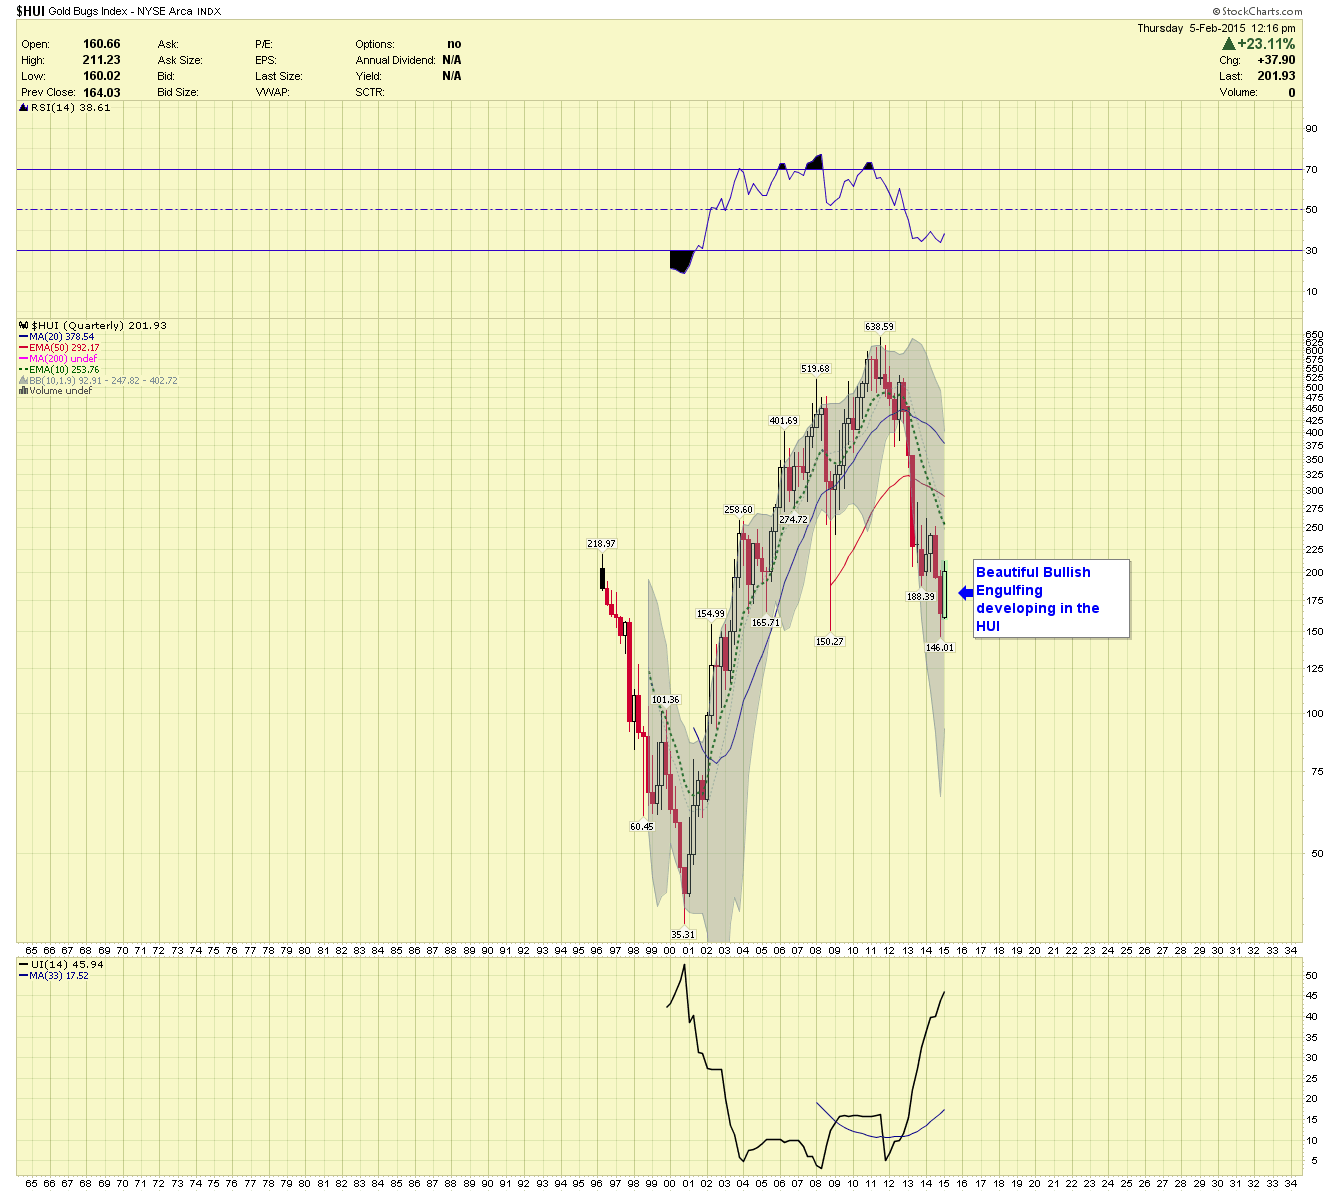
$HUI QUARTERLY- The $HUI is also showing a beautiful Bullish engulfing pattern, even more so complete. If price can finish the quarter completing the pattern, we will have an excellent buying opportunity for the next move up.
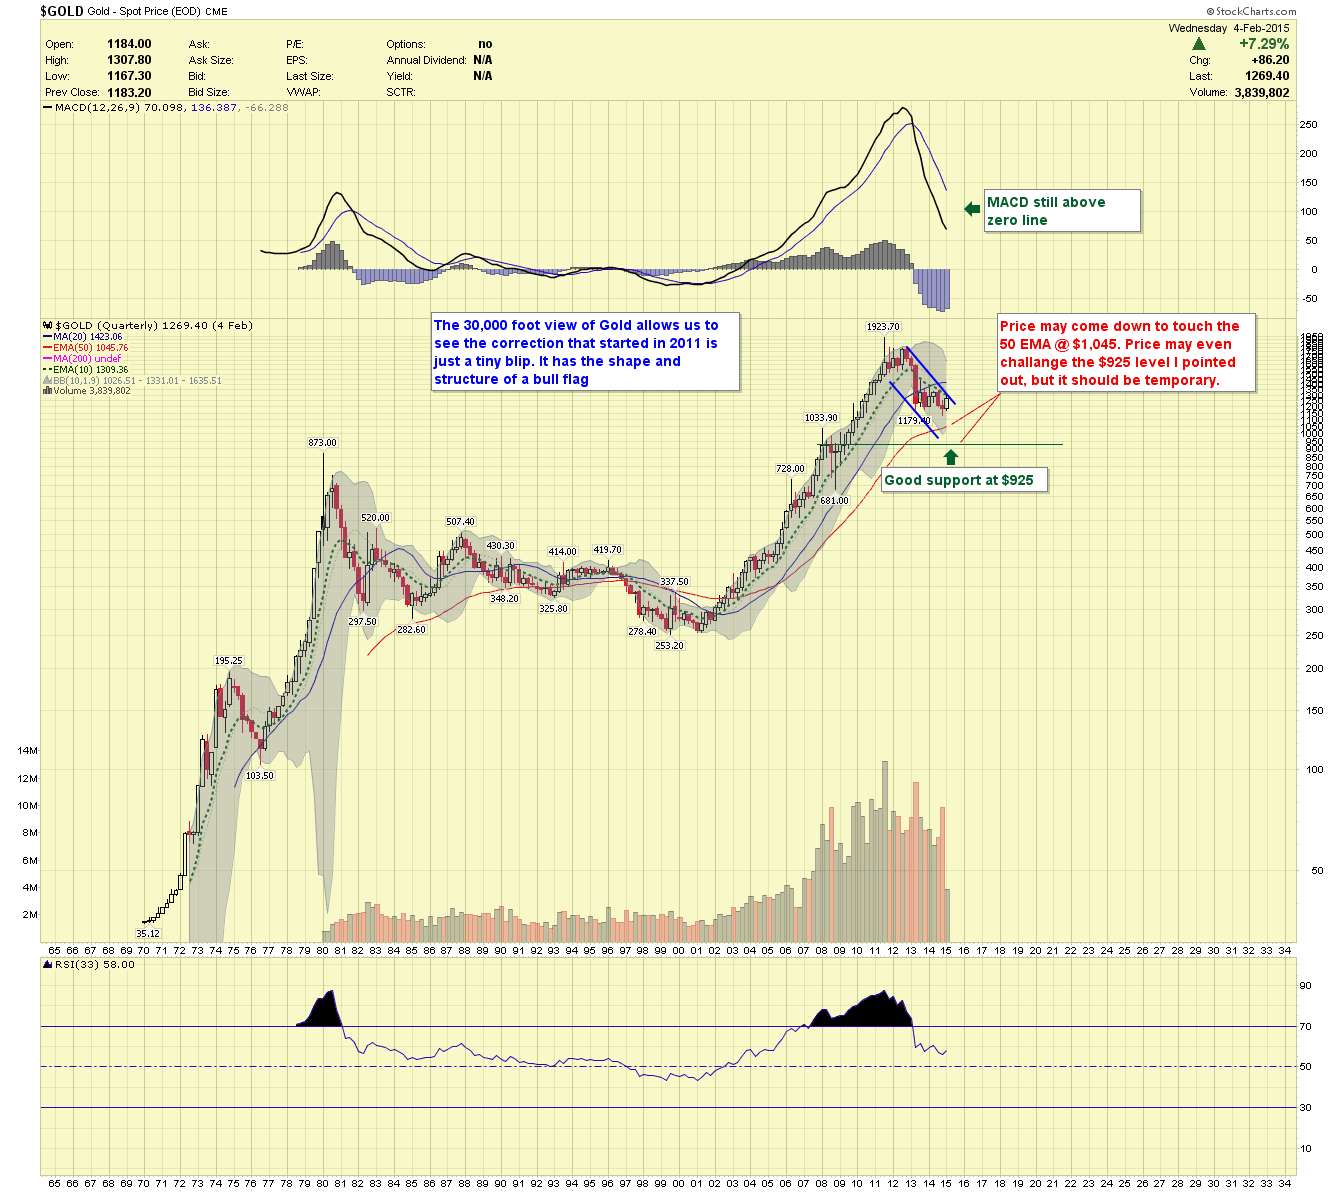
GOLD QUARTERLY- looking at this chart that starts in 1970 you’ll see this present correction beginning in 2011 in just a mere blip on the radar. It has the textbook shape and form of a continuation pattern called a flag pattern. I believe if price hasn’t bottomed already then it will end with touching the 50 quarter moving average ($1,045) or briefly breaching it finding support at the $925 level. However, a massive washout, triggering stops at $1,000 may pull prices as low as $850-$875. Any selloff should be very brief and quickly reverse $50-$100 once the selling stops.
THAT CONCLUDES THE QUARTERLY CHART REVIEW
Back to daily charts
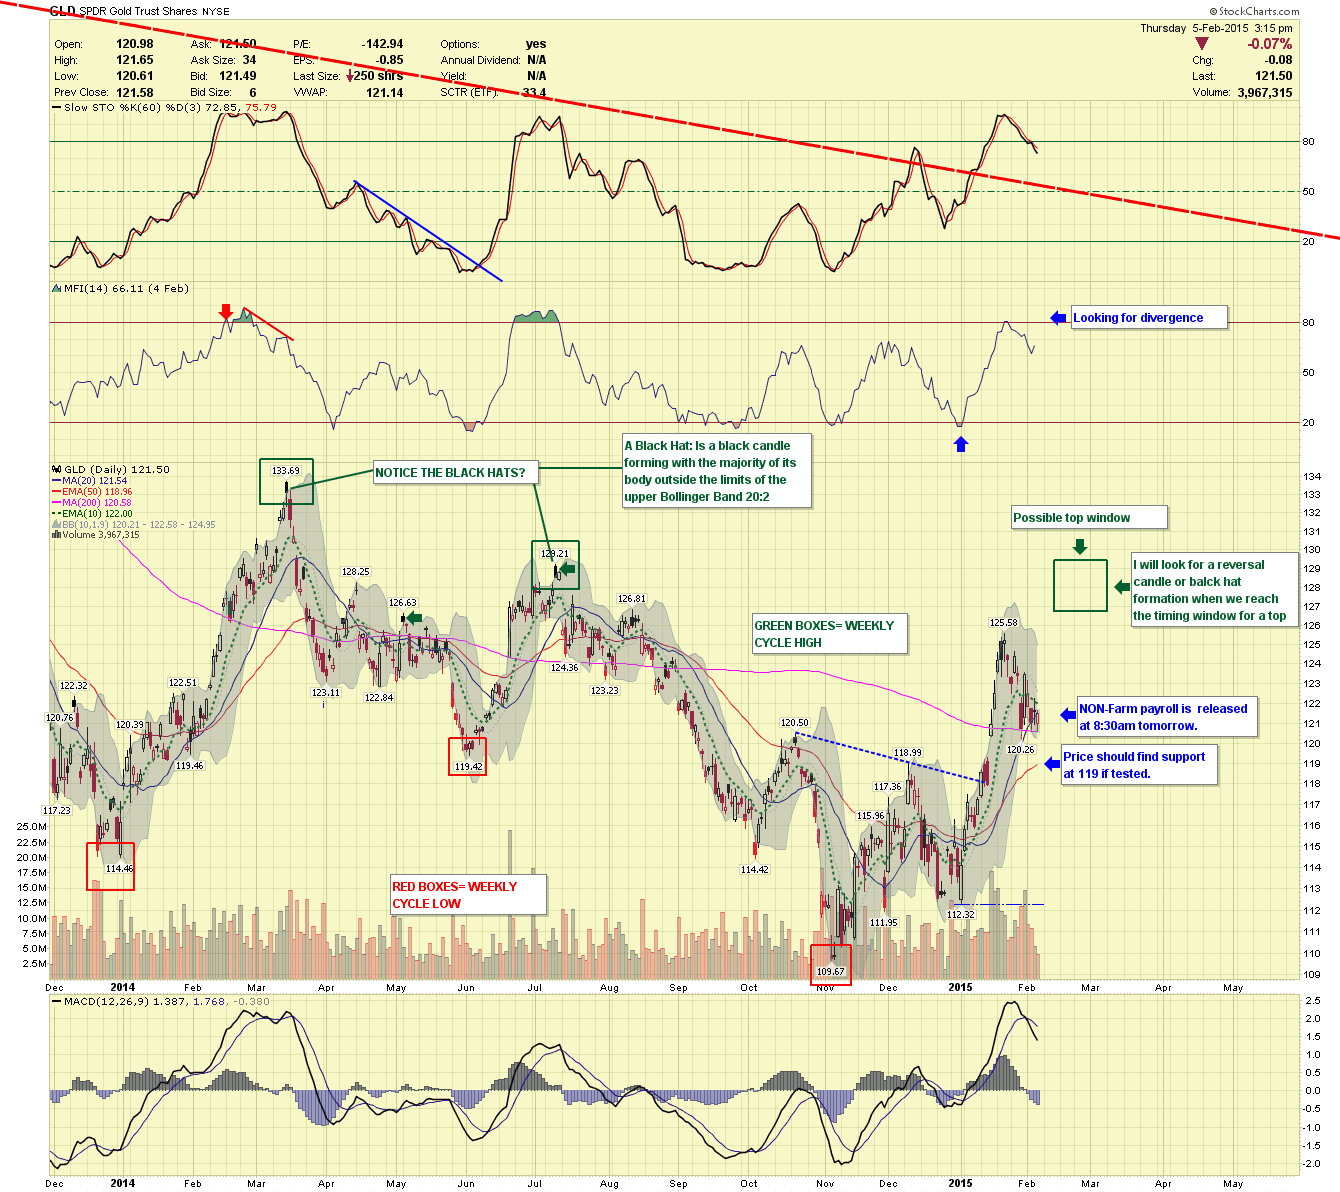
GLD DAILY- Chart looks to me like it wants to make a quick low (maybe tomorrow) and reverse. I see support at 119, but Non-Farm payroll could spice things up. The Example Portfolio may look at buying some GLD calls tomorrow morning, for those subscribed to Premium Example Portfolio.
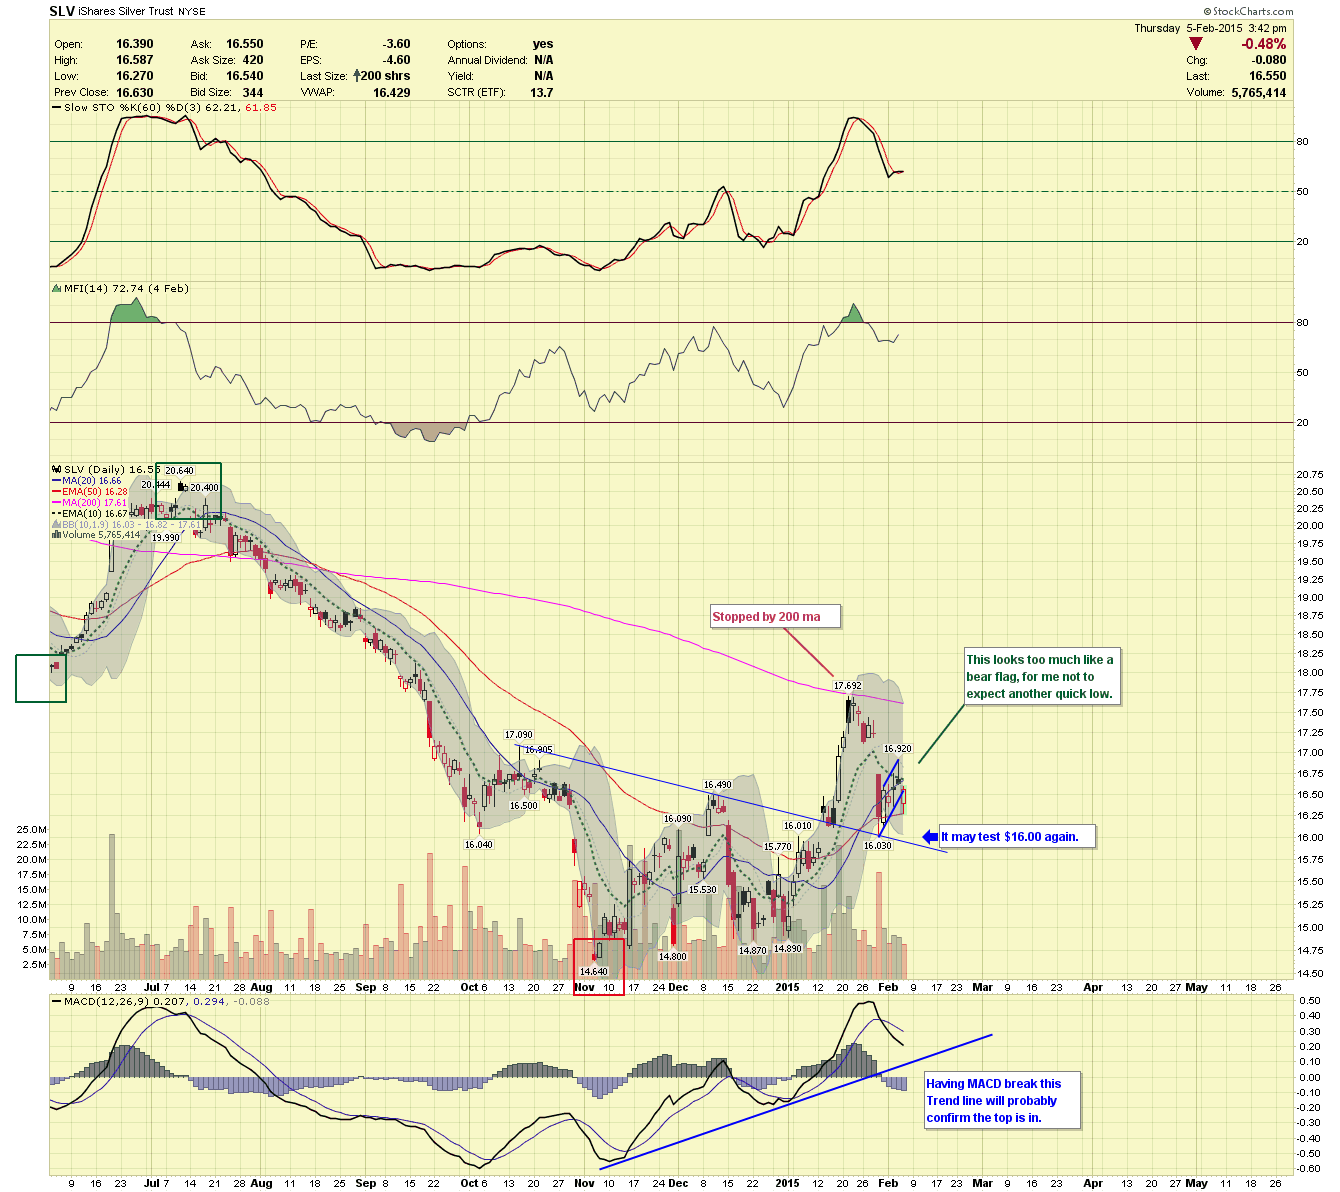
SLV DAILY- looks to have formed a small bear flag during this correction. If it plays out, price may take a quick dip to $16.00 range and quickly reverse.
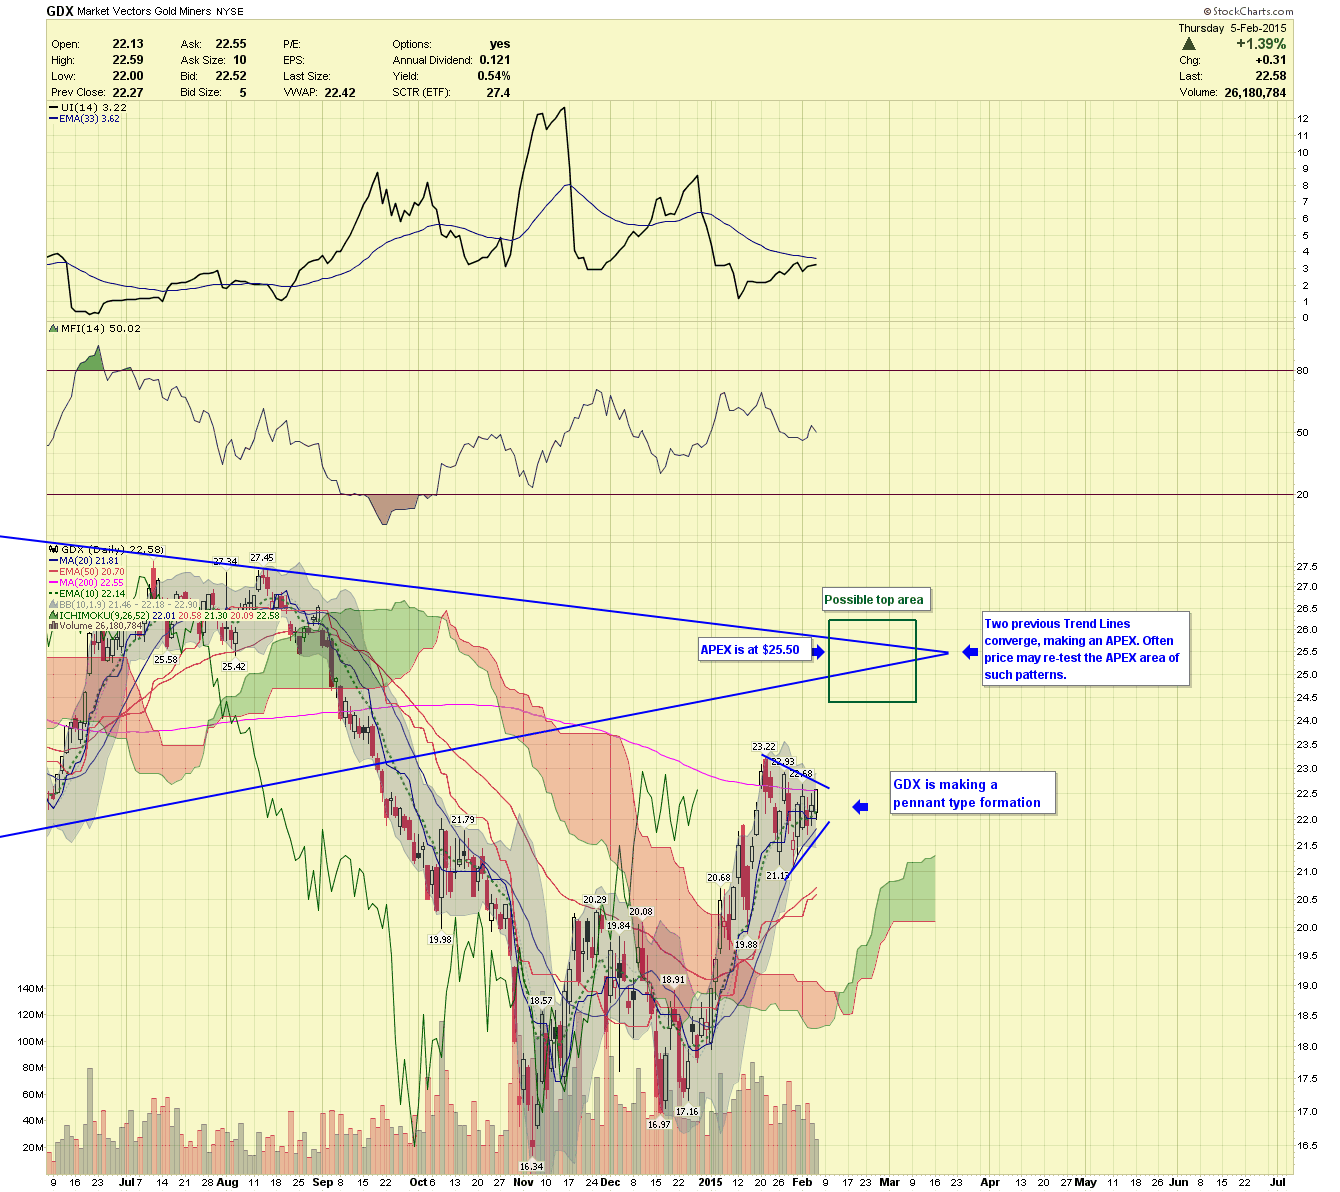
GDX DAILY- Looks to be making a pennant pattern. Two Trend Lines converge at the $25.50 level, the pattern converging the Trend Lines is not a typical triangle, but could still see a re-test of the APEX in such a pattern. I will be looking for signs of topping if prices head higher.
That is all for now; those subscribed to the EP (example portfolio) may receive a trade alert in the AM regarding GLD call options.
********
Courtesy of http://www.chartseek.com/


