Gold At The 3/4 Post Is Putting In A Year Over Which To Boast


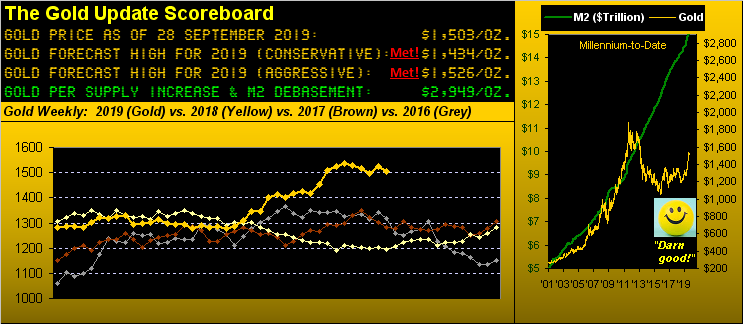
For Gold and its BEGOS Markets brethren, save for a day, we're now three-quarters of the way through 2019's trading mêlée. And in the midst of it all the precious metals have worked so as to themselves display above the much of fray such as shown via our year-to-date standings straightaway. Indeed for the top five in the stack, all of them at this juncture are sporting double-digit percentage increases in spite of the Dollar again being higher as 'twas a year ago when those same top five were instead lower:

"So that again shows your 'Gold knows no currency favourites' thing, mmb..."
Exactly right, Squire. In fact for the first completed 18 years of this millennium, Gold and the Dollar Index have finished on the same side of the percentage performance ledger in six of them, which for you WestPalmBeachers down there means that Gold and the Dollar have traveled in the same direction roughly 33% of the time. And as for this year's weakness in the EuroCurrencies and Copper, both the EuroZone and China can thank a comparatively firmer StateSide economy and a little good-old-fashioned TariffTalk. "Buy American!" 'Course, energy independence is an added (understatement) plus.
Still, all of that "rah-rah" aside, neither our Trade Deficit nor Current Account Deficit have yet to materially (if they ever shall) decrease. Or to once again quote Thelma Ritter from Paramount's "Boeing Boeing" back in '65: "It ain't easy, ya know..."
What has had the appearance of "easy" (until having just gone a bit queasy) is Gold's +17.0% performance so far this year. En route, the bears' selling stints have been muted, followed by the bulls' buying horns time-and-again tooted. In fact, Gold's performance through 2019's first three-quarters (with Monday still in the balance) ranks as fourth-best across the like period since 2001. Yet as for the "now", per confirmation a week ago, Gold by its weekly bars below has embarked upon a parabolic Short trend, price settling yesterday (Friday) at 1503 and quite near its low for the fourth time in the past five weeks. As well, the rising diagonal trend line looks ripe for at least a kiss. "Easy now..."
Still, it being but one trading day shy of month's end, let's go year-over-year in comparing Gold's percentage gain to those of its equities friends. And notwithstanding their now having a bit of a downside bend, the overall performances are nothing short of stellar. From this date a year ago, Agnico Eagle Mines (AEM) is +63%; the VanEck Vectors Gold Miners exchange-traded fund (GDX) is +50%; Franco-Nevada (FNV) is +49%; Newmont Mining Goldcorp (NEM) is +28%; Gold itself is +27%; the Global X Silver Miners exchange-traded fund (SIL) is +21%; and Pan American Silver (PAAS) +12%. Yes, the Silvers are lagging. But bear in mind per the above graphic the still historically-high extreme reading of the Gold/Silver Ratio at 85.5x, the millennium-to-date average being 64.7x: that "implies" Silver being at 23.23 today, 32% higher than its present 17.59 level. And lacking leverage is PAAS given that Silver itself year-over-year is +23%: but when that white metal gets white hot, watch out:
Watching over the Economic Barometer, it found mixed incoming sentiment indicators this past week. September's University of Michigan Survey was revised higher, however the Conference Board's read on the Consumer came in lower. August's New and Pending Home Sales improved, but the Federal Open Market Committee's favourite inflation gauge -- the Core Personal Consumption Expenditures Index -- recorded a surprisingly quiet +0.1%. Here's the whole picture from a year ago-to-date along with the S&P 500 (red line) and its three "terribles":
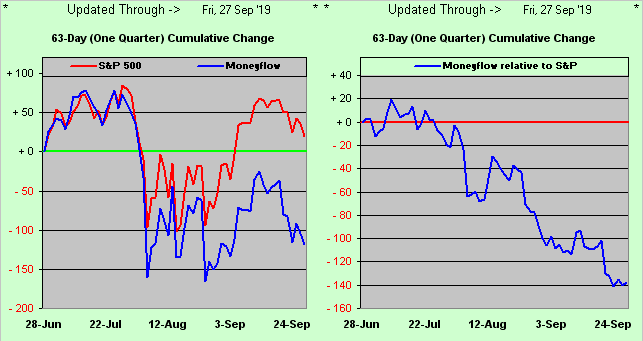
Specific to the S&P's three "terribles", the mighty Index does do its best to ignore them, but (as history has always shown) eventually succumb to them. Our longest running saw is of course with respect to Earnings, the "live" price/earnings ratio at present a staggeringly high 35.0x, (recalling ad nausea that in business school 15x was taught as being "expensive"). As for Moneyflow, in our graphic here at left is the points change in the S&P from three-months ago-to-date (red line) along with the Moneyflow regressed into S&P points (blue line) ... and then at right their difference, suggesting the S&P "ought be" some 140 points (-4.7%) lower than 'tis:
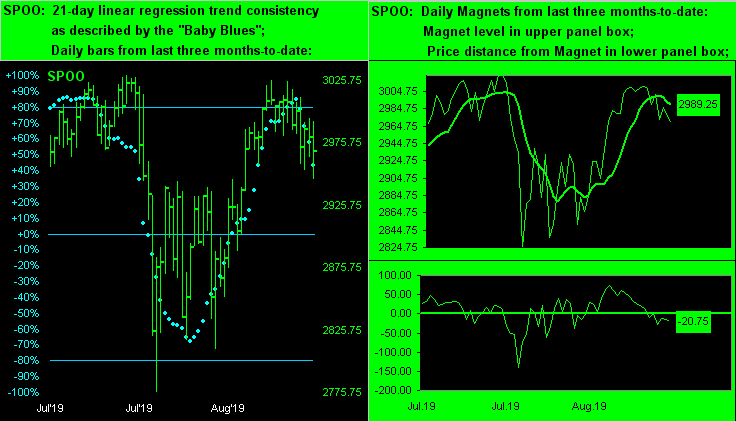
And then there's the Technicals next highlighted at left by the S&P futures "Baby Blues" of linear regression trend consistency having fallen under their +80% axis and at right by price having slipped under its Market Magnet:
Indeed a year ago we were clamouring for S&P 2154 and as aided by the Index's sharp autumnal sell-off, price made it 80% of the way down there, (for which we humbly say was a pretty good call). And whilst we're not overly concerned about the latest concoction of TrumpTroubles, we still keep in mind that ole pre-election support shelf of 2154 from back in 2016.
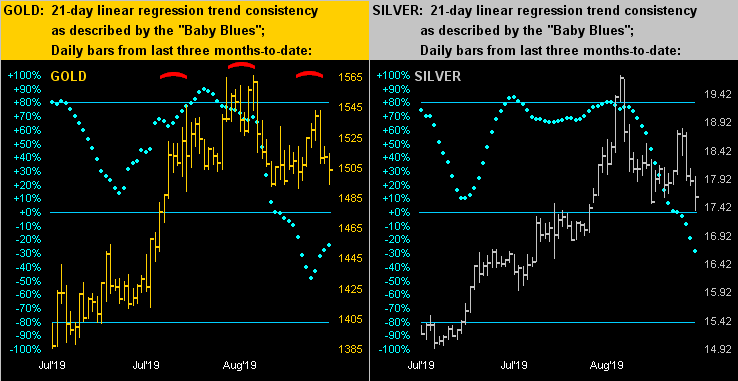
Speaking of support in turning to the precious metals' daily bars for the last three months, should Gold on the left break below the 1490s, as we've written of late 1454-1434 becomes the target area. Note the very nicely defined "head-and-shoulders" pattern therein (per the red curves). Yes, Gold's "Baby Blues" have turned back up; however until they bridge the 0% axis, the trend remains down. Silver on the right can find support in the mid-to-upper 16s, (which by the like time frame via Gold was arguably a very weak left shoulder for Silver):
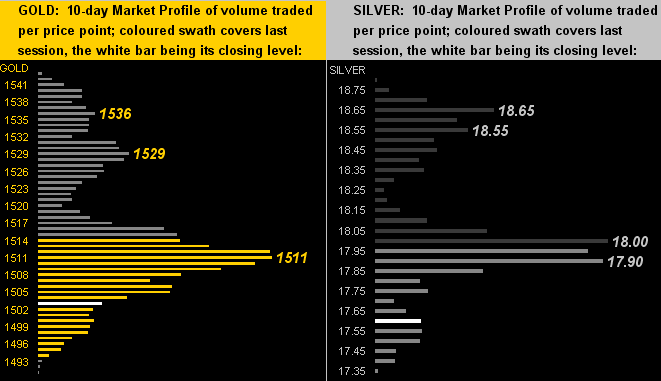
Zooming in on the past two weeks, prices in the 10-day Market Profiles for both Gold (left) and Silver (right) have been pogo-sticking from the bottom up to the top and now again back toward the bottom. Trader's delight if one can time it right. Gold's dominant overhead resistor as denoted is 1511 and likely so for Sister Silver is her 17.90-18.00 zone:
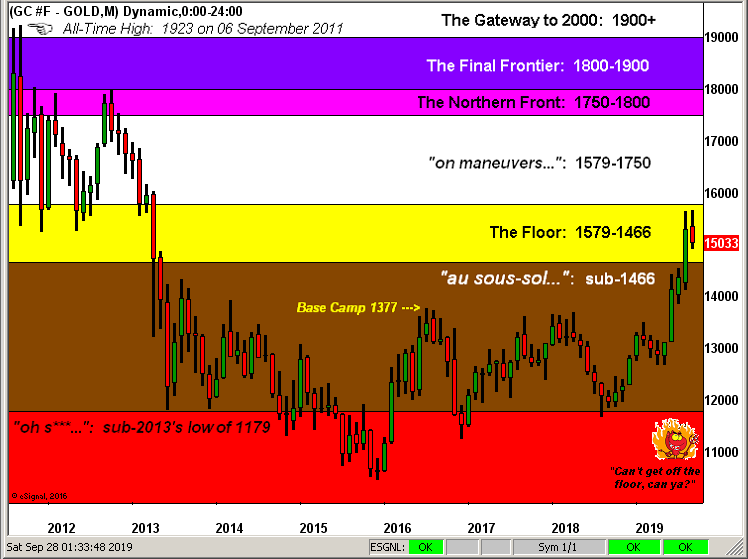
Finally, it being month's end save for a day, here is our broad view of Gold's Structure by the monthly bars since the All-Time-High-to-Date. And as you can see per the rightmost bar, Gold spent the entirety of September, (barring slippage come Monday sub-1466) on "The Floor" which is of course a terrific positive considering from where price has come. Still, should Gold not settle Monday above 1535, 'twill be price's first down month since April. And yet on balance, we gotta say 'tis great to finally be back "Dancing on the floor..."--(Third World, '81):
Meanwhile, stumbling from the stage floor bassackward down into the orchestra pit is bits**t following another foray for forming a futures product that folks would rather skip. Ought we be surprised? No. Month-to-date, the average hourly volume for bitcoin traded on the CME Group platform is 151 contracts. That's it. Comparably, average hourly contract volume for Silver is 5,395; for Gold 17,393; for Oil 29,931; and for the S&P 62,606. Or in more stark perspective, S&P contracts trade the average hourly bitcoin equivalent in nine seconds. So "Don't go for second best, baby"--(Madonna '89) put your Gold to the test!
www.deMeadville.com
www.TheGoldUpdate.com
********

Mark Mead Baillie has had an extensive business career beginning in banking and financial services for two years with Banque Nationale de Paris to corporate research for three years at Barclays Bank and then for six years as an analyst and corporate lender with Société Générale.
For the last 22 years he has expanded his financial expertise by creating his own financial services company, de Meadville International, which comprehensively follows his BEGOS complex of markets (Bond/Euro/Gold/Oil/S&P) and the trading of the futures therein. He is recognized within the financial community of demonstrating creative technical skills that surpass industry standards toward making highly informed market assessments and his work is featured in Merrill Lynch Wealth Management client presentations. He has adapted such skills into becoming the popular author each week of the prolific “The Gold Update” and is known in the financial website community as “mmb” and “deMeadville”.
Mr. Baillie holds a BS in Business from the University of Southern California and an MBA in Finance from Golden Gate University.


