Gold And Silver Price Goals For Year End
Each of the past five years, we've predicted a year-end and new-year rally in precious metals. And for each of the past five years, the market has performed as forecast. So, what can be expected as 2018 becomes 2019?
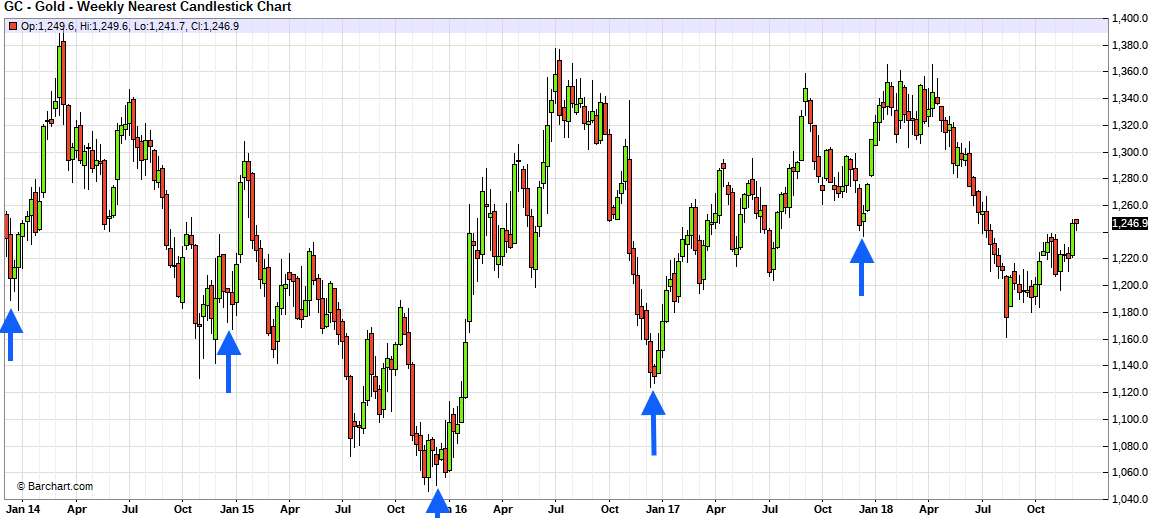
Let's begin with the past. As mentioned above, each of the past five years have seen year-end gold and silver price rallies. These rallies have begun around the time of the December FOMC, they have persisted through any remaining tax-loss selling, and they extended into the new year. Specifically,
- COMEX gold saw a mid-December 2013 low of $1190. By early March 2014, it traded as high as $1388.
- COMEX gold closed at $1196 on December 19, 2014. Some late year selling drove price to near $1170 before it rallied to a high of $1308 in late January 2015.
- COMEX gold saw its 2011-2015 bear market lows near $1050 in the days following the FOMC in December of 2015. It was as high as $1261 by early February 2016, on its way to $1376 in early July of that year.
- COMEX gold was back to $1125 by the time of the December FOMC in 2016. It immediately began to turn and reached a high of $1261 in early February 2017.
- And last year, COMEX gold bottomed again in the days surrounding the December FOMC, reaching a low of $1236 on December 12. It finished the year at $1309, on its way to $1363 by January 25, 2018.
So what should we expect this year? Well, given the falling equity markets, the soaring bond markets, economic and political uncertainty AND the prospect of a change in Fed policy for 2019... why would we NOT expect another year-end rally that extends the streak to six consecutive years?
To that end, what are the key price levels to watch as we head into next week's FOMC meeting and then the last few weeks of 2018?
As you know, 2018 has been a very difficult year for gold and silver prices. After peaking in Q1, prices have moved consistently lower due to a strong dollar, a weaker yuan and rising interest rates. This environment drove hedge funds and other "managed money" accounts into some of the most-heavily net short positions in COMEX gold and silver that we have ever recorded. The unwind of these positions (and flip to net long) has begun as technical indicators improve. Thus watch the key, technical levels into year end. As they are broken to the upside, Speculator money will switch from short to long and from selling-the-rally to buying-the-dip.
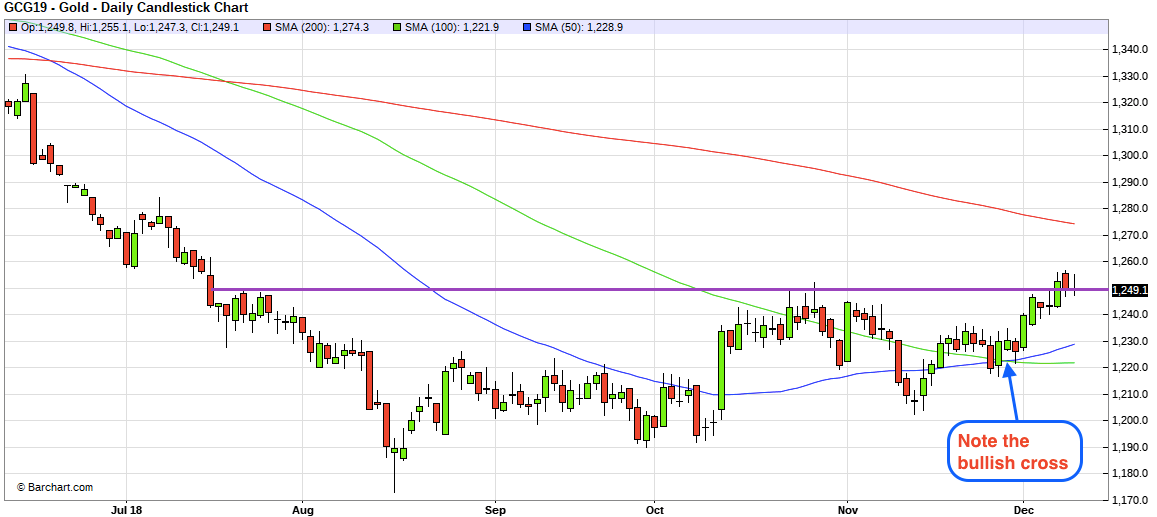
Specifically for COMEX gold, the key level to watch will be the 200-day moving average, currently found near $1274 and falling by the day. Be sure to note that price is currently above both the 50-day and 100-day moving averages, and that the 50-day has just recently painted a bullish cross of the 100-day. Already we're seeing this impact the hedge funds, as evidenced in the most recent Commitment of Traders report. An upward break of the 200-day will accelerate the drive of the Specs back into the long side, and this event, when it occurs, will catapult COMEX gold toward $1300. If it can occur soon enough, COMEX gold prices could actually make it all the way back to even on the year with a move back to $1309. Given all of the current malaise and dislike of gold—and the fact that the equity markets are also currently showing negative returns for the year thus far—a move back to break even would be a tremendous (and unexpected) accomplishment.
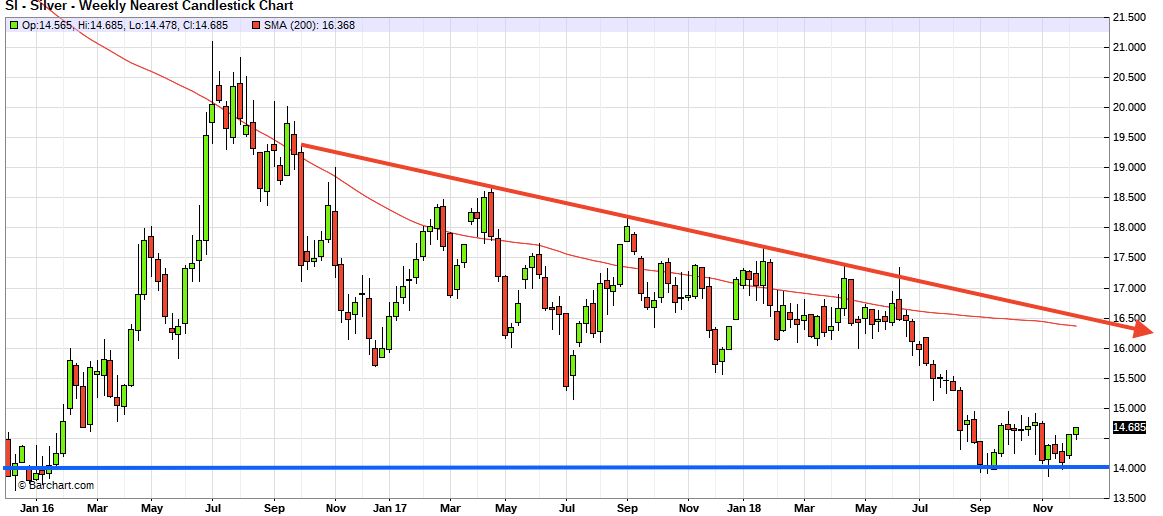
COMEX Digital Silver has seen similar rallies each of the past five years, with the biggest jump coming in 2016, when price moved from below $14 in December of 2015 to a high in excess of $21 in July of 2016. Could another such surge be coming in 2019? Of course!
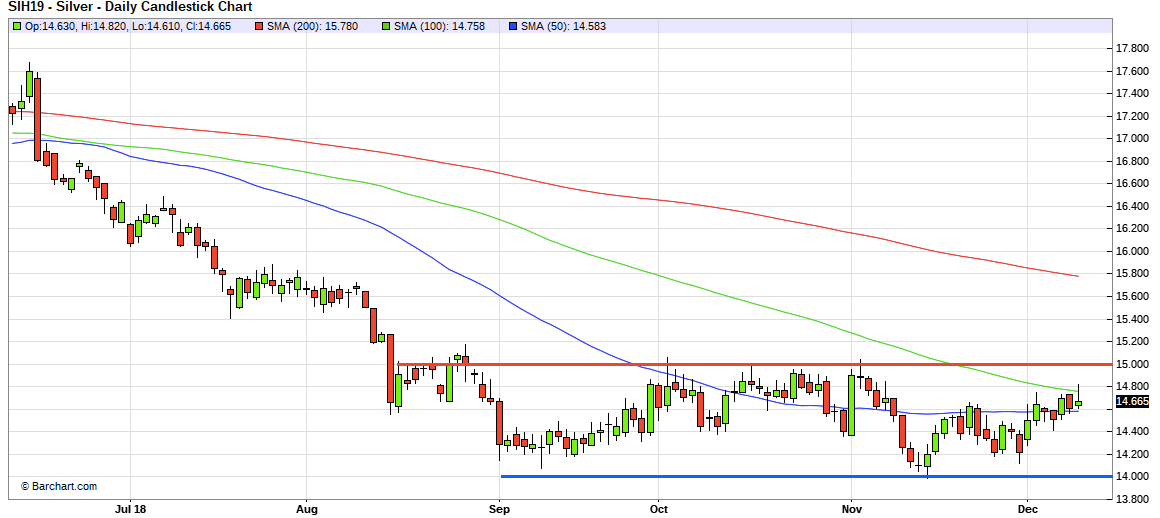
But, like COMEX gold, price needs to first accomplish a few technical breakouts before the hedge funds, which are still historically short COMEX silver exposure, are forced to cover and move long.
In the short term, price needs to get past the 100-day moving average and then establish a toehold above $15. Once there, it will soon encounter its own 200-day moving average, which is currently near $15.78 and falling.
Once past the 200-day, silver will extend its early 2019 gains to near 10% and the $16.50 level. Unfortunately, there it will encounter the 200-week moving average and the trendline that The Banks have strictly enforced since late 2016. Will silver be able to break through this fabricated resistance and run free to $20 and beyond? It's impossible to answer that question at this point, but with all of the uncertainty surrounding global events, it's not out of the realm of possibility. The year 2019 may eventually resemble 2010, the last time the Fed went from "hawkish" to full on QE over the course of the year. Should this happen again, all bets are off.
In conclusion, it's entirely logical to expect higher gold and silver prices in 2019. If you already hold physical precious metal, the time is now to add more to your stack... possibly bringing down your average cost as a result. If you've not yet begun to build a portfolio of physical metal, what are you waiting for? Purchasing real, physical gold and silver is easy! It can be held at a trusted gold bullion storage company or in your own, personal safe. You can hold it in gold bullion coins or silver bullion bars. Take your pick. Just be sure to buy some soon, as 2019 promises to be another eventful and chaotic year around the globe.
The views and opinions expressed in this material are those of the author as of the publication date, are subject to change and may not necessarily reflect the opinions of Sprott Money Ltd. Sprott Money does not guarantee the accuracy, completeness, timeliness and reliability of the information or any results from its use. You may copy, link to or quote from the above for your use only, provided that proper attribution to the author and source is given and you do not modify the content. Click Here to read our Article Syndication Policy.
*********


